More homebuyers jumped into the market as mortgage rates came down temporarily last week, but it’s still slower than past springs.
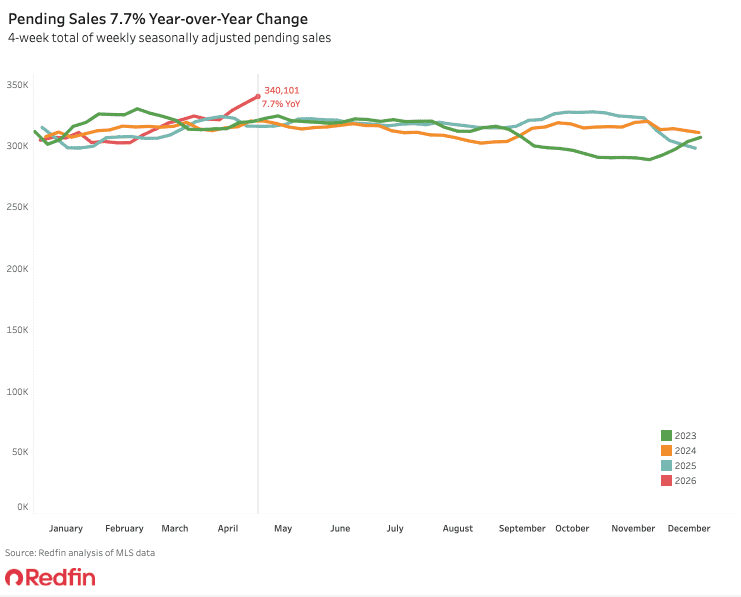
U.S. pending home sales hit their highest level since September 2022 during the four weeks ending May 3. They rose 7.7% year over year on a seasonally adjusted basis.
There are a few reasons homebuyers are coming off the sidelines:
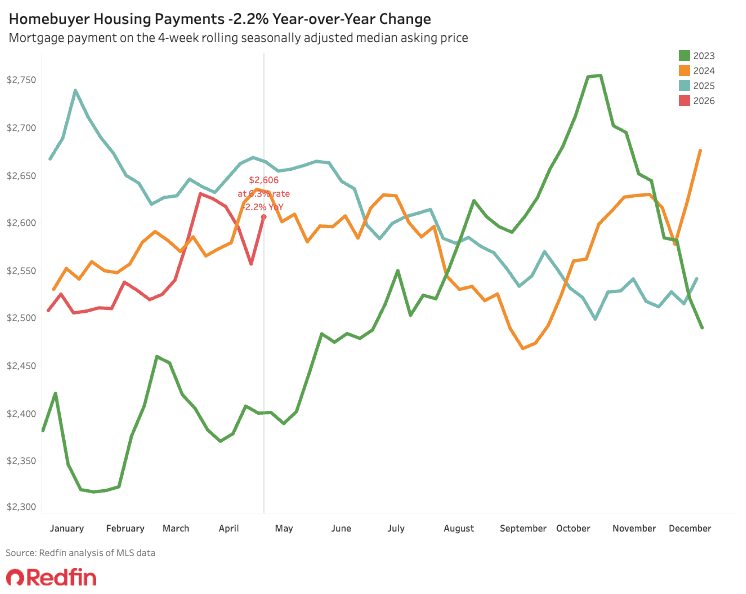
- Housing costs came down temporarily. The median U.S. housing payment declined 2.2% year over year as mortgage rates ticked down. Rates fell to 6.23% last week from a 6-month high of 6.46% two weeks earlier. (Daily average rates rose as high as 6.56% this week due to jitters about renewed fighting and uncertainty in Iran.)
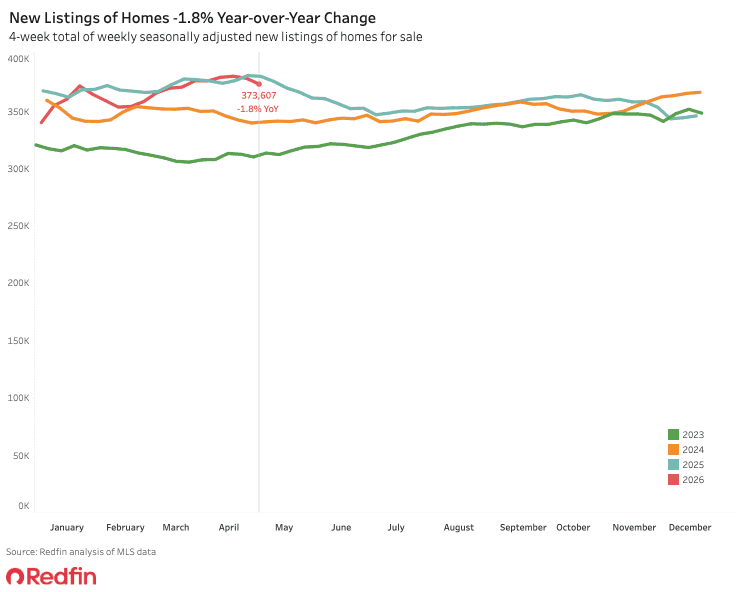
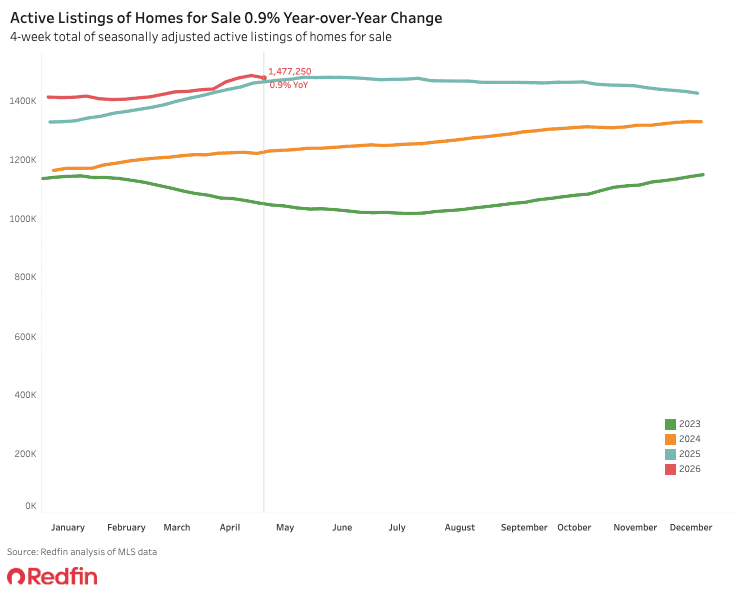
- There are more houses on the market. The total number of homes for sale rose roughly 1% year over year to near their highest level in at least five years. When there are more homes to buy, there are more sales.
- Seasonality is kicking in later than usual. Spring is typically the busiest time of year for the housing market: A recent Redfin analysis found that late April is the best time of year to list a home for sale because homes are more likely to sell above their asking price, and to sell quickly. The big uptick in seasonally adjusted pending sales could signal that spring homebuying season is starting late.
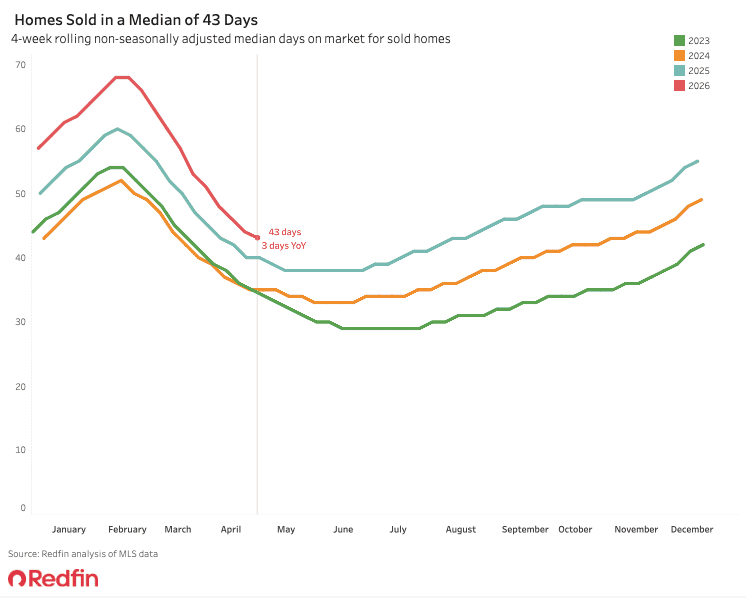
Still, the market is slower and less competitive than past springs. The typical home that sells goes under contract in 43 days, three days longer than a year ago. Just over one-quarter (26.4%) of homes that go under contract are selling above asking price, the lowest share for this time of year in at least five years.
“Some homes are attracting multiple offers, but only those that are priced fairly and have been updated,” said Ashley Arzer, a Redfin Premier agent in Chicago. “A new kitchen and new bathroom are the ticket to a bidding war. Older homes that need repairs, and those far above the most popular price range–around $400,000 in Chicago–are taking longer to sell.”
For Redfin economists’ takes on the housing market, please visit Redfin’s “From Our Economists” page.
Leading indicators
| Indicators of homebuying demand and activity | ||||
| Value (if applicable) | Recent change | Year-over-year change | Source | |
| Daily average 30-year fixed mortgage rate | 6.44% (May 6) | Down from 6.56% on May 4, which was the highest level since end of March | Down from 6.9% | Mortgage News Daily |
| Weekly average 30-year fixed mortgage rate | 6.3% (week ending April 30) | Up from 6.23% one week earlier | Down from 6.76% | Freddie Mac |
| Mortgage-purchase applications (seasonally adjusted) | Down 4% from a week earlier (as of week ending May 1) | Up 5% | Mortgage Bankers Association | |
| Google searches of “homes for sale” | Highest level in 9 months (as of May 4) | Up more than 20% | Google Trends | |
| Touring activity | Up 32% from the start of the year (as of May 4) | At this time last year, it was up 43% from the start of 2025 | ShowingTime | |
Key housing-market data
| U.S. highlights: Four weeks ending May 3, 2026
Redfin’s national metrics include data from 900+ U.S. metro areas and are based on homes listed and/or sold during the period. Weekly housing-market data goes back through 2021. Subject to revision. |
|||
| Four weeks ending May 3, 2026 | Year-over-year change | Notes | |
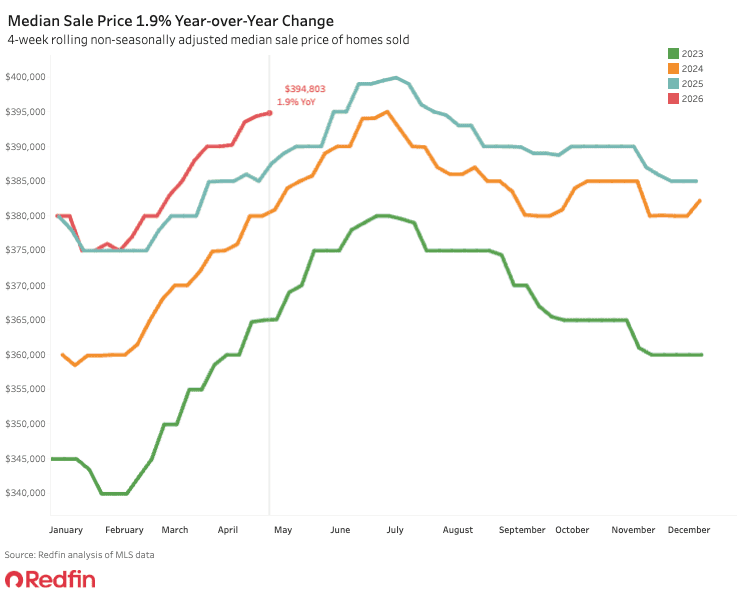
| Median sale price | $394,803 | 1.9% | |
| Median asking price (seasonally adjusted) | $406,493 | 1.5% | |
| Median monthly mortgage payment (seasonally adjusted) | $2,606 at a 6.3% mortgage rate | -2.2% | |
| Pending sales (seasonally adjusted) | 340,101 | 7.7% | |
| New listings (seasonally adjusted) | 373,607 | -1.8% | |
| Active listings (seasonally adjusted) | 1,477,250 | 0.9% | |
| Months of supply | 3.5 | -0.1 pts. | 4 to 5 months of supply is considered balanced, with a lower number indicating seller’s market conditions |
| Share of homes off market in two weeks | 39.2% | Down from 40% | |
| Median days on market | 43 | +3 days | |
| Share of home listings with price drops | 18.8% | Essentially unchanged | |
| Share of homes sold above list price | 26.4% | Down from 28% | |
| Average sale-to-list price ratio | 98.7% | Down from 99% | |
|
Metro-level highlights: Four weeks ending May 3, 2026 Redfin’s metro-level data includes the 50 most populous U.S. metros. Select metros may be excluded from time to time to ensure data accuracy. |
|||
|---|---|---|---|
| Metros with biggest year-over-year increases | Metros with biggest year-over-year decreases |
Notes |
|
| Median sale price | San Francisco (11%)
Cleveland (8.2%) Kansas City, MO (7.9%) Cincinnati (7.5%) Detroit (7.4%) |
Newark, NJ (-3.3%)
San Jose, CA (-3.2%) Seattle (-3.2%) Dallas (-3.2%) Las Vegas (-2.5%) |
Declined in 19 metros |
| Pending sales | Chicago (19.2%)
Pittsburgh (16.5%) San Francisco (15.2%) Miami (15%) Austin, TX (14.6%) |
Houston (-9.3%)
Detroit (-3.3%) Seattle (-2.7%) Warren, MI (-1.8%) |
Declined in just 4 metros |
| New listings | Columbus, OH (9.5%)
Nassau County, NY (9.4%) Cincinnati (9.2%) Milwaukee (9.1%) Newark, NJ (9.1%) |
Dallas (-14.9%)
Jacksonville, FL (-14.5%) Denver (-14.3%) Fort Worth, TX (-13%) Las Vegas (-13%) |
|
Refer to our metrics definition page for explanations of all the metrics used in this report.