
- Improving homebuyer demand could fuel further price gains in the coming months.
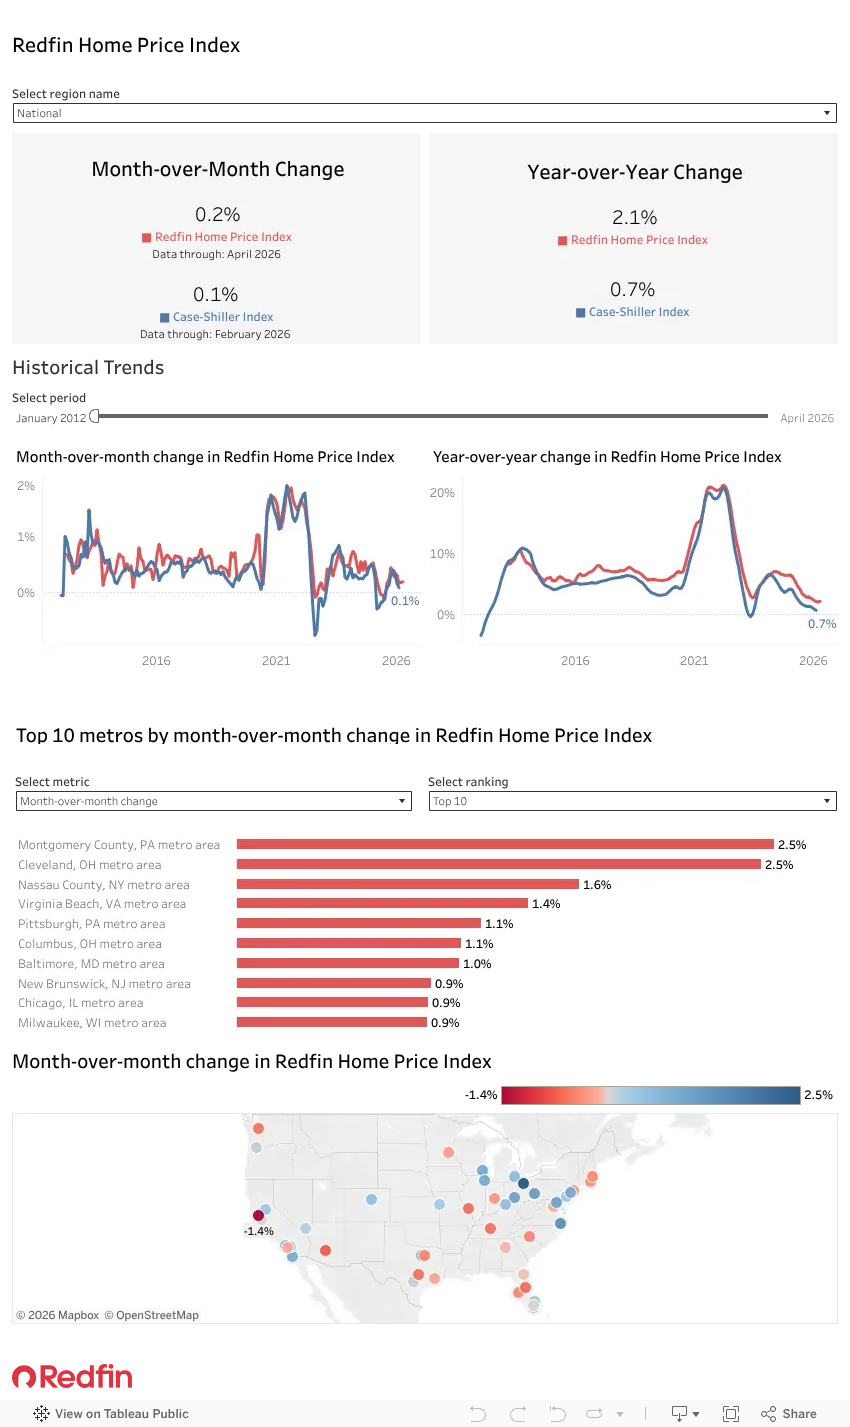
- Montgomery County, PA saw the biggest price gain, followed by Cleveland and Nassau County, NY. The biggest declines were in Oakland, CA, Newark, NJ and Phoenix.
U.S. home prices rose 0.2% month over month in April on a seasonally adjusted basis, and climbed 2.1% year over year.
This is according to the Redfin Home Price Index (RHPI), which uses the repeat-sales pricing method to calculate seasonally adjusted changes in single-family home prices. The RHPI measures how sale prices of homes have changed since their previous sale—similar to the S&P Cotality Case-Shiller Home Price Indices—but is reported about a month earlier. April data covers the three months ending April 30, 2026. Read the full RHPI methodology here.
“An improving labor market is buoying homebuyer demand, which is keeping home price growth afloat. Even though prices are rising, buyers still have bargaining power because they’re outnumbered by sellers,” said Redfin Senior Economist Asad Khan. “If housing demand keeps climbing, sellers may regain some of that power, causing home prices to rise further.”
Home Prices Rose Most in Montgomery County, Fell Most in Oakland
In Montgomery County, PA, home prices climbed 2.5% month over month on a seasonally adjusted basis in April—the biggest increase among the U.S. metropolitan areas Redfin analyzed. Next came Cleveland (2.5%), Nassau County, NY (1.6%), Virginia Beach, VA (1.4%) and Pittsburgh (1.1%).
Redfin analyzed the 50 most populous metros and included in this analysis the 49 with sufficient data (Fort Lauderdale, FL is excluded).
Prices fell from a month earlier in 21 metros. The biggest declines were in Oakland, CA (-1.4%), Newark, NJ (-1.3%), Phoenix (-0.7%), Orlando, FL (-0.6%) and St. Louis (-0.5%).
Redfin Home Price Index Metro-Level Summary: April 2026
| U.S. metro area | Month-over-month change | Year-over-year change |
|---|---|---|
| Anaheim, CA | -0.2% | 3.3% |
| Atlanta, GA | -0.1% | -2.0% |
| Austin, TX | -0.5% | -2.1% |
| Baltimore, MD | 1.0% | 3.9% |
| Boston, MA | -0.3% | 2.3% |
| Charlotte, NC | -0.4% | 4.3% |
| Chicago, IL | 0.9% | 10.8% |
| Cincinnati, OH | 0.5% | 2.9% |
| Cleveland, OH | 2.5% | 7.8% |
| Columbus, OH | 1.1% | 0.9% |
| Dallas, TX | -0.4% | -3.5% |
| Denver, CO | 0.5% | 1.0% |
| Detroit, MI | 0.5% | 6.8% |
| Fort Worth, TX | 0.6% | -1.2% |
| Houston, TX | -0.2% | -1.5% |
| Indianapolis, IN | -0.3% | 0.8% |
| Jacksonville, FL | -0.1% | -2.9% |
| Kansas City, MO | 0.3% | 1.9% |
| Las Vegas, NV | 0.2% | 0.0% |
| Los Angeles, CA | 0.6% | 1.1% |
| Miami, FL | 0.4% | 2.8% |
| Milwaukee, WI | 0.9% | 9.4% |
| Minneapolis, MN | -0.2% | 1.9% |
| Montgomery County, PA | 2.5% | 10.1% |
| Nashville, TN | -0.5% | -0.4% |
| Nassau County, NY | 1.6% | 9.1% |
| Newark, NJ | -1.3% | 5.5% |
| New Brunswick, NJ | 0.9% | 3.3% |
| New York, NY | -0.3% | 7.5% |
| Oakland, CA | -1.4% | -0.7% |
| Orlando, FL | -0.6% | -1.7% |
| Philadelphia, PA | 0.3% | 6.7% |
| Phoenix, AZ | -0.7% | -0.9% |
| Pittsburgh, PA | 1.1% | 6.2% |
| Portland, OR | 0.1% | 0.7% |
| Providence, RI | -0.3% | 2.8% |
| Riverside, CA | 0.2% | -0.5% |
| Sacramento, CA | 0.3% | 0.4% |
| St. Louis, MO | -0.5% | 4.2% |
| San Antonio, TX | 0.1% | -3.1% |
| San Diego, CA | 0.9% | 1.8% |
| San Francisco, CA | 0.0% | 10.8% |
| San Jose, CA | 0.1% | 2.6% |
| Seattle, WA | -0.5% | -0.7% |
| Tampa, FL | -0.3% | 2.5% |
| Virginia Beach, VA | 1.4% | 5.2% |
| Warren, MI | 0.6% | 3.1% |
| Washington, DC | -0.1% | 0.8% |
| West Palm Beach, FL | 0.4% | 3.7% |
| National | 0.2% | 2.1% |


