
There were an estimated 47% more sellers than buyers in April, down from 48% the month before and a peak of 49% at the end of last year. The gap is shrinking as buyers start to come off of the sidelines amid a stabilizing job market.
For months, the balance of power in the U.S. housing market has been shifting more and more in favor of homebuyers. But now, the negotiating power held by buyers may be past its peak.
There were an estimated 46.5% more home sellers than buyers in the U.S. housing market in April, down from 47.5% the month before and a high of 48.9% in December 2025. It’s still very much a buyer’s market, but it’s no longer a strengthening buyer’s market.
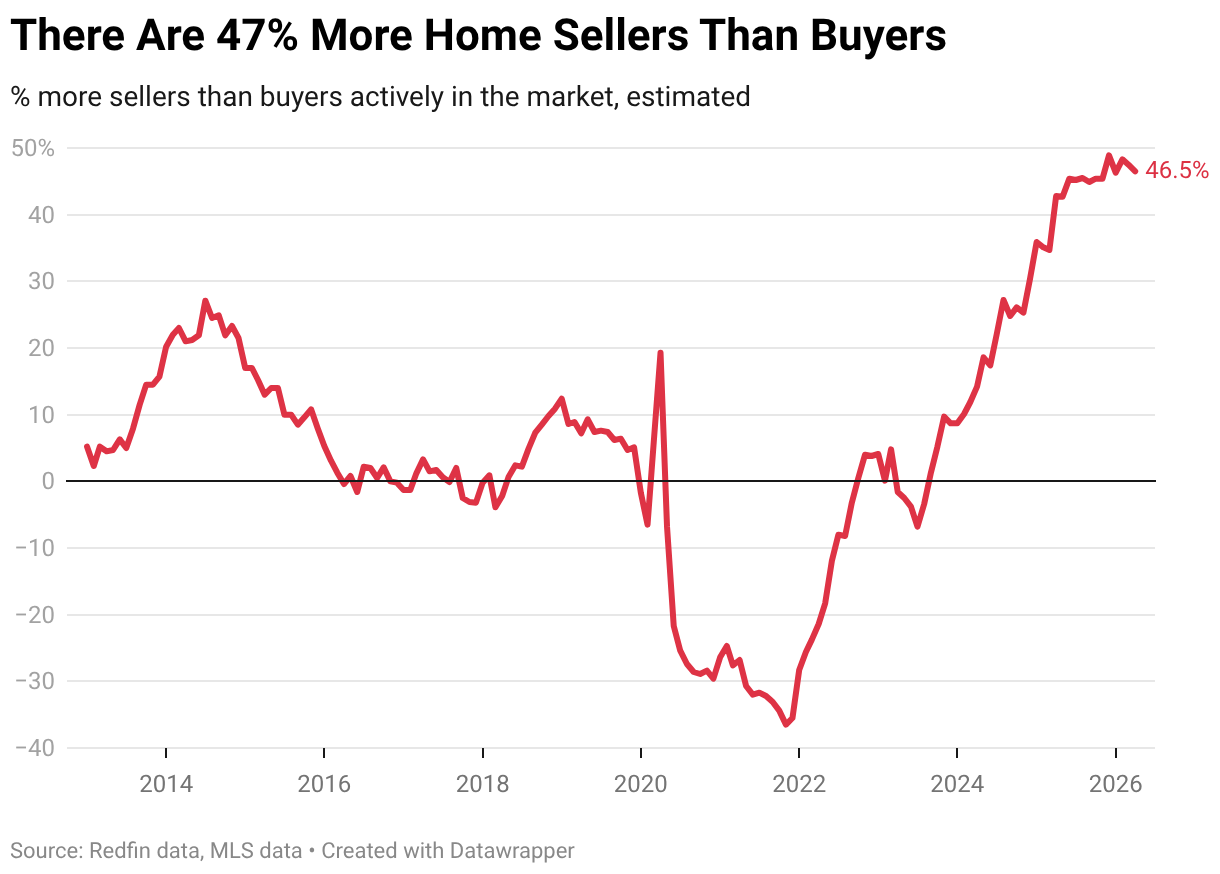
When sellers outnumber buyers, buyers typically hold more negotiating power because they have options. That’s why a market with a lot more sellers than buyers is considered a buyer’s market. We define a market where there are over 10% more sellers than buyers as a buyer’s market and a market where there are over 10% fewer sellers than buyers as a seller’s market. A market where the gap is plus or minus 10% is considered a balanced market.
Of course, it’s only a buyer’s market for those who can afford to buy. High housing costs and economic uncertainty have caused many house hunters to retreat, creating the imbalance of buyers and sellers we see today.
“Homebuyer demand has been dwindling for months, but finally ticked up in April thanks to a strengthening job market and declining recession risk. More house hunters entering the market helped narrow the gap between the number of buyers and sellers,” said Redfin Senior Economist Asad Khan. “If the number of buyers continues to grow, more homeowners may see it as an opportunity to list their homes, helping bring the market out of this deep freeze.”
We estimated the number of buyers using proprietary Redfin data on the typical time from a buyer’s first tour to close of purchase, and MLS data on active listings and pending sales. The estimated number of sellers in the market is simply the number of active listings in the MLS. These estimates are seasonally adjusted and subject to revision.
Please note that April marks the first release under our updated monthly housing data methodology. Previously, national counts such as active listings were based on a sample of representative counties scaled upward to approximate the total size of the U.S. housing market; we have since removed that scaling in favor of direct aggregation across 3,000+ counties. This update results in proportionally lower levels for this report’s national buyer and seller estimates, with no material changes to ratios or trends over time in these estimates. Metro-level estimates are also unchanged. See a more detailed methodology here and view an interactive dashboard here.
Buyers Are Coming Back Faster Than Sellers, Helping to Close the Gap
There were an estimated 1 million homebuyers in the market in April, up 2% from March—the largest increase in 13 months. Meanwhile, there were an estimated 1.5 million sellers in the market, up 1.3% month over month. While that’s the largest increase in a year, it’s still smaller than the increase in buyers, which is why the gap between buyers and sellers is shrinking.
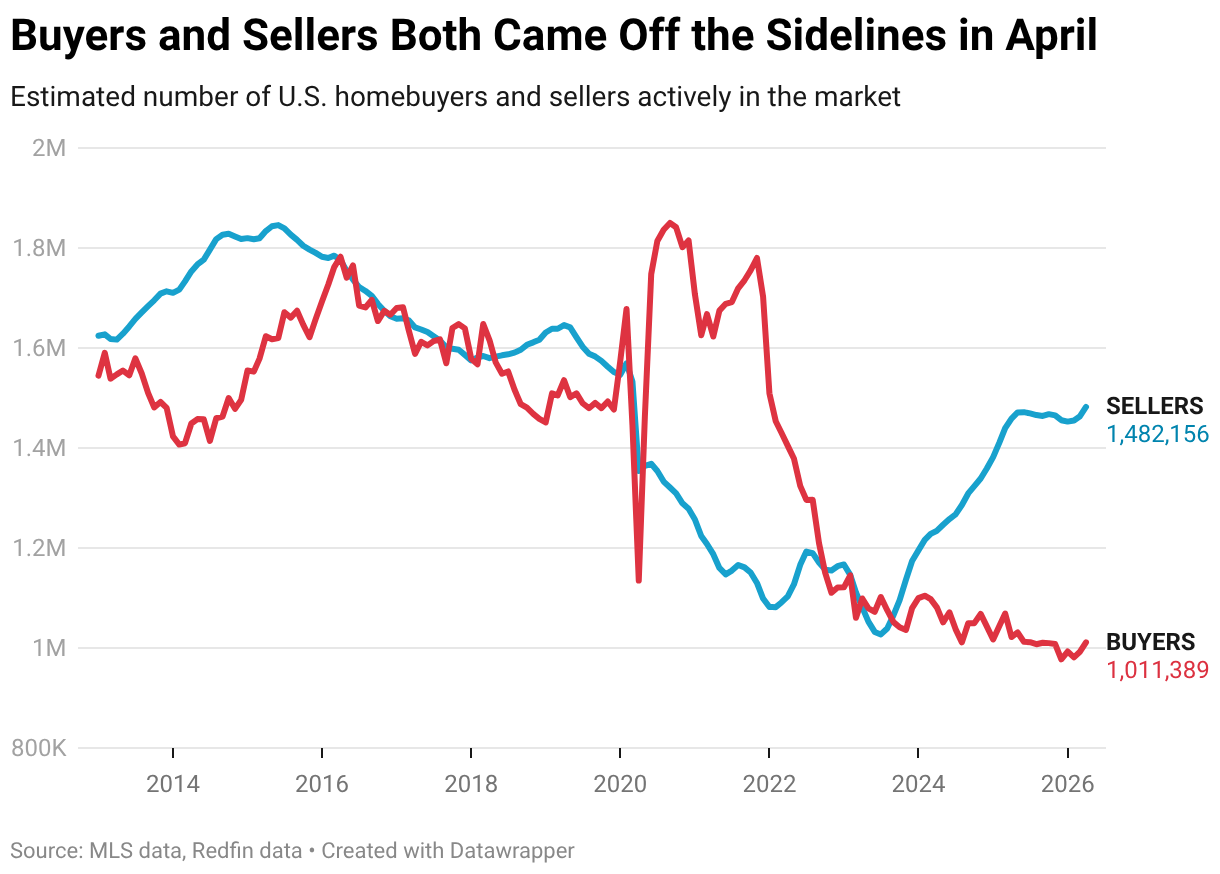
Redfin reported in March that many sellers who delisted their homes last year are now relisting in hopes of taking advantage of an uptick in spring demand, which may be one reason seller activity is ticking up.
Sellers Gained Ground in 19 Buyer’s Markets
The majority of U.S. housing markets—34 of the 49 major U.S. metropolitan areas Redfin analyzed—are still in buyer’s market territory. But many of them are becoming less strong buyer’s markets.
Nineteen buyer’s markets saw the gap between buyers and sellers shrink in April, improving sellers’ negotiating power.
In West Palm Beach, FL, there were 80.2% more sellers than buyers, down 10.2 percentage points from 90.4% in March—the biggest decline among those 19 metros. Next came Tampa, FL (-8.5 ppts), Indianapolis (-7.1 ppts), Anaheim, CA (-5.7 ppts) and Austin, TX (-5 ppts).
Redfin recently reported that West Palm Beach’s luxury housing market, in particular, has been heating up amid an influx of out-of-state buyers.
For this report, Redfin analyzed the 50 most populous metros, and excluded Fort Lauderdale, FL due to insufficient data.
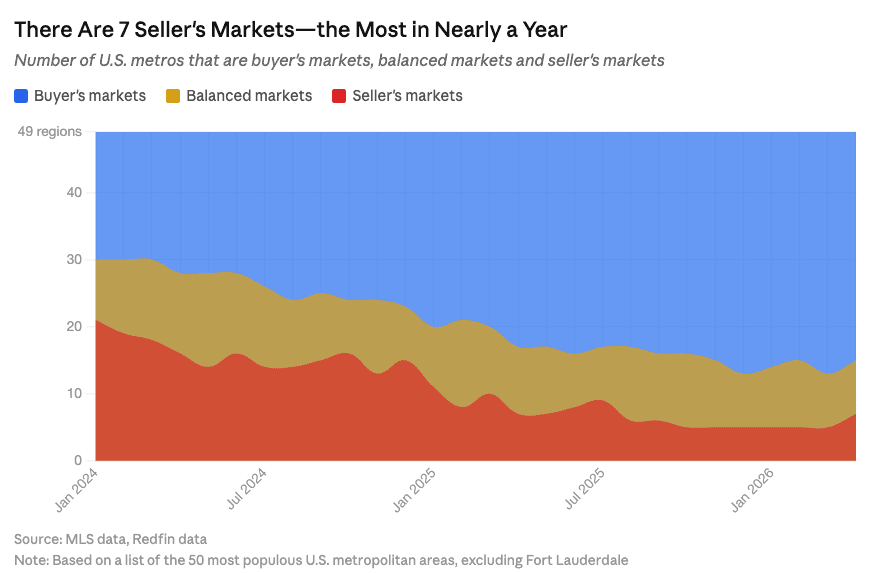
There Are 7 Seller’s Markets—the Most in Nine Months
Seven of the major U.S. metro areas Redfin analyzed were seller’s markets in April, up from five in March and the highest number in nine months.
Nassau County, NY was the strongest seller’s market, with 28.4% fewer sellers than buyers. The other six seller’s markets were Newark, NJ (-25.5%), Montgomery County, PA (-24.7%), New Brunswick, NJ (-16.5%), Providence, RI (-14.3%), San Francisco (-10.9%) and Milwaukee (-10.6%).
On average, home prices rose 3.9% year over year across the seven seller’s markets in April, compared with a 1.2% increase across the 34 buyer’s markets—an indication that seller’s markets offer sellers more leverage.
The Strongest Buyer’s Markets Are in the Sun Belt
The strongest buyer’s market in April was Miami, which had an estimated 137% more sellers than buyers. Next came Nashville (125%), San Antonio (112%), Houston (108%) and Las Vegas (103%).
The Sun Belt skyrocketed in popularity during the pandemic, when scores of homebuyers moved in from more expensive parts of the country. To meet surging demand, homebuilders ramped up activity, which is one reason there are now a lot more homes for sale than people who want to buy them. The buyer pool has also shrunk because soaring housing costs in recent years have priced many people out of the market.
New construction can have a significant influence on whether negotiating power lies with buyers or sellers because it impacts the balance of supply and demand. The South and the West have historically issued the most building permits, while the Northeast and the Midwest have issued the fewest.
Florida and Texas, in particular, build more homes than other states. Florida has also been grappling with intensifying natural disasters, soaring insurance premiums and rising condo HOA fees, which has prompted some homeowners to leave. Miami, specifically, frequently shows up as a buyer’s market because it has a lot of housing supply, which could be in part due to the high number of condos.
Metro-Level Summary: 50* Most Populous Metros (April 2026)
| U.S. metro area | Balance of power | Percent by which sellers outnumber buyers | Buyers | Sellers |
|---|---|---|---|---|
| Anaheim, CA | Buyer's Market | 30.9% | 5,081 | 6,650 |
| Atlanta, GA | Buyer's Market | 69.2% | 22,778 | 38,548 |
| Austin, TX | Buyer's Market | 99.8% | 8,921 | 17,827 |
| Baltimore, MD | Balanced Market | -0.8% | 10,854 | 10,768 |
| Boston, MA | Balanced Market | -3.6% | 12,354 | 11,914 |
| Charlotte, NC | Buyer's Market | 55.0% | 11,660 | 18,069 |
| Chicago, IL | Balanced Market | -4.2% | 28,020 | 26,844 |
| Cincinnati, OH | Buyer's Market | 32.1% | 6,638 | 8,769 |
| Cleveland, OH | Balanced Market | -1.5% | 7,516 | 7,406 |
| Columbus, OH | Buyer's Market | 31.1% | 6,987 | 9,159 |
| Dallas, TX | Buyer's Market | 95.9% | 16,150 | 31,643 |
| Denver, CO | Buyer's Market | 49.5% | 11,053 | 16,528 |
| Detroit, MI | Buyer's Market | 42.6% | 5,228 | 7,453 |
| Fort Worth, TX | Buyer's Market | 64.9% | 7,990 | 13,179 |
| Houston, TX | Buyer's Market | 108.0% | 22,293 | 46,361 |
| Indianapolis, IN | Buyer's Market | 16.7% | 8,576 | 10,010 |
| Jacksonville, FL | Buyer's Market | 69.9% | 7,411 | 12,593 |
| Kansas City, MO | Buyer's Market | 11.0% | 8,058 | 8,944 |
| Las Vegas, NV | Buyer's Market | 103.2% | 7,143 | 14,513 |
| Los Angeles, CA | Buyer's Market | 51.9% | 14,026 | 21,312 |
| Miami, FL | Buyer's Market | 137.3% | 8,192 | 19,440 |
| Milwaukee, WI | Seller's Market | -10.6% | 6,290 | 5,625 |
| Minneapolis, MN | Balanced Market | 9.1% | 13,482 | 14,707 |
| Montgomery County, PA | Seller's Market | -24.7% | 7,353 | 5,541 |
| Nashville, TN | Buyer's Market | 124.8% | 8,061 | 18,117 |
| Nassau County, NY | Seller's Market | -28.4% | 11,188 | 8,013 |
| New Brunswick, NJ | Seller's Market | -16.5% | 11,457 | 9,564 |
| New York, NY | Balanced Market | 1.1% | 29,182 | 29,495 |
| Newark, NJ | Seller's Market | -25.5% | 8,414 | 6,271 |
| Oakland, CA | Buyer's Market | 22.4% | 5,159 | 6,314 |
| Orlando, FL | Buyer's Market | 76.9% | 10,497 | 18,570 |
| Philadelphia, PA | Buyer's Market | 38.2% | 6,151 | 8,500 |
| Phoenix, AZ | Buyer's Market | 87.6% | 17,577 | 32,969 |
| Pittsburgh, PA | Buyer's Market | 65.0% | 6,053 | 9,990 |
| Portland, OR | Buyer's Market | 42.9% | 7,764 | 11,096 |
| Providence, RI | Seller's Market | -14.3% | 5,255 | 4,505 |
| Riverside, CA | Buyer's Market | 62.1% | 10,686 | 17,316 |
| Sacramento, CA | Buyer's Market | 32.7% | 5,832 | 7,742 |
| San Antonio, TX | Buyer's Market | 112.2% | 9,185 | 19,489 |
| San Diego, CA | Buyer's Market | 20.2% | 6,507 | 7,823 |
| San Francisco, CA | Seller's Market | -10.9% | 3,133 | 2,792 |
| San Jose, CA | Buyer's Market | 26.7% | 2,910 | 3,687 |
| Seattle, WA | Buyer's Market | 45.4% | 7,648 | 11,122 |
| St. Louis, MO | Balanced Market | 4.9% | 10,267 | 10,773 |
| Tampa, FL | Buyer's Market | 74.4% | 14,036 | 24,475 |
| Virginia Beach, VA | Balanced Market | 5.7% | 7,298 | 7,717 |
| Warren, MI | Buyer's Market | 20.2% | 7,983 | 9,593 |
| Washington, DC | Buyer's Market | 19.8% | 16,371 | 19,611 |
| West Palm Beach, FL | Buyer's Market | 80.2% | 8,655 | 15,599 |
*Fort Lauderdale, FL has been removed due to insufficient data.


