
High mortgage rates are motivating affluent buyers to avoid loans and pay in cash. FHA loans are also making a comeback as a slowdown in homebuyer competition makes winning a home easier for bidders with lower down payments.
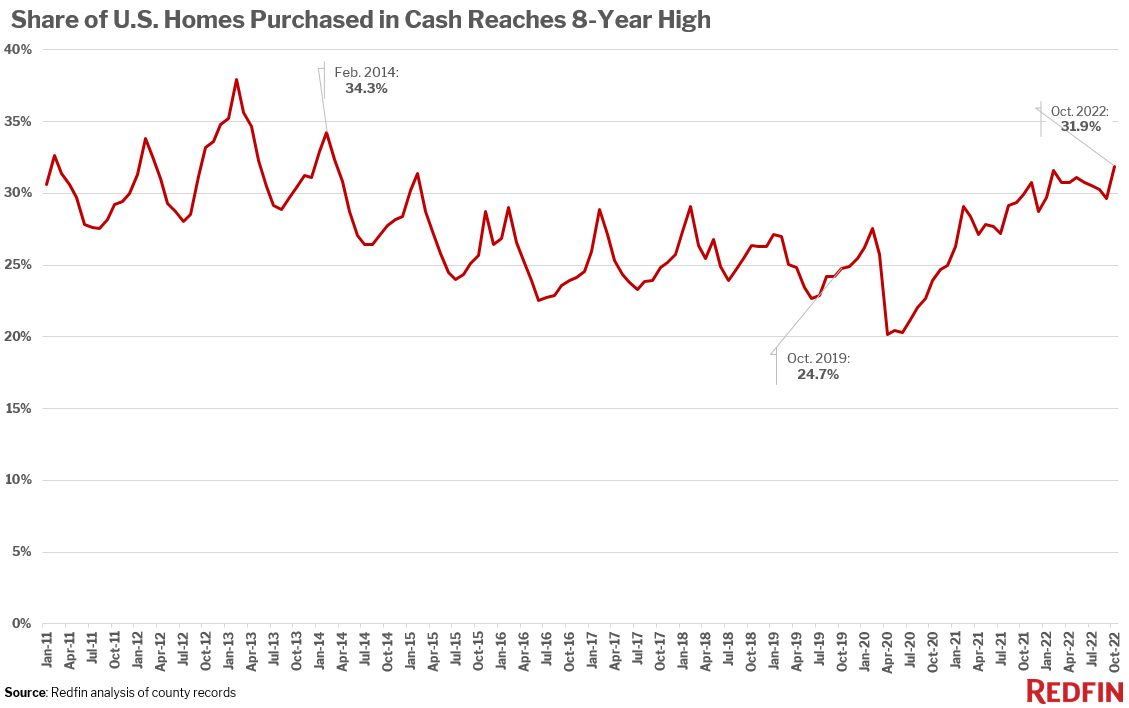
Roughly one-third (31.9%) of U.S. home purchases were paid for with all cash in October, up from 29.9% a year earlier and the highest share since 2014.
The data in this report is from a Redfin analysis of county records across 39 of the most populous U.S. metropolitan areas, going back through 2011. October 2022 is the most recent month for which data is available. An all-cash purchase is one in which there is no mortgage loan information on the deed.
The share of home purchases using all cash shot up in the beginning of 2021 after reaching a record low of 20.1% in April 2020 and has remained elevated. But the factors encouraging buyers to pay in cash are different in the current slow housing market than they were during the pandemic homebuying frenzy.
“Today’s affluent homebuyers are motivated to pay in cash because the surge in mortgage rates makes them want to avoid loans–and the high monthly interest payments that come with them–altogether. Mortgage rates have declined in recent weeks but are still hovering above 6%,” said Redfin Economics Research Lead Chen Zhao. “During the pandemic housing boom, buyers were incentivized to pay in cash because of low rates, which drove up competition and made all-cash offers an effective bargaining chip for those who could afford them.”
All-cash purchases most prevalent in Florida; least prevalent in the Bay Area
All-cash home purchases increased in 29 of the 39 metros in this analysis from October 2021 to October 2022. They increased most in Riverside, CA, where they rose to 38% of all home sales from 19.2%. It’s followed by Cleveland (47%, up from 32%), Cincinnati (43.9%, up from 29.6%), Montgomery County, PA (31.2%, up from 22.7%) and Philadelphia (37.1%, up from 29.4%).
All-cash home purchases were most common in Florida in October. Jacksonville, where roughly half (49.7%) of homes were bought in cash in October, comes first, followed by West Palm Beach (48.6%). Next come a pair of Ohio metros: Cleveland (47%) and Cincinnati (43.9%). They’re followed by Atlanta, at 41.3%.
Florida is home to a lot of affluent buyers with the ability to finance home purchases with all cash. Cleveland and Cincinnati are quite affordable, with median home prices well below the national average, making it more feasible for people to come up with cash.
Expensive West Coast metros dominate the list of places with the lowest share of all cash-purchases. They’re least common in the Bay Area: Just 14.3% of home purchases in San Jose and 16.5% in Oakland were made in cash. Next come Seattle (19%), Los Angeles (19.2%) and Newark, NJ (20%).
With the typical home selling for well over $1 million in San Jose and the high six figures in Oakland, Seattle, Los Angeles and Seattle, it’s challenging to use cash to fund a home purchase. That’s especially true recently, as the cash for home purchases in West Coast cities often comes from tech stocks, which have lost value in 2022.
FHA loans bounce back, hitting highest share in nearly two years
Roughly one in seven (14.6%) mortgaged home sales used an FHA loan, the highest share in nearly two years. That’s up from 13.1% a year earlier and a record low of 10.4% in April.
Overall, conventional loans are the most common type for homebuyers, making up 78.5% of all home sales that used a mortgage in October. That’s down from 80.5% a year earlier but largely in line with where the share has stood since mid-2020.
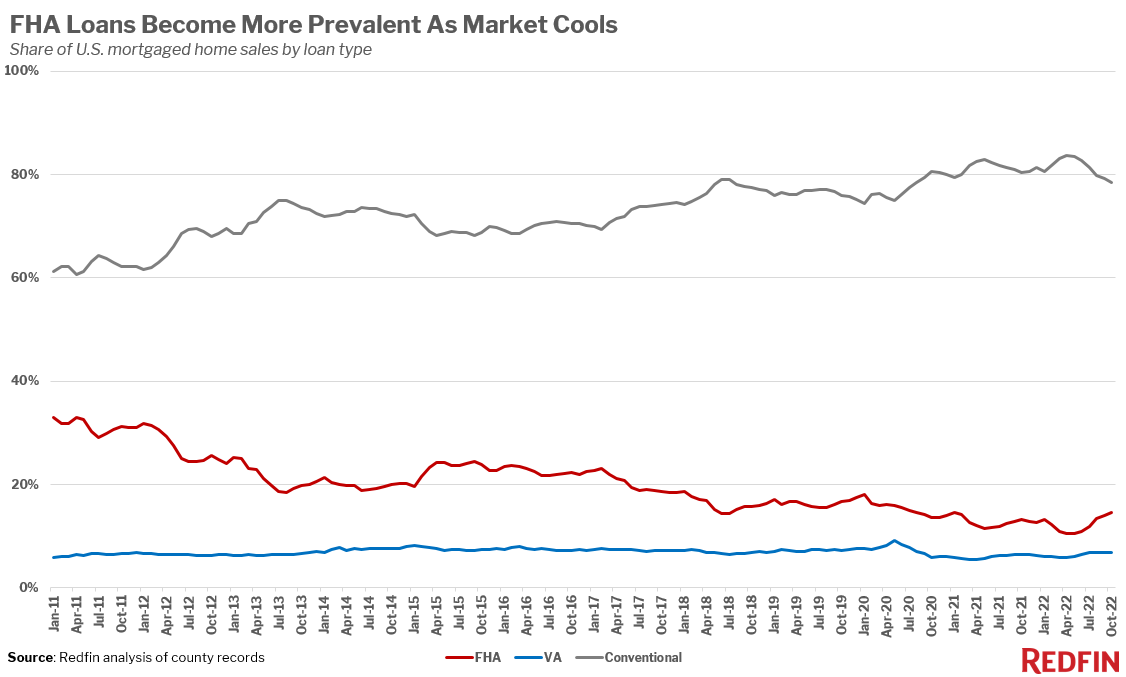
FHA loans, which typically allow for lower down payments, have ticked up in popularity in response to the slowdown in housing-market competition. They were less common at the height of the pandemic buying boom, when sellers were receiving multiple offers and would often choose the one with strongest financing.
“I’m working with several first-time FHA buyers,” said Cleveland Redfin agent Jerry Quade. “They’re back in the market after bowing out for the last two years, hoping to secure a relatively low-priced home with no competing offers and a high likelihood that the seller will accept their loan type.”
Although it’s easier for buyers to use FHA loans as the market cools, affluent all-cash buyers are still in a more financially advantageous situation because they don’t need to take out a loan with 6%-plus mortgage interest rates.
The share of mortgaged sales using VA loans, which also have lower qualification thresholds for borrowers, rose to 6.9% in October, the highest share in over two years. That’s up slightly from 6.4% a year earlier and up from the record low of 5.5% set in mid-2021.
FHA and VA loans are both insured by the U.S. government. FHA loans, meant for low- to moderate-income borrowers and popular with first-time homebuyers, have lower down-payment and credit-score requirements than conventional loans. VA loans are available to veterans, service members and their surviving spouses and require little to no down payment. Conventional loans are not insured by the government.
FHA loans increased most in Riverside, CA, Las Vegas and Phoenix
FHA loan usage increased in 26 of the 39 metros in this analysis from October 2021 to October 2022. They increased most in Riverside, CA, where they rose to 26.4% of all mortgaged home sales from 19% a year earlier. The places with the next-biggest increases are all pandemic boomtowns: Las Vegas (21.4%, up from 15.1%), Phoenix (16.3%, up from 10.1%), Sacramento (16.5%, up from 11.5%) and Nashville (13.6%, up from 9.7%).
FHA loans were most commonly used in Riverside in October, followed by Providence, RI (25.2%). Philadelphia (22.7%), Cleveland (22.2%) and Las Vegas round out the top five.
They’re least common in the Bay Area and other expensive West Coast areas. Less than 1% of mortgaged home sales in San Francisco used an FHA loan in October. Next come San Jose (1.7%), Anaheim, CA (2.9%), Seattle (4.1%) and Oakland (6.2%).
VA loans most common in Virginia Beach and Jacksonville
More than 4 in 10 (41.6%) mortgaged sales in Virginia Beach used a VA loan, by far the biggest share among the metros in this analysis. Next come Jacksonville, FL (17.4%), San Diego (15%), Washington, D.C. (12.8%) and Las Vegas (12.4%). Virginia Beach is home to the largest military presence in the U.S., and the other four metros are all home to major military bases.
| Metro-Level Summary: Home Sales By Loan Type, October 2022*
Share of home sales using all cash Share of mortgaged home sales using each common loan type *Unless otherwise noted |
||||||
| U.S. metro area | Share of home purchases using all cash (Oct. 2022) | Share of home purchases using all cash (Oct. 2021) | Share of mortgaged home sales using FHA loan (Oct. 2022) | Share of mortgaged home sales using FHA loan (Oct. 2021) | Share of mortgaged home sales using VA loan (Oct. 2022) | Share of mortgaged home sales using conventional loan (Oct. 2022) |
| Anaheim, CA | 24.1% | 23.7% | 2.9% | 1.9% | 2.3% | 94.7% |
| Atlanta, GA | 41.3% | 50.7% | 18.1% | 14.6% | 8.3% | 73.6% |
| Charlotte, NC | 37.7% | 43.6% | 12.2% | 10.7% | 6.6% | 81.2% |
| Chicago, IL | 26.4% | 20.8% | 18.2% | 19.3% | 3.3% | 78.6% |
| Cincinnati, OH | 43.9% | 29.6% | 19.2% | 18.8% | 6.4% | 74.3% |
| Cleveland, OH | 47.0% | 32.0% | 22.2% | 25.2% | 4.9% | 72.9% |
| Columbus, OH | 32.1% | 29.5% | 12.3% | 13.9% | 7.0% | 80.6% |
| Denver, CO | 30.4% | 24.4% | 12.6% | 9.0% | 6.5% | 80.9% |
| Detroit, MI | 34.8% | 33.7% | 20.8% | 24.5% | 5.1% | 74.1% |
| Fort Lauderdale, FL | 40.4% | 39.8% | 15.2% | 14.6% | 3.8% | 81.0% |
| Jacksonville, FL | 49.7% | 44.3% | 14.5% | 12.5% | 17.4% | 68.0% |
| Las Vegas, NV | 32.3% | 36.6% | 21.4% | 15.1% | 12.4% | 66.1% |
| Los Angeles, CA | 19.2% | 17.1% | 13.0% | 10.5% | 3.2% | 83.8% |
| Miami, FL | 41.1% | 40.7% | 13.0% | 14.2% | 2.9% | 84.2% |
| Milwaukee, WI | 33.5% | 32.6% | 12.7% | 13.0% | 4.0% | 83.3% |
| Minneapolis, MN | 26.8% | 24.5% | 10.3% | 9.6% | 4.1% | 85.5% |
| Montgomery County, PA | 31.2% | 22.7% | 10.9% | 9.0% | 3.7% | 85.4% |
| Nashville, TN | 35.5% | 36.7% | 13.6% | 9.7% | 5.7% | 80.7% |
| New Brunswick, NJ | 31.9% | 31.6% | 13.3% | 12.7% | 2.5% | 84.2% |
| New York, NY | 31.0% | 25.0% | 12.2% | 11.3% | 1.1% | 86.7% |
| Newark, NJ | 20.0% | 30.1% | 18.0% | 19.4% | 2.7% | 79.3% |
| Oakland, CA | 16.5% | 14.0% | 6.2% | 5.9% | 1.6% | 92.2% |
| Orlando, FL | 38.3% | 39.2% | 15.8% | 13.0% | 6.9% | 77.3% |
| Philadelphia, PA | 37.1% | 29.4% | 22.7% | 19.7% | 3.6% | 73.8% |
| Phoenix, AZ | 29.3% | 37.4% | 16.3% | 10.1% | 9.2% | 74.5% |
| Pittsburgh, PA | 29.3% | 22.6% | 14.7% | 14.8% | 5.2% | 80.1% |
| Portland, OR | 26.5% | 22.2% | 10.2% | 8.4% | 4.3% | 85.5% |
| Providence, RI | 24.8% | 23.1% | 25.2% | 23.7% | 5.9% | 68.9% |
| Riverside, CA | 38.0% | 19.2% | 26.4% | 19.0% | 8.2% | 65.3% |
| Sacramento, CA | 21.1% | 22.7% | 16.5% | 11.5% | 6.0% | 77.5% |
| San Diego, CA | 20.1% | 19.8% | 8.8% | 6.2% | 15.0% | 76.2% |
| San Francisco, CA | 20.4% | 19.2% | 0.8% | 0.1% | 0.2% | 99.1% |
| San Jose, CA | 14.3% | 11.4% | 1.7% | 1.5% | 1.8% | 96.5% |
| Seattle, WA | 19.0% | 16.2% | 4.1% | 4.4% | 3.2% | 92.7% |
| Tampa, FL | 37.1% | 42.9% | 16.6% | 12.9% | 10.8% | 72.6% |
| Virginia Beach, VA | 22.6% | 18.7% | 13.9% | 17.7% | 41.6% | 44.4% |
| Warren, MI | 30.9% | 29.7% | 15.0% | 15.3% | 5.0% | 80.0% |
| Washington, DC | 23.1% | 19.3% | 13.4% | 14.8% | 12.8% | 73.8% |
| West Palm Beach, FL | 48.6% | 51.7% | 12.0% | 13.3% | 4.4% | 83.7% |


