
- Just over 31% of home purchases in December were made in cash, down slightly from the eight-year high hit in November.
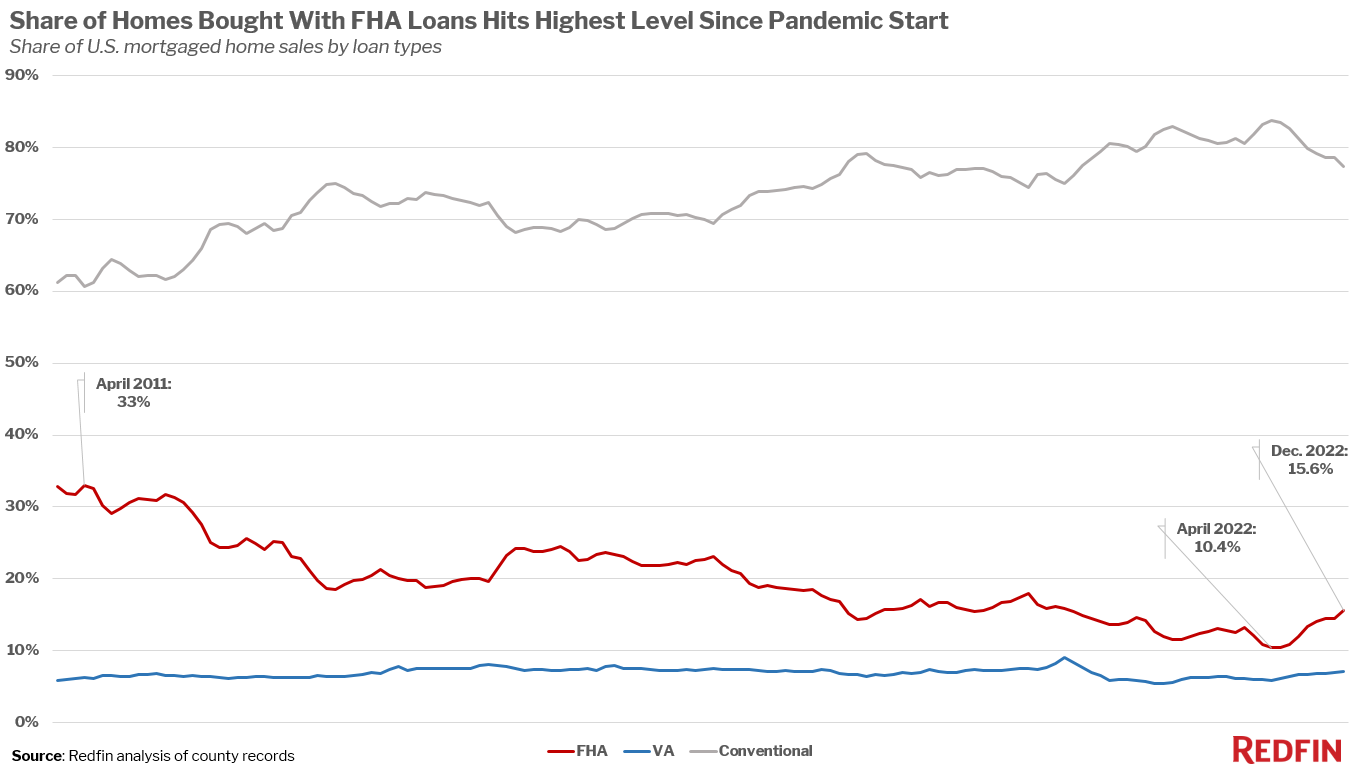
- More than 15% of homebuyers taking out a mortgage used an FHA loan in December, the highest share since May 2020, as buyers gain negotiating power in the cool market.
- Roughly 7% of mortgaged home sales used a VA loan, the highest share since July 2020.
- The prevalence of FHA and VA-backed sales ticked up in 33 of the 40 U.S. metros in this analysis. FHA purchases increased most in Riverside, CA, Phoenix and Las Vegas, while VA purchases increased most in San Diego, Virginia Beach and Jacksonville, FL.
Roughly one-third (31.2%) of U.S. home purchases were paid for with all cash in December. That’s up from 28.8% a year earlier but down from the eight-year high of 31.9% hit in November.
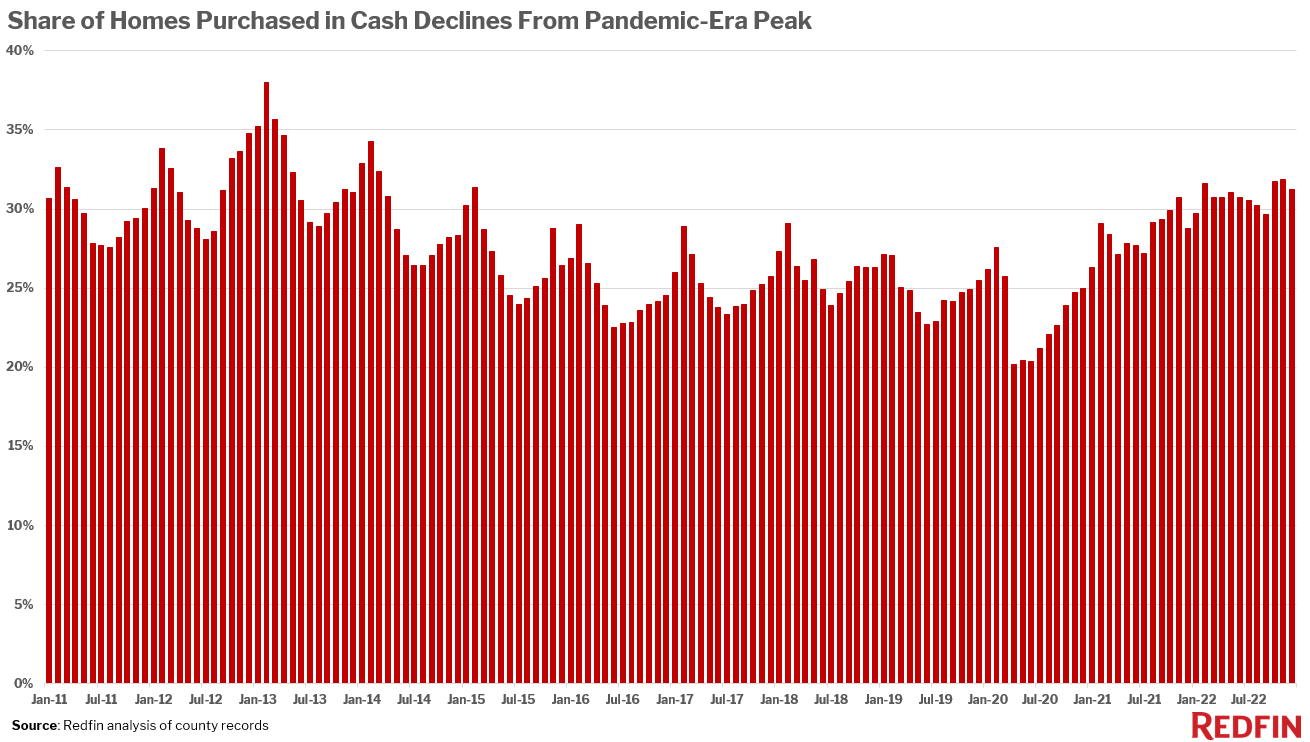
The data in this report is from a Redfin analysis of county records across 40 of the most populous U.S. metropolitan areas, going back through 2011. December 2022 is the most recent month for which data is available. For this report, an all-cash purchase is one in which there is no mortgage loan information on the deed.
The share of homes bought with cash remains elevated above pre-pandemic levels because mortgage rates are high, averaging 6.36% in December. Buyers who can afford to pay cash are motivated to do so because it means they don’t need to pay high interest on a loan. The typical monthly mortgage payment is up about 25% from a year ago, when rates were around 4%.
But rates and monthly mortgage payments have declined from the apex they reached in November, which helps explain why the portion of home purchases made in cash peaked that month, too. All-cash purchases are common in two notable scenarios: When mortgage rates are high and when the housing market is competitive, motivating affluent buyers to pay cash to entice sellers to accept their offer. The latter explains why the prevalence of all-cash purchases shot up in late 2020 and remained elevated throughout 2021.
FHA loans make up 16% of mortgaged home sales, highest portion since pandemic start
Nearly one in six (15.6%) mortgaged home sales nationwide used an FHA loan in December, up from 12.5% a year earlier and the highest share since May 2020.
VA loans have also become more common, with 7.1% of homebuyers who took out a mortgage using one in December. That’s up from 6.2% a year earlier and the highest share since July 2020.
FHA loans–and VA loans, to a smaller extent–became increasingly prevalent in the second half of 2022 as the overall housing market cooled considerably due to rising mortgage rates and buyers gaining more negotiating power. That came after their use plummeted in 2021 amid the ultra-competitive pandemic housing market. The share of mortgaged home sales using an FHA loan fell to a record low of 10.4% in April 2022, while VA loan usage bottomed out in March and April 2021 at 5.5%.
FHA-financed buyers are more likely to get their offers, which tend to include small down payments, accepted in a cool market where there is little to no competition from buyers with higher down payments and perhaps more desirable financing terms. In a hot market, sellers often choose all-cash buyers or those using conventional loans because they believe those deals are more likely to close quickly and efficiently.
“Buyers are successfully using FHA loans more often now because sellers are eager to jump on any offer they get when their home sits on the market and gets just one or two showings a week,” said Redfin Senior Economist Sheharyar Bokhari. “That means buyers with less money in the bank are finally able to win homes. But it’s not all good news for FHA buyers: Their loans are getting accepted because the market is slow, and the market is slow because high rates and prices make it unaffordable for a lot of people.”
Even though it’s now easier for buyers to use FHA loans, all-cash buyers are still in a financially advantageous position. They don’t need to pay the extra money that comes with interest on their mortgage, and they’re better able to take advantage of home prices coming down from their peak.
Conventional loans remain the most common type by far, though other loan types are cutting into their share. Just over three-quarters (77.3%) of December’s mortgaged home sales used a conventional loan, down from 81.2% a year earlier and the lowest level since June 2020.
FHA and VA loans are both insured by the U.S. government. FHA loans, meant for low- to moderate-income borrowers and popular with first-time homebuyers, have lower down-payment and credit-score requirements than conventional loans. VA loans are available to veterans, service members and their surviving spouses and require little to no down payment.
Metro-level highlights: FHA loans picking up fastest in rapidly cooling places
The use of FHA loans increased in 33 of the 40 metros in this analysis. It increased most in Riverside, CA, where 26.3% of mortgaged home sales used an FHA loan in December, up from 16.3% a year earlier. Next come Phoenix (18.2%, up from 9%), and Las Vegas (21.8%), up from 13.6%). FHA loans are bouncing back particularly quickly in pandemic boomtowns Phoenix and Las Vegas mainly because those housing markets have cooled rapidly, with both metros among those with the biggest year-over-year drops in pending home sales.
FHA loans were most common in Riverside, Detroit (25.1%) and Cleveland (21.9%) in December. They’re least common in expensive parts of California. Just 1.1% of mortgaged home sales in San Francisco used an FHA loan, followed by 2.3% in San Jose and 3.6% in Anaheim.
VA loan usage has also increased in 33 of the metros in this analysis, with the biggest upticks in San Diego, Virginia Beach and Jacksonville, FL, all home to major military bases. Those are also the places VA loans are most prevalent (Virginia Beach: 43.1%; Jacksonville: 20.7%; San Diego: 19.5%).
The prevalence of all-cash purchases rose in 30 of the metros in this analysis. The biggest increase was in Riverside, CA, where 35.4% of homes were bought in cash, up from 22.3% a year earlier. Next came Cleveland (43.6%, up from 32%) and Philadelphia (35.9%, up from 26.2%).
Overall, all-cash purchases were most common in Florida. Over half (52%) of West Palm Beach purchases were made in cash, followed by roughly 45% in both Jacksonville and Miami.
| Metro-Level Summary: Home Sales By Loan Type, December 2022 vs. December 2021
Share of mortgaged home sales using each common loan type Share of home sales using all cash |
||||||
| U.S. metro area | Share of home sales using all cash, Dec. 2022 | Share of home sales using all cash, Dec. 2021 | Share of mortgaged home sales using FHA loan, Dec. 2022 | Share of mortgaged home sales using FHA loan, Dec. 2021 | Share of mortgaged home sales using VA loan, Dec. 2022 | Share of mortgaged home sales using VA loan, Dec. 2021 |
| Anaheim, CA | 28.8% | 22.6% | 3.6% | 1.4% | 2.4% | 1.8% |
| Atlanta, GA | 33.2% | 43.7% | 20.9% | 13.9% | 8.2% | 5.8% |
| Baltimore, MD | 30.4% | 23.7% | 19.9% | 20.6% | 8.9% | 9.7% |
| Charlotte, NC | 35.3% | 42.2% | 13.7% | 9.5% | 7.0% | 5.8% |
| Chicago, IL | 25.2% | 20.8% | 18.9% | 19.5% | 3.7% | 3.1% |
| Cincinnati, OH | 36.6% | 27.1% | 18.7% | 17.7% | 6.4% | 6.3% |
| Cleveland, OH | 43.6% | 32.0% | 21.9% | 24.3% | 7.3% | 4.5% |
| Columbus, OH | 28.0% | 30.4% | 14.0% | 13.4% | 6.2% | 5.3% |
| Denver, CO | 28.4% | 22.0% | 13.7% | 9.1% | 7.0% | 6.1% |
| Detroit, MI | 34.3% | 36.5% | 25.1% | 25.8% | 4.4% | 3.9% |
| Fort Lauderdale, FL | 43.5% | 40.4% | 18.2% | 13.9% | 4.4% | 3.2% |
| Jacksonville, FL | 45.3% | 47.8% | 15.3% | 10.5% | 20.7% | 16.3% |
| Las Vegas, NV | 31.2% | 35.7% | 21.8% | 13.6% | 10.8% | 9.0% |
| Los Angeles, CA | 20.2% | 17.6% | 14.1% | 8.3% | 2.4% | 2.0% |
| Miami, FL | 45.0% | 39.7% | 15.0% | 11.7% | 2.5% | 1.9% |
| Milwaukee, WI | 34.1% | 29.0% | 11.9% | 12.0% | 4.6% | 4.3% |
| Minneapolis, MN | 25.7% | 21.2% | 11.1% | 10.8% | 4.8% | 3.8% |
| Montgomery County, PA | 29.0% | 23.5% | 10.1% | 9.0% | 4.2% | 4.2% |
| Nashville, TN | 31.7% | 35.1% | 12.8% | 8.4% | 7.9% | 5.8% |
| New Brunswick, NJ | 34.3% | 27.9% | 12.3% | 12.0% | 2.6% | 2.5% |
| New York, NY | 31.6% | 25.1% | 12.0% | 11.9% | 1.2% | 1.3% |
| Newark, NJ | 25.8% | 20.2% | 16.6% | 19.3% | 2.2% | 2.8% |
| Oakland, CA | 16.6% | 12.2% | 8.1% | 5.8% | 2.3% | 1.9% |
| Orlando, FL | 37.7% | 39.6% | 16.9% | 11.9% | 6.7% | 5.6% |
| Philadelphia, PA | 35.9% | 26.2% | 21.7% | 19.0% | 2.2% | 2.1% |
| Phoenix, AZ | 30.7% | 32.8% | 18.2% | 9.0% | 7.7% | 7.2% |
| Pittsburgh, PA | 32.0% | 24.4% | 19.1% | 13.8% | 6.9% | 4.5% |
| Portland, OR | 24.1% | 18.8% | 11.6% | 8.9% | 6.0% | 5.5% |
| Providence, RI | 29.9% | 21.9% | 21.8% | 20.4% | 5.2% | 4.4% |
| Riverside, CA | 35.4% | 22.3% | 26.3% | 16.3% | 7.4% | 8.0% |
| Sacramento, CA | 20.3% | 18.9% | 14.2% | 11.4% | 5.9% | 5.3% |
| San Diego, CA | 20.0% | 16.1% | 8.0% | 5.3% | 19.5% | 14.1% |
| San Francisco, CA | 19.5% | 18.1% | 1.1% | 0.3% | 0.4% | 0.7% |
| San Jose, CA | 17.2% | 11.7% | 2.3% | 2.0% | 1.4% | 0.6% |
| Seattle, WA | 19.4% | 16.8% | 5.5% | 4.3% | 2.9% | 2.4% |
| Tampa, FL | 39.1% | 41.1% | 18.2% | 11.9% | 9.9% | 9.2% |
| Virginia Beach, VA | 21.6% | 18.2% | 14.4% | 16.2% | 43.1% | 37.8% |
| Warren, MI | 29.8% | 26.7% | 14.3% | 14.0% | 4.3% | 4.0% |
| Washington, DC | 22.7% | 18.6% | 16.1% | 12.9% | 13.7% | 13.3% |
| West Palm Beach, FL | 52.0% | 51.4% | 15.8% | 12.1% | 3.6% | 3.6% |
| National | 31.2% | 28.8% | 15.6% | 12.5% | 7.1% | 6.2% |


