
As a record share of homebuyers move to different parts of the country, prices in popular destinations like Miami and Phoenix have shot up. But buyers can still turn to hotspots like Virginia Beach, San Antonio and Bakersfield to find homes priced below the national median.
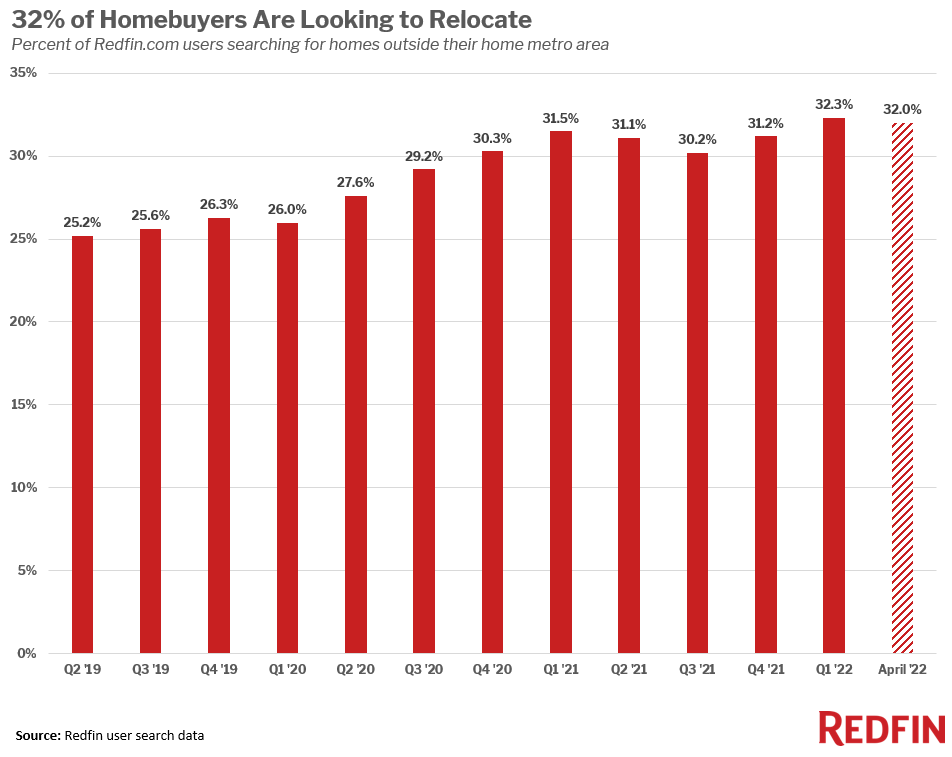
Thirty-two percent of homebuyers nationwide looked to move to a different metro area in April, close to the all-time high of 32.3% set in the first quarter.
As homebuyers relocate at unprecedented levels, home prices in many once-affordable metros have surged and priced out many would-be buyers–a dynamic that’s being exacerbated by rising mortgage rates. But a handful of popular migration destinations, mainly in the South, are still relatively affordable.
The typical home in Virginia Beach, the 15th-most popular destination for buyers moving to a different metro, sold for $315,0000 in April. That’s well below the national median of $424,400 and the lowest median sale price of the top 20 migration destinations in the U.S. Home prices are below the national median in eight of the top 20 destinations, providing options for relocating buyers. Popularity of migration destinations is measured by net inflow, or how many more Redfin.com users looked to move into an area than leave
“In addition to being near a military base, Virginia Beach is attracting remote workers from northern Virginia and Washington, D.C. who want to live at the beach for the same price as a small apartment in the city,” said local Redfin real estate agent John Conard. “For many of them, keeping the same salary while living in a bigger, more affordable home with warmer weather is an easy decision. A lot of people are moving permanently, and some are buying vacation homes.”
Next come a pair of Texas metros that rank 9th and 10th on the list of most popular destinations: San Antonio, where the typical home sells for $330,000, and Houston ($340,000). Jacksonville, FL (13th, $357,000) and Bakersfield, CA (20th most popular destination, $365,000) round out the top five. The others are Tampa, FL (3rd, $370,000), Atlanta (12th, $383,000) and Cape Coral, FL (6th, $419,000).
| Popular migration destinations where home prices are below the national median | |
| Virginia Beach, VA | $315,000 |
| San Antonio, TX | $330,000 |
| Houston, TX | $340,000 |
| Jacksonville, FL | $356,800 |
| Bakersfield, CA | $365,000 |
| Tampa, FL | $370,000 |
| Atlanta, GA | $383,000 |
| Cape Coral, FL | $419,000 |
One reason homes remain relatively affordable in Virginia Beach is that the metro has experienced comparatively slow price growth, with prices rising slower than any of the other top 20 destinations. Virginia Beach had an 11.4% year-over-year increase in April, below the national gain of 15.5%. Sacramento (+14.1%) and Portland, ME (+12.6%) are the only other top-20 destinations with sale-price increases below the national median.
While the destinations above may be affordable for people moving in from expensive areas like New York, San Francisco and Seattle, many locals have been priced out. Homebuyers in Tampa, for example, need to earn 47.8% more than they did a year ago to afford the median-priced home, and buyers in Atlanta need to earn 40.6% more.
“A lot of people are moving to Florida for the price point, beaches and quality of life, especially since the pandemic started,” said Eric Auciello, a Redfin team manager in Tampa. “For a buyer who sold their home in a place like New York for a million dollars, Tampa is affordable. They can get a nice home in a desirable neighborhood for around $550,000. But for locals looking in the $300,000 to $400,000 price point, there’s next to nothing for sale. Locals are turning to condos or moving to more affordable rural areas.”
Surging home prices have made popular destinations like Miami, Phoenix and Sacramento unaffordable for many buyers
Perennially popular migration destinations including Miami, Phoenix, Sacramento and Las Vegas originally attracted homebuyers in part because they were relatively affordable. But remote workers moving in during the pandemic caused home prices to skyrocket, pricing many buyers out.
In four of the top five migration hotspots, home prices are above the national average. In Miami–the number-one migration destination–the typical home sold for $475,000 in April, up from $330,000 in April 2020, at the onset of the pandemic. In number-two ranked Phoenix, the typical home sold for $480,000, up from $305,000 in April 2020. In Sacramento, ranked four, prices went from $430,000 to $605,000, and in number-five ranked Las Vegas, they went from $294,000 to $445,000. Tampa, ranked three, was the only metro in the top five with a median sale price below the national level.
Sun Belt migration hotspots are also home to some of the highest inflation rates in the U.S., meaning costs of other goods and services are also soaring. While they’re still some of the hottest destinations in the country, the flow of buyers into Phoenix and Las Vegas is slower than it was a year ago.
“Places like Phoenix and Sacramento are still relatively affordable compared to San Francisco or Los Angeles–but they’re not nearly as much of a bargain as they were before the pandemic,” said Redfin Deputy Chief Economist Taylor Marr. “Now that homes everywhere have become more expensive, buyers searching for deals should expand their horizons. The good news is that even with surging prices and mortgage rates, there are plenty of relatively affordable options: Buyers from expensive areas looking for more housing options can consider parts of the country that are still relatively affordable, like San Antonio or parts of Florida.”
| Top 20 Metros by Net Inflow of Users and Their Top Origins | |||||||||
| Rank | Metro* | Net Inflow, April 2022† | Net Inflow, April 2021 | Portion of Searches from Users Outside the Metro, April 2022 | Portion of Searches from Users Outside the Metro, April 2021 | Top Origin | Top Out-of-State Origin
|
Median Sale Price – Destination (April 2022) | Median Sale Price, YoY |
| 1 | Miami, FL | 8,929 | 5,224 | 34.6% | 32.2% | New York, NY | New York, NY | $475,000 | 16.4% |
| 2 | Phoenix, AZ | 6,901 | 6,945 | 37.3% | 38.6% | Los Angeles, CA | Los Angeles, CA | $480,000 | 25.4% |
| 3 | Tampa, FL | 6,605 | 4,710 | 50.9% | 60% | Orlando, FL | New York, NY | $370,000 | 27.6% |
| 4 | Sacramento, CA | 6,506 | 5,981 | 43% | 48.4% | San Francisco, CA | Seattle, WA | $604,500 | 14.1% |
| 5 | Las Vegas, NV | 5,821 | 6,389 | 47.5% | 53.6% | Los Angeles, CA | Los Angeles, CA | $445,000 | 29% |
| 6 | Cape Coral, FL | 4,716 | 3,810 | 67.9% | 77.7% | Chicago, IL | Chicago, IL | $419,000 | 38.2% |
| 7 | North Port, FL | 4,518 | 3,094 | 68% | 80% | Chicago, IL | Chicago, IL | $450,000 | 26.8% |
| 8 | Dallas, TX | 3,822 | 5,023 | 25.5% | 32% | Los Angeles, CA | Los Angeles, CA | $447,000 | 24.2% |
| 9 | Houston, TX | 3,634 | 918 | 34.3% | 32.1% | Los Angeles, CA | Los Angeles, CA | $340,000 | 15.7% |
| 10 | San Antonio, TX | 3,509 | 2,267 | 43.3% | 46.9% | Austin, TX | Los Angeles, CA | $330,000 | 20% |
| 11 | San Diego, CA | 3,378 | 2,073 | 31.1% | 29.4% | Los Angeles, CA | Seattle, WA | $865,000 | 20.5% |
| 12 | Atlanta, GA | 2,942 | 5,318 | 20.8% | 26.9% | New York, NY | New York, NY | $382,500 | 22.6% |
| 13 | Jacksonville, FL | 2,600 | 1,823 | 52.8% | 55.4% | Orlando, FL | Washington, DC | $356,800 | 22.7% |
| 14 | Portland, ME | 2,088 | 1,687 | 60.6% | 67.2% | Boston, MA | Boston, MA | $450,000 | 12.6% |
| 15 | Virginia Beach, VA | 1,942 | 1,182 | 39.8% | 36.8% | Washington, DC | Washington, DC | $315,000 | 11.4% |
| 16 | Salisbury, MD | 1,838 | 1,137 | 85.1% | 92.8% | Washington, DC | Washington, DC | n/a* | n/a* |
| 17 | Nashville, TN | 1,723 | 3,211 | 30.3% | 38.9% | Los Angeles, CA | Los Angeles, CA | $454,500 | 26.9% |
| 18 | Spokane, WA | 1,690 | -909 | 58% | 69.7% | Seattle, WA | Los Angeles, CA | $445,000 | 20.3% |
| 19 | Bend, OR | 1,685 | 1,498 | 66.1% | 69.1% | Portland, OR | Seattle, WA | $695,000 | 21.3% |
| 20 | Bakersfield, CA | 1,623 | 1,148 | 55.4% | 68.8% | Los Angeles, CA | Seattle, WA
|
$365,000 | 21.7% |
| *Combined statistical areas with at least 500 users in April 2022
†Negative values indicate a net outflow; among the one million users sampled for this analysis only *Housing market data not available |
|||||||||
Homebuyers are leaving expensive job centers
San Francisco saw more homebuyers looking to leave than any other metro in April. Next come Los Angeles, New York, Washington, D.C. and Seattle. That’s based on net outflow, a measure of how many more Redfin.com users looked to leave an area than move in.
Expensive coastal job centers typically top the list of metros homebuyers are leaving, a trend that has strengthened during the pandemic as remote work has made moving to relatively affordable locations more feasible.
| Top 10 Metros by Net Outflow of Users and Their Top Destinations | |||||||||
| Rank | Metro* | Net Outflow, April 2022† | Net Outflow, April 2021 | Portion of Local Users Searching Elsewhere, April 2022 | Portion of Local Users Searching Elsewhere, April 2021 | Top Destination | Top Out-of-State Destination
|
Median Sale Price – Destination (April 2022) | Median Sale Price, YoY |
| 1 | San Francisco, CA | 31,961 | 23,234 | 23.1% | 22.3% | Sacramento, CA | Seattle, WA | $1,670,000 | 11% |
| 2 | Los Angeles, CA | 23,941 | 18,272 | 19% | 18.8% | San Diego, CA | Las Vegas, NV | $900,000 | 13.2% |
| 3 | New York, NY | 22,472 | 32,335 | 28.1% | 35.4% | Philadelphia, PA | Philadelphia, PA | $680,000 | 5.4% |
| 4 | Washington, DC | 14,989 | 10,925 | 16.7% | 14.7% | Salisbury, MD | Salisbury, MD | $550,000 | 8.9% |
| 5 | Seattle, WA | 14,305 | 4,725 | 18.4% | 15.3% | Phoenix, AZ | Phoenix, AZ | $850,000 | 18.7% |
| 6 | Boston, MA | 8,157 | 2,016 | 17.9% | 14.4% | Portland, ME | Portland, ME | $675,000 | 12.3% |
| 7 | Chicago, IL | 4,992 | 4,806 | 14.2% | 13.2% | Cape Coral, FL | Cape Coral, FL | $329,000 | 5.4% |
| 8 | Detroit, MI | 4,207 | 1,495 | 33.6% | 26.1% | Cleveland, OH | Cleveland, OH | $175,000 | 0% |
| 9 | Denver, CO | 3,398 | 6,076 | 28.9% | 31.7% | Chicago, IL | Chicago, IL | $615,000 | 17.4% |
| 10 | Portland, OR | 1,706 | -680 | 18.1% | 16.9% | Seattle, WA | Seattle, WA
|
$556,000 | 13.5% |
| *Combined statistical areas with at least 500 users in April 2022
†Among the one million users sampled for this analysis only |
|||||||||
Methodology
The latest migration analysis is based on a sample of about two million Redfin.com users who searched for homes across more than 100 metro areas so far in the second quarter, excluding searches unlikely to precede an actual relocation or home purchase. Popularity of migration destinations is measured by net inflow, or how many more Redfin.com users looked to move into an area than leave. The list of places people are leaving is ranked by net outflow, a measure of how many more Redfin.com users looked to leave an area than move in.
To be included in this dataset, a Redfin.com user must have viewed at least 10 homes in a particular metro area, and homes in that area must have made up at least 80% of the user’s searches. Redfin’s migration data goes back to 2017.


