
An influx of people moving into Phoenix, Tampa and Atlanta has led to rapidly rising home prices, one contributor to outsized inflation in those areas. Those Sun Belt metros are still relatively affordable, but scores of new residents and high inflation means the financial benefit of living there is diminishing.
Some of the hottest migration destinations for homebuyers–Phoenix, Tampa and Atlanta–have the highest inflation rates in the U.S.
In Phoenix, prices of goods and services rose 10.9% year over year in the first quarter on average, the highest inflation rate of the metros in this analysis. Phoenix was also the second-most popular destination for homebuyers looking to move from one metro to another in the first quarter, behind only Miami, according to Redfin’s migration data.
Atlanta, the 10th-most popular migration destination, had the second-highest inflation rate (10.6%). And Tampa, with a 9.9% increase in prices, clocks in at number three for both inflation and migration.
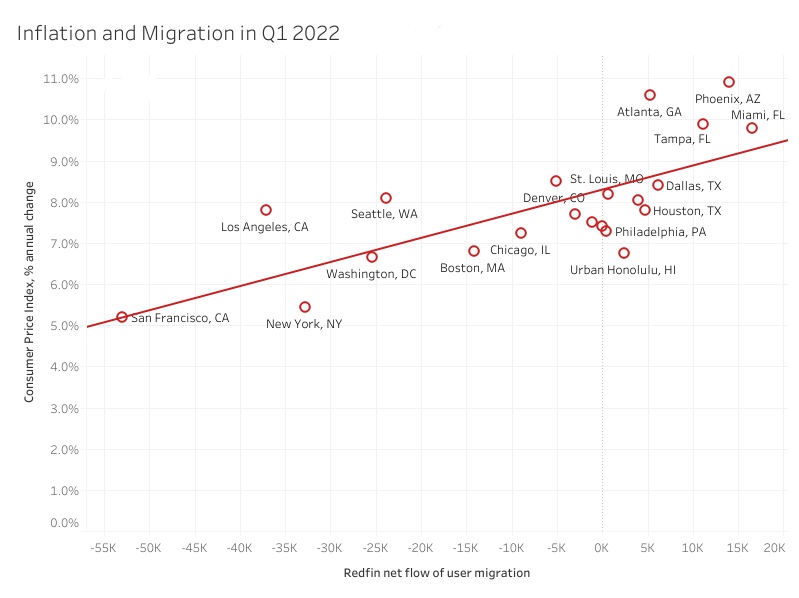
San Francisco, New York and Washington, D.C. follow the opposite trend. San Francisco, which tops the list of metros homebuyers moved away from in the first quarter, has a 5.2% inflation rate, the lowest in the country and roughly half that of Phoenix, Tampa and Atlanta. New York, with the second-lowest inflation rate (5.4%), is the number-three place homebuyers left. Washington, D.C, number four on the list of places people are leaving, has the third-lowest inflation rate (6.7%). Los Angeles, number two for people moving away, has an inflation rate in the middle of the pack (7.8%).
Nationwide, prices were up 8.5% year over year in March, the highest rate in 40 years. Policymakers consider 2% an acceptable level of inflation.
“Not everyone in the country is experiencing inflation the same way,” said Redfin Deputy Chief Economist Taylor Marr. “It’s having an especially big impact in places like Tampa and Phoenix, which are attracting the most new residents and seeing double-digit increases in prices overall and even bigger increases in housing costs. We need to build more new homes in these Sun Belt hot spots to ease some of the competition for local homebuyers. That’s especially important as everyday costs like paying rent and buying food become more burdensome. In Atlanta, for instance, wages are up about 7% from a year ago but inflation is up 10% and asking rents are up 22%. That means it’s becoming more difficult to save for a down payment and break into homeownership even before you factor in sky-high home prices and rising mortgage rates.”
“The good news is that because most families own their home, they’re building wealth from rising home values, even if they are paying more for everything else,” Marr continued. “There’s also a bright spot for prospective buyers: I expect competition to slow down in the coming months as mortgage rates rise and some buyers back out of the market, and wage gains are likely to continue increasing.”
Home prices are skyrocketing in America’s most popular destinations, partly because so many people are moving in–a record share of homebuyers relocated in the first quarter. Rapidly rising home prices are one contributor to inflation.
Phoenix home prices increased 27% year over year to $470,000 in March, and they were up 29% to $364,000 in Tampa and 22% to $368,000 in Atlanta–that’s compared with a 17% nationwide increase. Home-price increases were comparatively small in the places people are leaving, up 11% year over year to $1,580,000 in San Francisco, 8% to $678,000 in New York and 9% to $525,000 in Washington, D.C.
The financial benefit of moving to relatively affordable areas will eventually diminish
Although the national housing market is showing signs of a cooldown, Sun Belt metros like Phoenix, Tampa and Atlanta will remain attractive to out-of-town homebuyers. Pandemic-fueled remote work is here to stay, and people will continue to sell homes in pricey coastal job centers like San Francisco and Seattle in favor of comparatively affordable, warmer metros.
But the trend may slow in the future as the financial benefit of living in a place like Phoenix diminishes. Homes are becoming less affordable more quickly in Sun Belt metros than in coastal areas. Homebuyers in Phoenix, for instance, need to earn 46% more than they did a year ago to afford the area’s typical monthly mortgage payment, compared with 26% more in San Francisco.
“A homebuyer would still save a lot of money by moving from San Francisco to Phoenix if they kept the same job and the same salary–but the discount is less than it was two years ago,” Marr said. “Because so many other people are using the same strategy, prices of homes and other goods and services in popular destinations are going way up and inflation is more tame in the places people are leaving. There may come a point where it won’t make financial sense to move from coastal California to Phoenix or Atlanta. That point is likely still many years in the future, as popular migration destinations are building more new homes than other places in the country.”
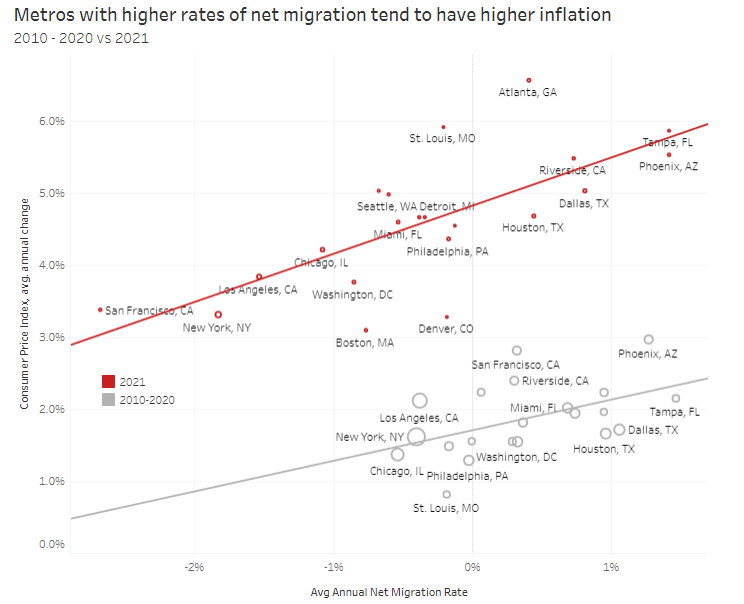
The relationship between migration and inflation increased in 2021
The relationship between migration and inflation has strengthened significantly as more people relocate from expensive coastal cities to more affordable metro areas.
More than half of the variation in inflation rates between metro areas in 2021 can be explained by domestic migration. But in the preceding decade, from 2010 to 2020, a much smaller share–around 24%–of the variation could be explained by migration.
Methodology
This report is based on a Redfin analysis of the correlation between inflation (the rising prices of goods and services) and migration in metro areas where inflation data is available. Redfin migration data is aggregated to the combined statistical area (CSA). The majority of this analysis measures the popularity of migration destinations by net inflow, or how many more Redfin.com users are looking to move into a metro area than move out of it. The final section, comparing 2010-2020 to 2021, measures migration using data from the U.S. Census. Inflation rates are measured by the Bureau of Labor Statistics at the core-based statistical area (CBSA) by the Consumer Price Index, the average change over time in prices for goods and services such as fuel, energy and food.


