

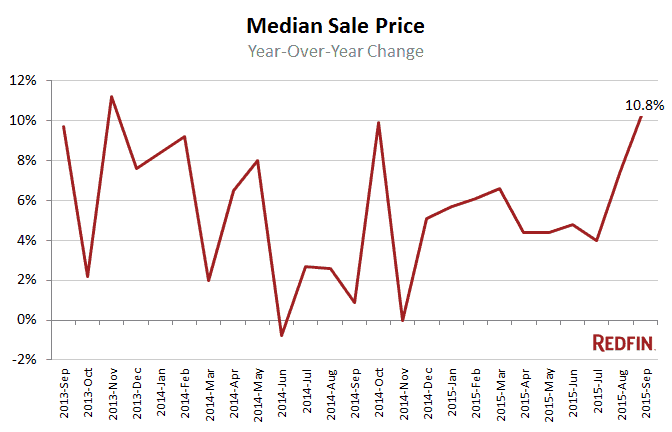
Washington, D.C., home prices rose 10.8 percent in September from a year earlier, to a median sale price of $515,000. While the city has seen year-over-year price increases every month since November, the picture is different across the broader DC-MD-VA metro region, where the median sale price was $356,000, up a slight 0.3 percent.
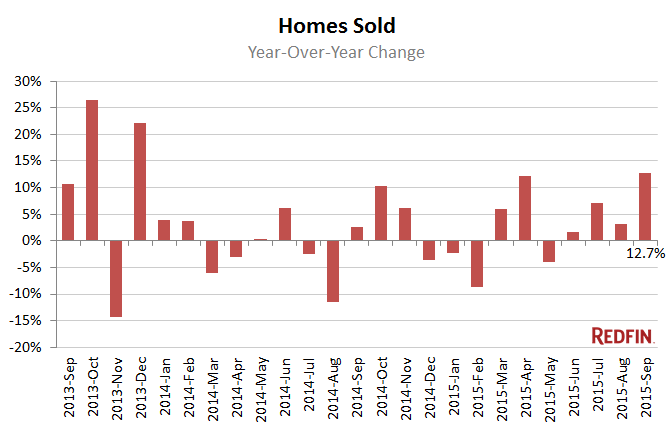
After a late-summer slowdown, buyers jumped back into the market last month. Home sales rose 12.7 percent in the city from a year earlier and 11.7 percent across the broader region.
Surge of New Listings Hits D.C.
New listings jumped in September, as homeowners returned from vacations and the market started bustling again. Still, the proliferation of for-sale signs wasn’t enough to make up for months of low inventory. Compared to last year, the number of homes for sale in the city fell 5.9 percent. There was a 2.3-month supply, an improvement from the 1.9-month supply in August, but still well below the 6 months that signal a balanced market.
Across the broader region, new listings were up 3.3 percent from last year. Overall inventory was flat and there was 3.6 months of supply.
Bidding Wars, Escalations and Competing with Cash
While the market has cooled considerably in the city, sellers continue to have the upper hand. More than a third of homes sold for more than asking price, and the typical property was under contract in 12 days. Multiple offers and price escalations are still common.
Redfin agent Dan Galloway recently listed a home in Mount Pleasant that received five bids, including a cash offer well above the asking price.
“While it wasn’t the highest offer, the sellers ended up choosing the cash buyers, who put down a $300,000 deposit with no contingencies to show how serious they were,” Galloway said. “While it can be disheartening to compete with someone with a wad of cash, buyers who need financing can compete on price and by waiving contingencies.”
Hot Neighborhoods
Early this year, Redfin predicted Woodridge would be a hot neighborhood. A 41 percent, year-over-year price increase seems to prove the forecast right. The only neighborhoods with steeper price gains were Congress Heights, Deanwood and Cleveland Park, with eye-popping, year-over-year price increases of 69 percent, 51 percent and 48 percent respectively.
The fastest-moving neighborhoods were Anacostia and Petworth, with the typical home going under contract in just six days.
See our city page for the most up-to-date data on Washington-area home prices.
Here’s what’s happening in your neighborhood:
| Neighborhood | Median Sale Price | Year-Over-Year | Homes sold | Year-Over-Year | Inventory | Year-Over-Year |
|---|---|---|---|---|---|---|
| 16th Street Heights | $668,900 | 4.6% | 46 | 27.8% | 27 | -12.9% |
| Adams Morgan / Kalorama Heights / Lanier Heights | $501,800 | 2.4% | 123 | 39.8% | 73 | -13.1% |
| American University Park / Friendship Heights / Tenleytown | $1,004,000 | 12.4% | 47 | -6.0% | 18 | -30.8% |
| Anacostia | $267,300 | 4.0% | 13 | 30.0% | 18 | 12.5% |
| Atlas District | $600,600 | -8.5% | 54 | 22.7% | 37 | -2.6% |
| Bellevue / Congress Heights / Washington Highlands | $195,700 | 3.9% | 38 | 72.7% | 40 | -27.3% |
| Benning Heights / Capitol View / Marshall Heights | $208,600 | 0.5% | 27 | 8.0% | 36 | -37.9% |
| Bloomingdale | $666,400 | 11.9% | 30 | 15.4% | 12 | -55.6% |
| Capitol Hill | $807,300 | 2.4% | 111 | 0.0% | 59 | 22.9% |
| Chevy Chase | $884,800 | 4.5% | 72 | 20.0% | 47 | 14.6% |
| Chinatown / Mount Vernon Square / Penn Quarters | $496,900 | 4.9% | 100 | 9.9% | 65 | 6.6% |
| Cleveland Park | $709,400 | 47.9% | 39 | 21.9% | 18 | -28.0% |
| Columbia Heights | $581,800 | 10.8% | 104 | 9.5% | 64 | 16.4% |
| Congress Heights | $227,800 | 69.0% | 17 | 88.9% | 24 | -7.7% |
| Deanwood | $250,700 | 50.6% | 16 | 23.1% | 16 | -48.4% |
| Dupont Circle | $445,500 | 1.0% | 121 | -2.4% | 64 | -15.8% |
| Eckington | $657,700 | 21.8% | 21 | 0.0% | 20 | 5.3% |
| Edgewood | $406,600 | -3.8% | 22 | -21.4% | 7 | -36.4% |
| Fairlawn / Twining / Randle Highlands / Penn Branch | $302,300 | 1.6% | 33 | 3.1% | 28 | -24.3% |
| Foggy Bottom / George Washington University / West End | $472,700 | 14.2% | 66 | 3.1% | 62 | 14.8% |
| Fort Totten / Lamont Riggs / Pleasant Hill / Queens Chapel | $387,400 | 11.2% | 29 | -9.4% | 25 | 25.0% |
| Foxhall / Palisades / Spring Valley / Wesley Heights | $1,271,600 | -1.1% | 44 | -21.4% | 67 | 26.4% |
| Georgetown | $1,397,400 | 27.8% | 83 | 40.7% | 63 | -6.0% |
| Glover Park / Cathedral Heights / McLean Gardens | $426,600 | 11.1% | 128 | 29.3% | 85 | 0.0% |
| Greenway / Benning / Dupont Park / River Terrace | $258,900 | 31.1% | 24 | 140.0% | 13 | -27.8% |
| Hill East | $678,000 | 9.0% | 68 | 11.5% | 28 | 0.0% |
| Howard University / Le Droit Park | $654,200 | 10.7% | 64 | 23.1% | 40 | 33.3% |
| Kingman Park | $472,000 | 18.6% | 39 | 56.0% | 37 | 19.4% |
| Logan Circle | $583,500 | 6.9% | 183 | -5.7% | 116 | -2.5% |
| Massachusetts Avenue Heights | $462,200 | -1.9% | 41 | 20.6% | 24 | -25.0% |
| Mount Pleasant | $671,600 | -2.3% | 25 | -45.7% | 11 | 57.1% |
| Navy Yard | $518,500 | 2.0% | 14 | -22.2% | 4 | 0.0% |
| NoMa | $629,700 | -1.2% | 20 | -23.1% | 24 | 71.4% |
| Petworth | $634,200 | 1.2% | 69 | 30.2% | 33 | -25.0% |
| Pleasant Plains | $491,900 | 14.5% | 31 | 40.9% | 21 | 31.3% |
| Shaw | $676,600 | 0.2% | 30 | -25.0% | 24 | 26.3% |
| Southwest / Waterfront | $297,900 | -1.4% | 65 | 8.3% | 23 | 9.5% |
| Stanton Park | $679,100 | 0.9% | 107 | 16.3% | 48 | -15.8% |
| Takoma Park | $734,100 | 2.0% | 14 | -26.3% | 10 | -9.1% |
| Trinidad / Arboretum / Ivy City | $393,500 | 3.5% | 50 | 19.0% | 34 | 9.7% |
| Truxton Circle | $699,200 | 29.1% | 16 | -27.3% | 12 | -50.0% |
| U Street Corridor | $586,400 | -2.0% | 76 | 15.2% | 30 | -14.3% |
| Union Station / Kingman Park / Stanton Park | $584,700 | -7.2% | 142 | 21.4% | 92 | 2.2% |
| Van Ness / Forest Hills / Wakefield | $506,600 | 14.8% | 41 | 0.0% | 24 | -4.0% |
| Woodley Park | $765,400 | 15.3% | 16 | -11.1% | 13 | -18.8% |
| Woodridge | $552,300 | 41.4% | 12 | -45.5% | 9 | -50.0% |
| Washington, DC | $515,000 | 10.8% | 664 | 12.7% | 1,520 | -5.9% |
NOTE: Not all neighborhoods are listed, but totals for Washington, D.C., encompass entire city. Data is based on listing information and might not reflect all real estate activity in the market. Neighborhood-specific data is measured over the three months ended Sept. 31. Inventory measures listings active as of Sept. 31.
For more information, contact Redfin journalist services:
Phone: 206-588-6863
Email: press@redfin.com


