
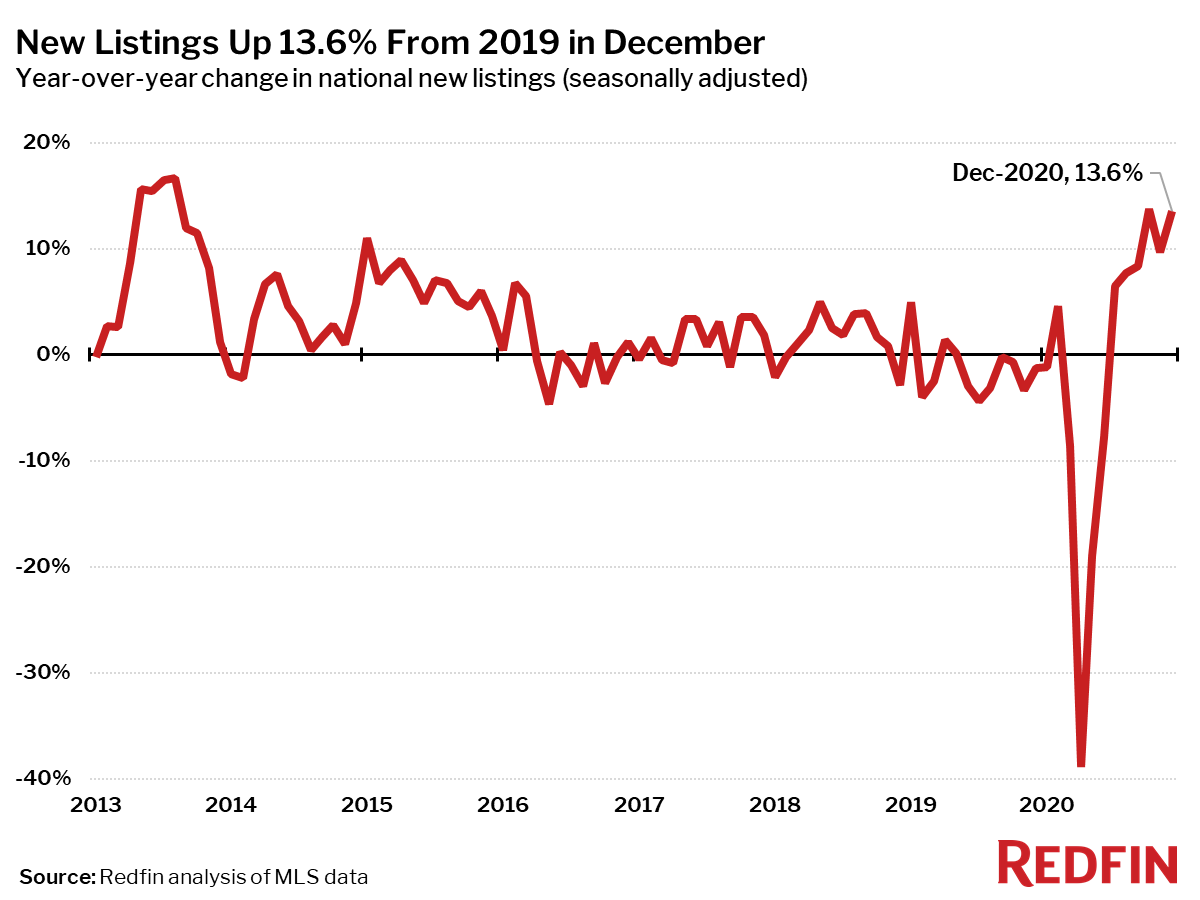
Pending-sales growth of 35% far outpaced that of new listings, up 14%.
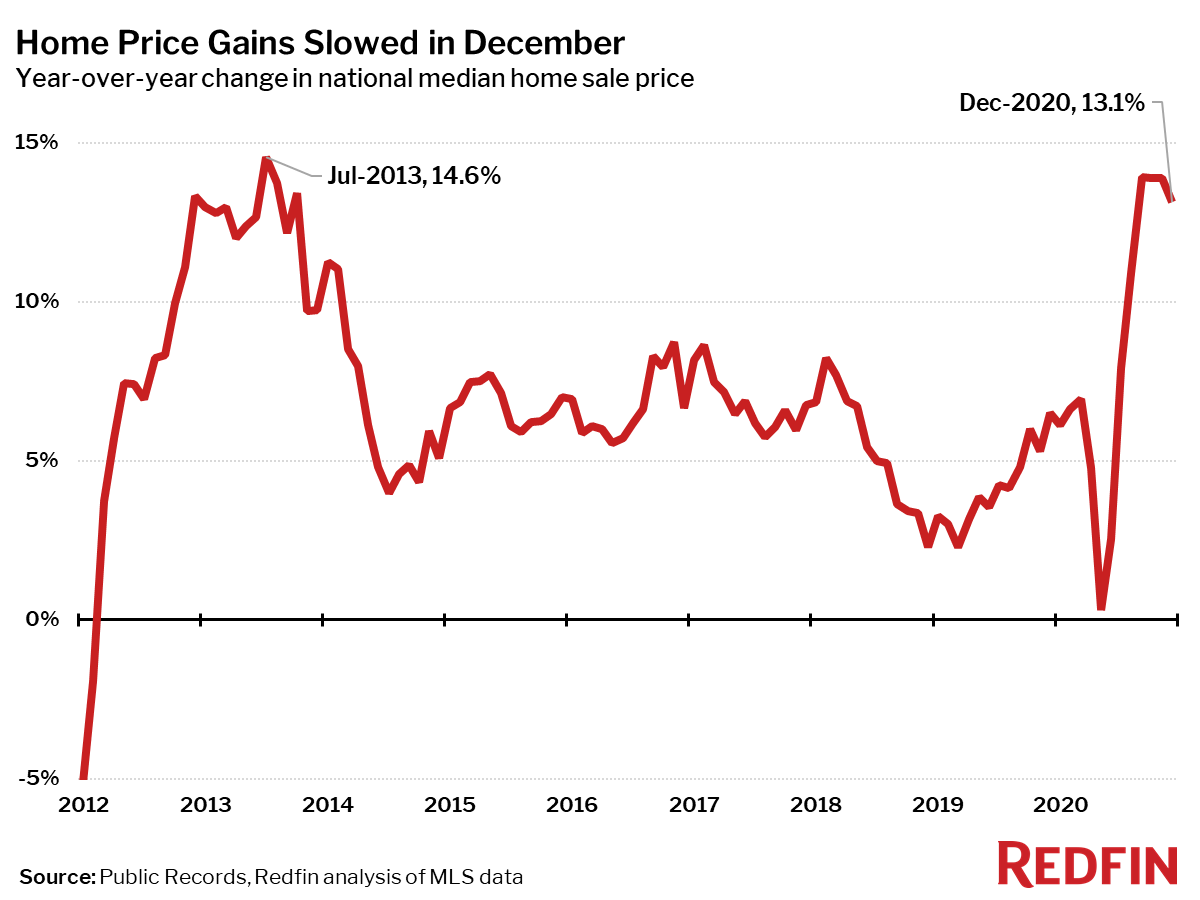
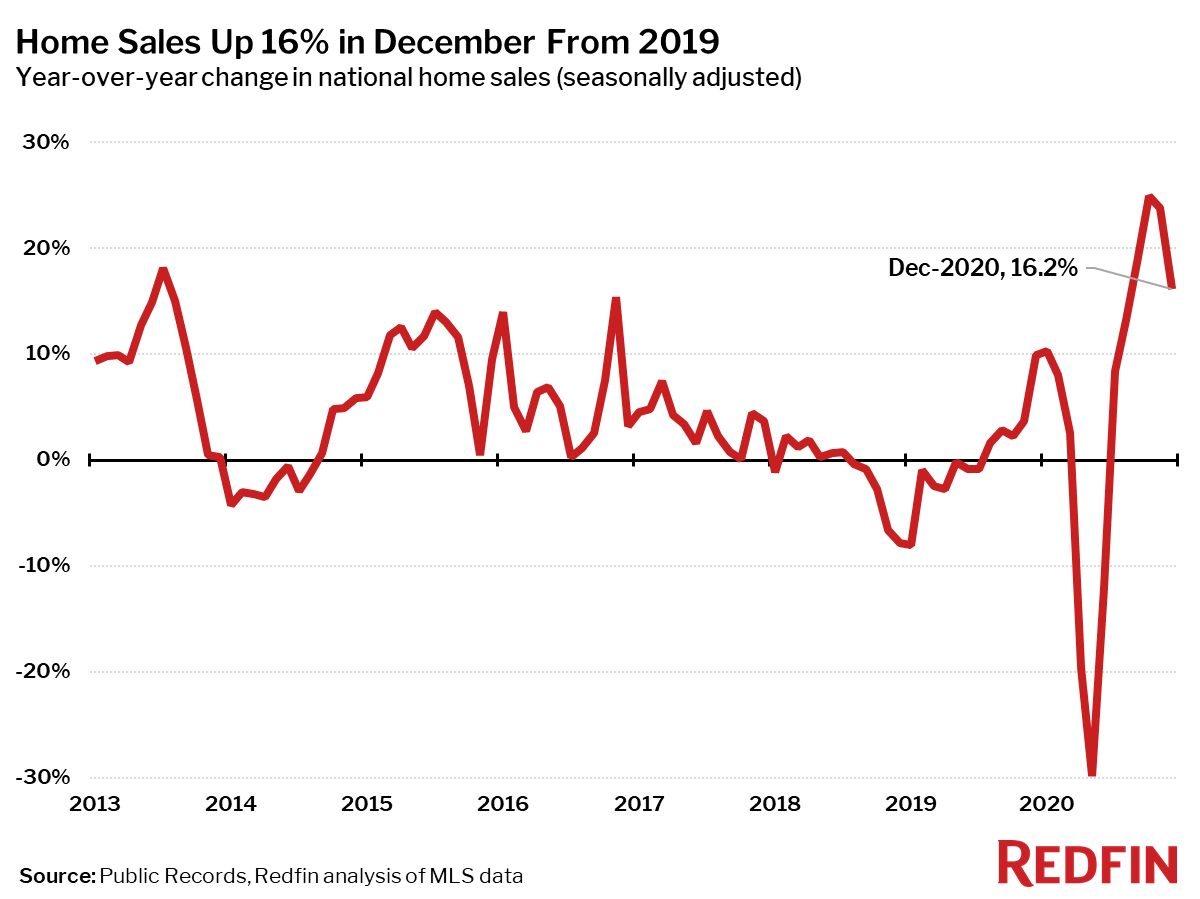
The national median home-sale price rose 13% year over year to $334,300 in December. Homebuying demand barely slowed during what is typically one of the slowest months of the year. Closed home sales were up 16% from a year earlier and pending sales were up 35%, while new listings were up just 14%. The housing market’s continued intensity is due in large part to the continued decline in home mortgage interest rates.
“The December housing market felt more like spring than winter,” said Redfin chief economist Daryl Fairweather. “Right now homebuying demand is seemingly endless, and although new listings are up from a year ago, it’s not nearly enough to keep up with demand. This inventory shortage is especially dire in places that have become hot migration destinations during the pandemic, like Salt Lake City.”
Median prices increased in each of the 85 largest metro areas Redfin tracks. The smallest price gains compared to a year earlier were in San Francisco (+3%). The largest price increases were in Bridgeport, CT (+28%), Camden, NJ (+24%) and New Brunswick, NJ (+21%).
“It seems no matter how high we price some homes, buyers are willing to pay more,” said Grand Rapids, MI Redfin real estate agent Shellie Silva. Buyers—especially out of-towners—are offering up to $30,000 in cash to cover any appraisal gap in addition to waiving inspection contingencies. A lot of the demand is coming from people moving here from the Chicago area, drawn by low property taxes and relatively affordable housing.”
| Market Summary | December 2020 | Month-Over-Month | Year-Over-Year |
|---|---|---|---|
| Median sale price | $334,300 | -0.2% | 13.1% |
| Homes sold, seasonally-adjusted | 637,600 | -3.8% | 16.2% |
| Pending sales, seasonally-adjusted | 629,700 | 1.4% | 35.4% |
| New listings, seasonally-adjusted | 680,900 | 1.3% | 13.6% |
| All Homes for sale, seasonally-adjusted | 1,642,800 | -1.1% | -22.3% |
| Median days on market | 30 | 3 | -20 |
| Months of supply | 1.2 | -0.4 | -1.3 |
| Sold above list | 33.4% | -1.6 pts† | 13.4 pts† |
| Median Off-Market Redfin Estimate | $318,100 | -0.2% | 14.5% |
| Average Sale-to-list | 99.4% | -0.1 pts† | 1.4 pts† |
| Average 30-year fixed mortgage rate | 2.68% | -0.09 pts† | -1.04 pts† |
Home sales were up 16% in December from a year earlier on a seasonally-adjusted basis, down from the record high of 25% set in October, but still the fourth-highest level on record.
The number of homes sold in December was up from a year earlier in the 85 largest metro areas Redfin tracks. The largest gains in sales were in Bridgeport, CT (+52%), New Brunswick, NJ (+47%) and Oxnard, CA (+41%). The metro areas with the smallest increase in the number of homes sold were Fresno, CA and Miami, both of which had gains of just 3%.
Active listings—the count of all homes that were for sale at any time during the month—fell 22% year over year to their lowest level on record in December, the 17th-straight month of declines.
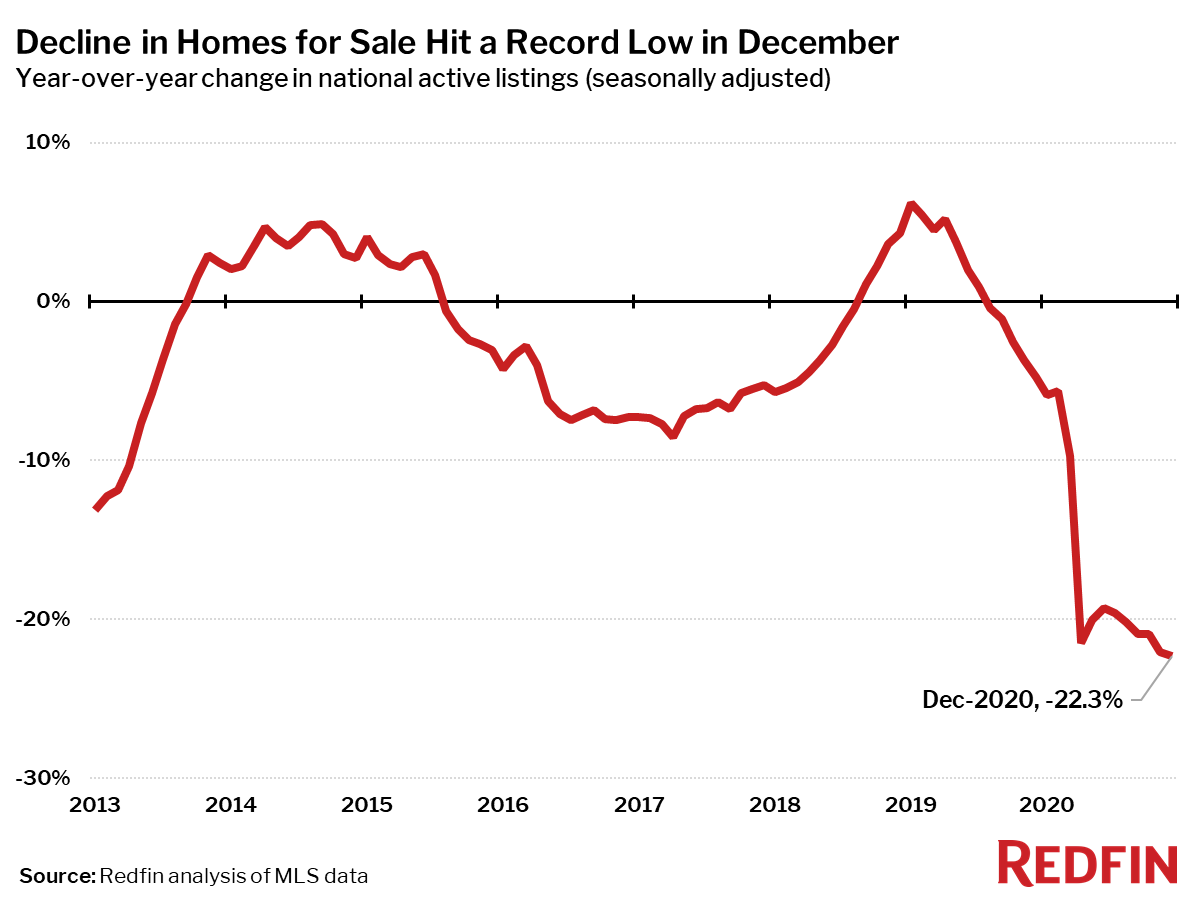
Only five of the 85 largest metros tracked by Redfin posted a year-over-year increase in the count of seasonally-adjusted active listings of homes for sale. The largest gains were in San Francisco (+78%), New York City (+28%) and San Jose, CA (+25%).
Compared to a year ago, the biggest declines in active housing supply in December were in Salt Lake City (-57%), Kansas City, MO (-51%) and Allentown, PA (-49%).
The number of new listings of homes for sale increased 14% in December from a year earlier, a solid gain, but still dwarfed by the gain over the same period in pending sales, which were up 35%.
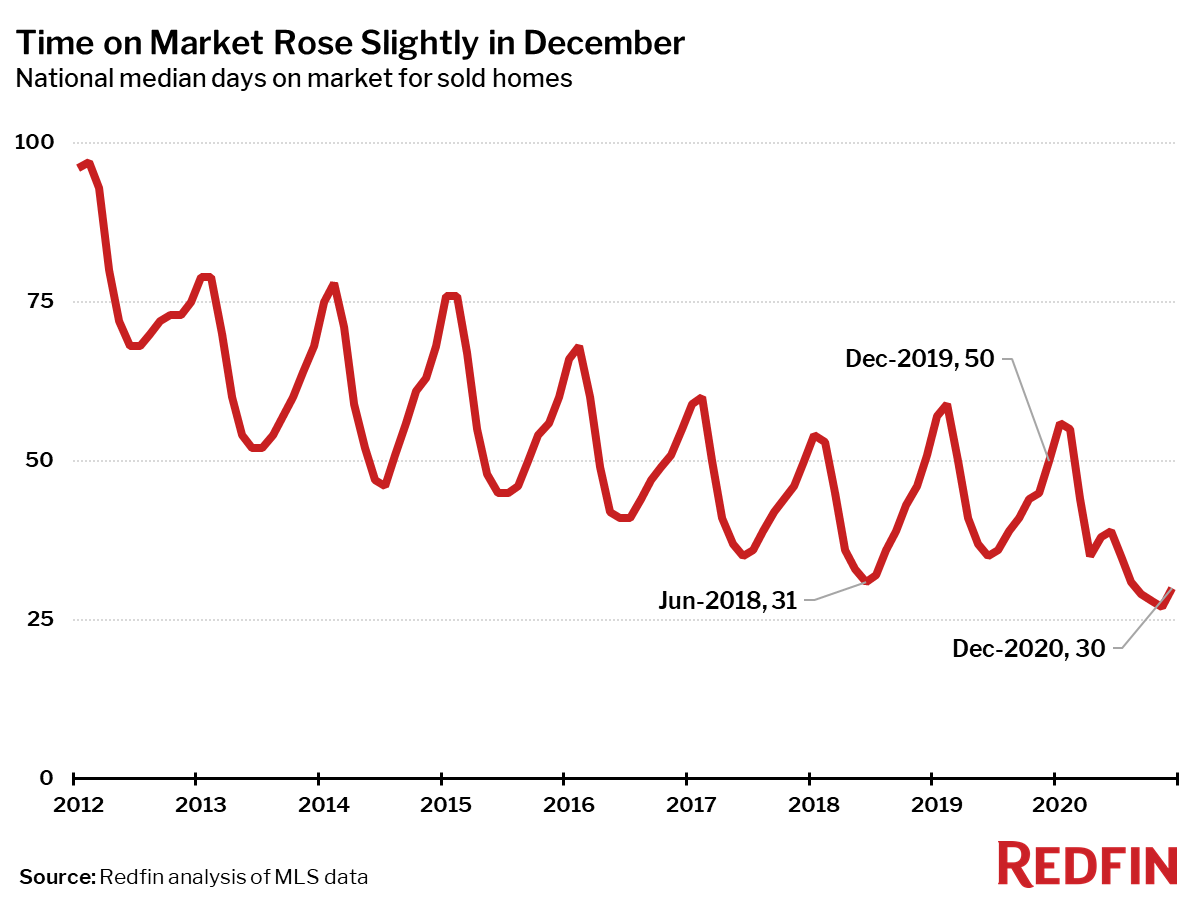
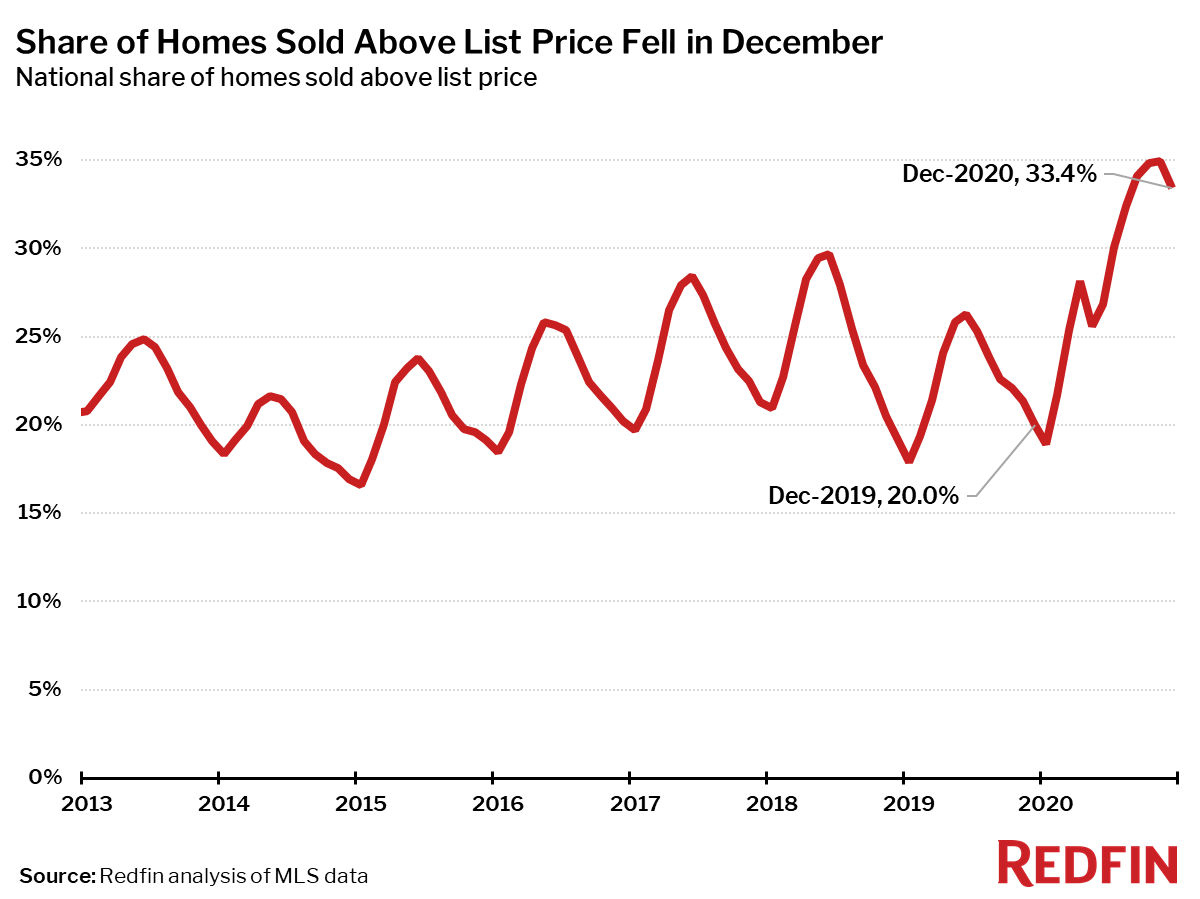
Measures of competition such as time on market and the share of homes sold above list price were at their most extreme December levels on record. However, they did finally ease slightly from November, following a more typical seasonal trend, but this only offered a small amount of relief for homebuyers.
The typical home that sold in December went under contract in 30 days—20 days less than a year earlier.
In December 33% of homes sold above list price, down slightly from the peak in November, but up from 20% a year earlier.
Other December Highlights
Competition
- Tacoma, WA was the fastest market, with half of all homes pending sale in just 6 days, down from 21 days a year earlier. Grand Rapids, MI and Seattle were the next fastest markets with 9 and 9 median days on market, followed by Fresno, CA (10) and Sacramento, CA (10).
- The most competitive market in December was Oakland, CA where 68.1% of homes sold above list price, followed by 59.5% in San Jose, CA, 59.0% in Tacoma, WA, 58.5% in Rochester, NY, and 55.8% in Buffalo, NY.
Prices
- Bridgeport, CT had the nation’s highest price growth, rising 27.9% since last year to $498,764. Camden, NJ had the second highest growth at 24.4% year-over-year price growth, followed by New Brunswick, NJ (20.6%), West Palm Beach, FL (20%), and Dayton, OH (19.5%).
- No metros saw home price declines in December.
Sales
- Bridgeport, CT led the nation in year-over-year sales growth, up 51.8%, followed by New Brunswick, NJ, up 46.9%. Oxnard, CA rounded out the top three with sales up 40.6% from a year ago.
- No metros saw a decline in sales since last year.
Inventory
- San Francisco had the highest increase in the number of homes for sale, up 77% year over year, followed by New York (28%) and San Jose, CA (25%).
- Salt Lake City had the largest decrease in overall active listings, falling 56.8% since last December. Kansas City, MO (-51%), Allentown, PA (-49%), and Elgin, IL (-47%) also saw far fewer homes available on the market than a year ago.
Redfin Estimate
- Miami (90.8%) had the largest share of homes predicted to sell for below list price, according to Redfin Estimate data, followed by Fort Lauderdale, FL (88.6%) and West Palm Beach, FL (87.7%).
- Oakland, CA (91.1%) had the largest share of homes predicted to sell at or above list price, followed by San Jose, CA (87.8%) and Portland, OR (82.0%).
Below are market-by-market breakdowns for prices, inventory, new listings and sales for markets with populations of 750,000 or more. For downloadable data on all of the markets Redfin tracks, visit the Redfin Data Center.
Median Sale Price
| Redfin Metro | Median Sale Price | Month-Over-Month | Year-Over-Year |
|---|---|---|---|
| Albany, NY | $240,000 | 1.1% | 11.4% |
| Allentown, PA | $240,000 | -2.2% | 17.1% |
| Anaheim, CA | $800,000 | 1.1% | 10.7% |
| Atlanta, GA | $284,700 | 1.0% | 13.7% |
| Austin, TX | $370,000 | 1.4% | 15.2% |
| Bakersfield, CA | $284,000 | -0.4% | 13.1% |
| Baltimore, MD | $305,000 | -4.7% | 8.9% |
| Baton Rouge, LA | $225,000 | -3.4% | 4.7% |
| Birmingham, AL | $232,000 | -1.7% | 9.9% |
| Boston, MA | $550,000 | -0.2% | 10.0% |
| Bridgeport, CT | $498,800 | 7.3% | 27.9% |
| Buffalo, NY | $180,000 | -1.6% | 12.5% |
| Camden, NJ | $240,000 | 0.0% | 24.4% |
| Charleston, SC | $319,400 | -1.7% | 14.1% |
| Charlotte, NC | $297,500 | -0.8% | 10.2% |
| Chicago, IL | $270,000 | 0.0% | 12.1% |
| Cincinnati, OH | $215,000 | -1.4% | 15.0% |
| Cleveland, OH | $173,000 | 0.2% | 19.3% |
| Columbus, OH | $245,000 | 1.7% | 16.7% |
| Dallas, TX | $323,900 | 0.3% | 9.1% |
| Dayton, OH | $160,000 | 0.1% | 19.5% |
| Denver, CO | $452,000 | -1.7% | 9.2% |
| Detroit, MI | $155,000 | -3.1% | 14.8% |
| El Paso, TX | $184,300 | 2.3% | 7.5% |
| Elgin, IL | $245,500 | -5.6% | 14.2% |
| Fort Lauderdale, FL | $315,000 | -1.6% | 13.5% |
| Fort Worth, TX | $274,900 | 2.5% | 11.3% |
| Frederick, MD | $440,000 | -2.2% | 6.0% |
| Fresno, CA | $323,000 | 0.9% | 16.7% |
| Grand Rapids, MI | $230,000 | -0.9% | 12.2% |
| Greensboro, NC | $203,400 | -1.3% | 18.3% |
| Greenville, SC | $243,800 | -0.9% | 14.5% |
| Hartford, CT | $255,000 | -0.1% | 16.0% |
| Houston, TX | $273,000 | 1.1% | 7.5% |
| Indianapolis, IN | $220,000 | -0.5% | 13.9% |
| Jacksonville, FL | $268,500 | 2.5% | 13.3% |
| Kansas City, MO | $244,000 | -2.6% | 9.9% |
| Knoxville, TN | $249,900 | 0.0% | 13.6% |
| Lake County, IL | $260,000 | 2.0% | 16.1% |
| Las Vegas, NV | $320,000 | 0.0% | 8.5% |
| Los Angeles, CA | $730,000 | 1.4% | 12.3% |
| Louisville, KY | $220,000 | -2.4% | 11.1% |
| McAllen, TX | $185,000 | 0.0% | 15.2% |
| Memphis, TN | $225,000 | 2.3% | 17.2% |
| Miami, FL | $367,000 | 3.4% | 16.5% |
| Milwaukee, WI | $229,900 | -4.2% | 5.5% |
| Minneapolis, MN | $309,000 | -0.3% | 10.4% |
| Montgomery County, PA | $352,500 | -2.1% | 11.9% |
| Nashville, TN | $329,900 | -1.5% | 5.1% |
| Nassau County, NY | $535,000 | 0.5% | 15.1% |
| New Brunswick, NJ | $384,600 | 1.2% | 20.6% |
| New Haven, CT | $250,000 | 0.0% | 17.4% |
| New Orleans, LA | $250,000 | -2.3% | 8.7% |
| New York, NY | $550,000 | -0.7% | 10.2% |
| Newark, NJ | $427,000 | -0.7% | 16.7% |
| North Port, FL | $324,900 | 2.5% | 13.4% |
| Oakland, CA | $816,600 | -2.8% | 12.6% |
| Oklahoma City, OK | $207,000 | -1.4% | 11.9% |
| Omaha, NE | $225,000 | -5.1% | 10.3% |
| Orlando, FL | $290,000 | -0.3% | 8.3% |
| Oxnard, CA | $685,000 | -2.8% | 13.2% |
| Philadelphia, PA | $245,000 | -2.0% | 15.4% |
| Phoenix, AZ | $340,000 | 1.5% | 16.0% |
| Pittsburgh, PA | $195,600 | 1.1% | 15.0% |
| Portland, OR | $450,000 | 0.0% | 12.5% |
| Providence, RI | $335,000 | 1.5% | 16.3% |
| Raleigh, NC | $315,000 | -0.9% | 8.2% |
| Richmond, VA | $295,000 | 1.9% | 10.7% |
| Riverside, CA | $450,000 | 1.8% | 17.8% |
| Rochester, NY | $172,000 | 1.2% | 15.2% |
| Sacramento, CA | $475,000 | 0.8% | 14.5% |
| Salt Lake City, UT | $400,000 | 2.0% | 14.9% |
| San Antonio, TX | $262,500 | 1.7% | 11.7% |
| San Diego, CA | $660,000 | 0.0% | 12.8% |
| San Francisco, CA | $1,355,000 | -3.2% | 3.0% |
| San Jose, CA | $1,195,000 | -0.4% | 13.3% |
| Seattle, WA | $625,000 | -0.8% | 9.6% |
| St. Louis, MO | $207,200 | -0.9% | 12.0% |
| Tacoma, WA | $435,000 | -1.1% | 16.3% |
| Tampa, FL | $275,000 | 0.0% | 12.2% |
| Tucson, AZ | $262,900 | -0.8% | 10.8% |
| Tulsa, OK | $210,000 | 2.4% | 17.0% |
| Urban Honolulu, HI | $650,000 | 4.0% | 5.0% |
| Virginia Beach, VA | $265,000 | -1.9% | 10.5% |
| Warren, MI | $239,900 | -0.9% | 14.2% |
| Washington, D.C. | $450,000 | 0.0% | 7.4% |
| West Palm Beach, FL | $348,000 | 7.3% | 20.0% |
| Worcester, MA | $320,000 | -1.1% | 13.3% |
| National | $334,300 | -0.2% | 13.1% |
Homes Sold
| Redfin Metro | Homes Sold | Month-Over-Month | Year-Over-Year |
|---|---|---|---|
| Albany, NY | 1,162 | 7.6% | 35.3% |
| Allentown, PA | 1,063 | 0.4% | 28.5% |
| Anaheim, CA | 3,101 | 7.9% | 24.7% |
| Atlanta, GA | 10,004 | 7.8% | 11.1% |
| Austin, TX | 3,432 | 3.6% | 9.9% |
| Bakersfield, CA | 929 | 10.3% | 33.5% |
| Baltimore, MD | 4,250 | 2.9% | 22.8% |
| Baton Rouge, LA | 1,066 | 3.5% | 36.8% |
| Birmingham, AL | 1,464 | 3.8% | 16.7% |
| Boston, MA | 5,114 | 11.9% | 17.5% |
| Bridgeport, CT | 1,594 | 4.4% | 51.8% |
| Buffalo, NY | 1,307 | 4.6% | 15.8% |
| Camden, NJ | 2,049 | 13.0% | 32.2% |
| Charleston, SC | 1,801 | 12.2% | 24.9% |
| Charlotte, NC | 4,384 | 7.0% | 12.4% |
| Chicago, IL | 9,123 | 7.6% | 30.3% |
| Cincinnati, OH | 2,808 | 0.8% | 17.8% |
| Cleveland, OH | 2,827 | 11.0% | 25.2% |
| Columbus, OH | 2,608 | -2.0% | 10.6% |
| Dallas, TX | 6,362 | 9.8% | 8.4% |
| Dayton, OH | 1,049 | 0.9% | 13.2% |
| Denver, CO | 4,982 | -1.9% | 14.7% |
| Detroit, MI | 1,903 | 1.5% | 11.4% |
| El Paso, TX | 956 | 14.5% | 26.0% |
| Elgin, IL | 1,049 | -9.5% | 35.4% |
| Fort Lauderdale, FL | 3,602 | 15.5% | 21.0% |
| Fort Worth, TX | 3,232 | 14.7% | 17.8% |
| Frederick, MD | 1,856 | 10.0% | 30.3% |
| Fresno, CA | 796 | 2.2% | 3.1% |
| Grand Rapids, MI | 1,263 | -12.9% | 10.7% |
| Greensboro, NC | 912 | 5.3% | 14.7% |
| Greenville, SC | 1,282 | 13.4% | 15.2% |
| Hartford, CT | 1,847 | 12.7% | 39.2% |
| Houston, TX | 9,802 | 18.8% | 22.2% |
| Indianapolis, IN | 3,237 | 2.9% | 20.3% |
| Jacksonville, FL | 2,833 | 13.1% | 11.4% |
| Kansas City, MO | 3,188 | -0.3% | 15.3% |
| Knoxville, TN | 1,330 | 7.4% | 14.7% |
| Lake County, IL | 1,159 | -10.5% | 28.6% |
| Las Vegas, NV | 4,138 | 9.4% | 27.7% |
| Los Angeles, CA | 7,176 | 16.1% | 24.7% |
| Louisville, KY | 1,424 | 0.2% | 23.5% |
| McAllen, TX | 315 | 2.6% | 8.6% |
| Memphis, TN | 1,210 | 13.1% | 16.3% |
| Miami, FL | 2,780 | 8.1% | 3.1% |
| Milwaukee, WI | 1,800 | -7.8% | 22.2% |
| Minneapolis, MN | 5,271 | -9.6% | 20.2% |
| Montgomery County, PA | 2,661 | 1.7% | 26.0% |
| Nashville, TN | 4,058 | 18.6% | 20.8% |
| Nassau County, NY | 3,670 | 16.7% | 33.4% |
| New Brunswick, NJ | 4,288 | 13.8% | 46.9% |
| New Haven, CT | 1,194 | -0.2% | 37.7% |
| New Orleans, LA | 1,470 | 14.0% | 39.2% |
| New York, NY | 6,410 | 25.3% | 34.6% |
| Newark, NJ | 2,943 | 8.9% | 32.2% |
| North Port, FL | 2,727 | 15.5% | 34.2% |
| Oakland, CA | 2,806 | -0.2% | 35.0% |
| Oklahoma City, OK | 2,076 | 9.6% | 22.8% |
| Omaha, NE | 1,167 | -6.8% | 15.1% |
| Orlando, FL | 4,516 | 9.5% | 13.8% |
| Oxnard, CA | 873 | 5.7% | 40.6% |
| Philadelphia, PA | 2,392 | 0.3% | 11.7% |
| Phoenix, AZ | 9,538 | 8.9% | 26.5% |
| Pittsburgh, PA | 2,449 | 3.3% | 17.1% |
| Portland, OR | 3,628 | -1.6% | 21.4% |
| Providence, RI | 2,306 | 8.5% | 23.2% |
| Raleigh, NC | 2,750 | 10.5% | 12.3% |
| Richmond, VA | 1,811 | 7.9% | 19.6% |
| Riverside, CA | 6,010 | 11.9% | 35.6% |
| Rochester, NY | 1,127 | -4.3% | 5.3% |
| Sacramento, CA | 3,052 | -0.8% | 28.8% |
| Salt Lake City, UT | 1,620 | -2.0% | 14.6% |
| San Antonio, TX | 3,117 | 8.3% | 10.7% |
| San Diego, CA | 3,546 | 5.0% | 24.4% |
| San Francisco, CA | 1,217 | 1.2% | 39.9% |
| San Jose, CA | 1,359 | -8.1% | 28.7% |
| Seattle, WA | 4,362 | -2.4% | 18.6% |
| St. Louis, MO | 3,855 | 2.0% | 19.5% |
| Tacoma, WA | 1,512 | 2.7% | 24.9% |
| Tampa, FL | 5,996 | 8.0% | 11.0% |
| Tucson, AZ | 1,759 | 18.1% | 25.3% |
| Tulsa, OK | 1,428 | 15.7% | 35.9% |
| Urban Honolulu, HI | 918 | 26.1% | 25.6% |
| Virginia Beach, VA | 2,726 | 14.4% | 29.7% |
| Warren, MI | 3,805 | 1.2% | 22.2% |
| Washington, D.C. | 6,993 | 4.4% | 25.0% |
| West Palm Beach, FL | 3,515 | 18.8% | 24.0% |
| Worcester, MA | 1,265 | 9.5% | 22.3% |
| National | 637,600 | -3.8% | 16.2% |
New Listings
| Redfin Metro | New Listings | Month-Over-Month | Year-Over-Year |
|---|---|---|---|
| Albany, NY | 568 | -32.9% | 25.7% |
| Allentown, PA | 335 | -41.0% | -25.6% |
| Anaheim, CA | 1,866 | -19.9% | 47.3% |
| Atlanta, GA | 6,614 | -15.3% | 6.7% |
| Austin, TX | 2,283 | -13.2% | 28.3% |
| Bakersfield, CA | 640 | -15.7% | 28.3% |
| Baltimore, MD | 2,697 | -21.7% | 27.8% |
| Baton Rouge, LA | 538 | -22.7% | -19.1% |
| Birmingham, AL | 899 | -23.7% | 12.5% |
| Boston, MA | 2,221 | -37.9% | 44.5% |
| Bridgeport, CT | 820 | -25.7% | 55.6% |
| Buffalo, NY | 580 | -32.9% | 14.2% |
| Camden, NJ | 1,237 | -25.5% | 15.8% |
| Charleston, SC | 1,062 | -16.4% | 12.1% |
| Charlotte, NC | 1,997 | -31.1% | -18.1% |
| Chicago, IL | 5,199 | -26.5% | 15.0% |
| Cincinnati, OH | 1,811 | -22.1% | 22.8% |
| Cleveland, OH | 1,493 | -32.0% | 3.6% |
| Columbus, OH | 1,687 | -22.2% | 20.6% |
| Dallas, TX | 4,249 | -14.1% | 7.1% |
| Dayton, OH | 658 | -30.4% | 6.5% |
| Denver, CO | 2,756 | -19.3% | 21.8% |
| Detroit, MI | 1,396 | -17.7% | 1.5% |
| El Paso, TX | 742 | -6.0% | 18.9% |
| Elgin, IL | 590 | -17.5% | 21.4% |
| Fort Lauderdale, FL | 2,772 | -10.3% | 1.2% |
| Fort Worth, TX | 2,117 | -14.7% | 2.2% |
| Frederick, MD | 1,155 | -17.3% | 63.6% |
| Fresno, CA | 523 | -20.6% | 12.2% |
| Grand Rapids, MI | 772 | -20.2% | 12.0% |
| Greensboro, NC | 459 | -17.6% | -9.3% |
| Greenville, SC | 870 | -16.3% | 6.5% |
| Hartford, CT | 890 | -34.0% | 21.4% |
| Houston, TX | 6,920 | -12.9% | 17.8% |
| Indianapolis, IN | 1,881 | -25.9% | 20.3% |
| Jacksonville, FL | 1,986 | -10.5% | 10.2% |
| Kansas City, MO | 1,034 | -45.1% | -32.0% |
| Knoxville, TN | 730 | -29.2% | 10.6% |
| Lake County, IL | 648 | -25.2% | 27.3% |
| Las Vegas, NV | 2,914 | -12.2% | 29.6% |
| Los Angeles, CA | 4,674 | -22.3% | 40.8% |
| Louisville, KY | 1,023 | -18.8% | 41.1% |
| McAllen, TX | 383 | -9.9% | 31.6% |
| Memphis, TN | 800 | -19.1% | 4.0% |
| Miami, FL | 2,996 | -10.5% | 6.4% |
| Milwaukee, WI | 1,017 | -22.2% | 16.8% |
| Minneapolis, MN | 2,719 | -24.3% | 29.5% |
| Montgomery County, PA | 1,382 | -27.6% | 24.8% |
| Nashville, TN | 2,640 | -14.9% | 16.5% |
| Nassau County, NY | 1,907 | -27.7% | 20.5% |
| New Brunswick, NJ | 2,039 | -29.4% | 22.4% |
| New Haven, CT | 659 | -33.8% | 31.5% |
| New Orleans, LA | 1,047 | -21.2% | 16.6% |
| New York, NY | 4,533 | -31.2% | 32.9% |
| Newark, NJ | 1,409 | -31.3% | 26.6% |
| North Port, FL | 1,933 | -10.5% | 8.5% |
| Oakland, CA | 1,641 | -24.4% | 86.1% |
| Oklahoma City, OK | 1,499 | -15.8% | 8.8% |
| Omaha, NE | 709 | -12.9% | 18.8% |
| Orlando, FL | 3,374 | -12.3% | 6.3% |
| Oxnard, CA | 607 | -5.9% | 51.4% |
| Philadelphia, PA | 1,734 | -27.7% | 21.6% |
| Phoenix, AZ | 5,827 | -22.0% | 11.4% |
| Pittsburgh, PA | 1,227 | -32.2% | -1.0% |
| Portland, OR | 1,989 | -20.0% | 41.4% |
| Providence, RI | 1,289 | -25.0% | 27.6% |
| Raleigh, NC | 1,606 | -15.2% | 16.1% |
| Richmond, VA | 1,057 | -22.2% | 27.5% |
| Riverside, CA | 3,751 | -20.2% | 20.8% |
| Rochester, NY | 487 | -39.9% | -8.8% |
| Salt Lake City, UT | 403 | -56.2% | -44.3% |
| San Antonio, TX | 2,200 | -15.2% | -2.7% |
| San Diego, CA | 2,138 | -20.3% | 27.7% |
| San Francisco, CA | 538 | -44.7% | 84.9% |
| San Jose, CA | 874 | -18.3% | 138.8% |
| Seattle, WA | 2,452 | -17.5% | 56.8% |
| St. Louis, MO | 1,414 | -39.7% | -23.5% |
| Tacoma, WA | 865 | -15.1% | 29.9% |
| Tampa, FL | 4,426 | -11.9% | 6.3% |
| Tucson, AZ | 1,156 | -15.8% | 14.9% |
| Tulsa, OK | 917 | -17.9% | 1.8% |
| Urban Honolulu, HI | 551 | -25.3% | -7.1% |
| Virginia Beach, VA | 1,944 | -11.8% | 38.1% |
| Warren, MI | 2,147 | -27.0% | 17.8% |
| Washington, D.C. | 4,398 | -23.0% | 46.4% |
| West Palm Beach, FL | 3,000 | -9.8% | 6.8% |
| Worcester, MA | 626 | -30.4% | 36.1% |
| National | 680,900 | 1.3% | 13.6% |
All Homes for Sale
| Redfin Metro | All Homes for Sale | Month-Over-Month | Year-Over-Year |
|---|---|---|---|
| Albany, NY | 2,432 | -18.5% | -29.4% |
| Allentown, PA | 1,307 | -24.5% | -48.9% |
| Anaheim, CA | 7,008 | -17.4% | -11.3% |
| Atlanta, GA | 20,971 | -14.2% | -34.9% |
| Austin, TX | 6,829 | -15.8% | -19.2% |
| Bakersfield, CA | 1,851 | -12.2% | -20.5% |
| Baltimore, MD | 8,422 | -15.4% | -30.1% |
| Baton Rouge, LA | 2,432 | -11.8% | -44.7% |
| Birmingham, AL | 4,031 | -12.9% | -21.5% |
| Boston, MA | 9,158 | -26.9% | -7.7% |
| Bridgeport, CT | 4,971 | -16.7% | -13.9% |
| Buffalo, NY | 1,638 | -23.0% | -37.0% |
| Camden, NJ | 4,108 | -14.9% | -34.6% |
| Charleston, SC | 5,231 | -9.6% | -19.3% |
| Charlotte, NC | 9,082 | -16.9% | -32.0% |
| Chicago, IL | 25,660 | -15.4% | -20.3% |
| Cincinnati, OH | 7,287 | -13.5% | -11.7% |
| Cleveland, OH | 6,090 | -17.5% | -32.7% |
| Columbus, OH | 6,018 | -17.2% | -18.4% |
| Dallas, TX | 13,740 | -15.9% | -35.7% |
| Dayton, OH | 2,390 | -14.4% | -18.3% |
| Denver, CO | 6,157 | -25.3% | -33.7% |
| Detroit, MI | 4,591 | -14.4% | -33.7% |
| El Paso, TX | 2,527 | -5.8% | -25.1% |
| Elgin, IL | 1,800 | -18.4% | -47.1% |
| Fort Lauderdale, FL | 14,170 | -6.1% | -12.5% |
| Fort Worth, TX | 6,167 | -17.0% | -33.7% |
| Frederick, MD | 3,277 | -16.5% | -18.4% |
| Fresno, CA | 1,271 | -15.9% | -39.1% |
| Grand Rapids, MI | 1,989 | -19.4% | -37.6% |
| Greensboro, NC | 1,734 | -17.2% | -40.3% |
| Greenville, SC | 3,916 | -9.1% | -18.1% |
| Hartford, CT | 4,495 | -19.0% | -23.1% |
| Houston, TX | 24,639 | -9.1% | -23.2% |
| Indianapolis, IN | 4,918 | -19.6% | -33.2% |
| Jacksonville, FL | 6,316 | -12.9% | -30.0% |
| Kansas City, MO | 4,048 | -29.2% | -50.8% |
| Knoxville, TN | 3,612 | -10.5% | -19.9% |
| Lake County, IL | 2,948 | -16.6% | -35.0% |
| Las Vegas, NV | 10,682 | -10.6% | -14.1% |
| Los Angeles, CA | 19,702 | -13.6% | 1.4% |
| Louisville, KY | 3,104 | -11.2% | -19.4% |
| McAllen, TX | 1,499 | -2.9% | -28.1% |
| Memphis, TN | 2,700 | -11.3% | -26.5% |
| Miami, FL | 17,408 | -4.1% | -15.9% |
| Milwaukee, WI | 4,717 | -19.5% | -12.7% |
| Minneapolis, MN | 9,090 | -22.3% | -21.4% |
| Montgomery County, PA | 4,782 | -19.3% | -27.6% |
| Nashville, TN | 8,870 | -11.5% | -29.9% |
| Nassau County, NY | 9,251 | -12.6% | -21.2% |
| New Brunswick, NJ | 8,849 | -16.6% | -30.2% |
| New Haven, CT | 3,356 | -18.7% | -14.0% |
| New Orleans, LA | 3,929 | -9.7% | -26.7% |
| New York, NY | 39,406 | -6.0% | 27.7% |
| Newark, NJ | 7,423 | -14.3% | -16.5% |
| North Port, FL | 5,707 | -9.8% | -31.6% |
| Oakland, CA | 3,799 | -24.0% | 7.6% |
| Oklahoma City, OK | 4,350 | -9.1% | -28.3% |
| Omaha, NE | 1,665 | -15.7% | -32.3% |
| Orlando, FL | 10,716 | -9.6% | -16.3% |
| Oxnard, CA | 1,955 | -11.7% | -13.5% |
| Philadelphia, PA | 7,880 | -12.5% | -3.4% |
| Phoenix, AZ | 17,710 | -15.9% | -18.0% |
| Pittsburgh, PA | 7,794 | -15.3% | -20.1% |
| Portland, OR | 5,105 | -21.7% | -32.4% |
| Providence, RI | 4,694 | -17.1% | -24.6% |
| Raleigh, NC | 5,727 | -14.9% | -26.5% |
| Richmond, VA | 2,604 | -20.0% | -34.8% |
| Riverside, CA | 12,510 | -15.0% | -30.9% |
| Rochester, NY | 1,429 | -30.6% | -41.1% |
| Sacramento, CA | 4,244 | -54.6% | -27.3% |
| Salt Lake City, UT | 1,430 | -42.8% | -56.8% |
| San Antonio, TX | 7,241 | -15.0% | -38.7% |
| San Diego, CA | 5,588 | -18.2% | -23.4% |
| San Francisco, CA | 3,314 | -23.5% | 76.7% |
| San Jose, CA | 2,575 | -21.1% | 24.6% |
| Seattle, WA | 5,889 | -23.0% | -7.9% |
| St. Louis, MO | 6,442 | -23.4% | -39.9% |
| Tacoma, WA | 1,595 | -24.1% | -22.5% |
| Tampa, FL | 11,650 | -10.4% | -31.3% |
| Tucson, AZ | 4,131 | -11.3% | -15.9% |
| Tulsa, OK | 2,653 | -13.7% | -33.0% |
| Urban Honolulu, HI | 3,267 | -8.0% | -21.7% |
| Virginia Beach, VA | 5,389 | -12.0% | -25.8% |
| Warren, MI | 7,017 | -19.5% | -32.8% |
| Washington, D.C. | 14,253 | -15.4% | -5.0% |
| West Palm Beach, FL | 13,970 | -4.4% | -11.3% |
| Worcester, MA | 1,988 | -23.1% | -31.1% |
| National | 1,642,800 | -1.1% | -22.3% |
Median Off-Market Redfin Estimate
| Redfin Metro | Estimate | Month-Over-Month | Year-Over-Year |
|---|---|---|---|
| Albany, NY | $211,400 | 0.9% | 8.4% |
| Allentown, PA | $227,800 | 1.2% | 9.4% |
| Anaheim, CA | $773,100 | 0.9% | 7.4% |
| Atlanta, GA | $249,200 | 1.2% | 9.9% |
| Austin, TX | $322,500 | 1.1% | 9.7% |
| Bakersfield, CA | $211,300 | 0.1% | 11.5% |
| Baltimore, MD | $288,600 | 0.9% | 8.4% |
| Baton Rouge, LA | $136,600 | 0.9% | 7.8% |
| Birmingham, AL | $144,000 | 1.1% | 10.2% |
| Boston, MA | $555,800 | 0.6% | 7.7% |
| Bridgeport, CT | $408,900 | 1.0% | 5.2% |
| Buffalo, NY | $162,300 | 0.8% | 10.0% |
| Camden, NJ | $224,200 | 1.3% | 11.0% |
| Charlotte, NC | $227,700 | 1.2% | 13.5% |
| Chicago, IL | $271,600 | -0.2% | 4.7% |
| Cincinnati, OH | $177,500 | 0.9% | 10.0% |
| Cleveland, OH | $152,000 | 0.8% | 9.9% |
| Columbus, OH | $214,000 | 0.7% | 10.9% |
| Dallas, TX | $272,200 | 1.1% | 6.7% |
| Dayton, OH | $133,600 | 0.7% | 9.6% |
| Denver, CO | $436,200 | 0.6% | 7.6% |
| Detroit, MI | $111,300 | 1.1% | 9.0% |
| Elgin, IL | $241,500 | 0.5% | 5.4% |
| Fort Lauderdale, FL | $288,400 | 1.0% | 8.3% |
| Fort Worth, TX | $233,700 | 0.8% | 8.0% |
| Frederick, MD | $436,000 | 0.8% | 6.5% |
| Fresno, CA | $281,200 | 0.9% | 10.3% |
| Grand Rapids, MI | $185,600 | 0.9% | 11.7% |
| Greensboro, NC | $150,800 | 1.7% | 12.7% |
| Greenville, SC | $171,300 | 0.8% | 10.1% |
| Hartford, CT | $233,900 | 0.7% | 5.6% |
| Houston, TX | $211,300 | 1.1% | 8.3% |
| Indianapolis, IN | $178,400 | 0.7% | 11.1% |
| Jacksonville, FL | $224,900 | 0.9% | 9.1% |
| Kansas City, MO | $195,600 | 0.7% | 9.1% |
| Knoxville, TN | $193,400 | 1.2% | 11.1% |
| Lake County, IL | $229,200 | 0.6% | 6.0% |
| Las Vegas, NV | $298,300 | 0.7% | 6.5% |
| Los Angeles, CA | $687,100 | 1.1% | 8.4% |
| Louisville, KY | $188,400 | 0.9% | 8.9% |
| Memphis, TN | $161,700 | 0.9% | 13.6% |
| Miami, FL | $329,800 | 0.7% | 5.6% |
| Milwaukee, WI | $220,800 | 0.3% | 13.3% |
| Minneapolis, MN | $289,300 | 0.6% | 7.6% |
| Montgomery County, PA | $345,500 | 0.8% | 7.9% |
| Nashville, TN | $294,900 | 0.9% | 9.4% |
| Nassau County, NY | $518,800 | 1.2% | 8.1% |
| New Brunswick, NJ | $371,600 | 1.3% | 8.8% |
| New Haven, CT | $235,800 | 1.0% | 7.3% |
| New Orleans, LA | $181,300 | 0.8% | 8.1% |
| Newark, NJ | $396,600 | 1.8% | 9.8% |
| North Port, FL | $250,900 | 1.1% | 8.1% |
| Oakland, CA | $829,200 | 0.8% | 8.9% |
| Oklahoma City, OK | $155,600 | 0.7% | 9.2% |
| Omaha, NE | $203,200 | 0.8% | 8.9% |
| Orlando, FL | $248,600 | 1.2% | 8.0% |
| Oxnard, CA | $638,200 | 1.3% | 7.8% |
| Philadelphia, PA | $207,300 | 1.0% | 11.6% |
| Phoenix, AZ | $299,300 | 1.5% | 13.1% |
| Pittsburgh, PA | $146,100 | 1.0% | 11.3% |
| Portland, OR | $422,600 | 0.7% | 7.4% |
| Providence, RI | $320,100 | 1.2% | 11.3% |
| Raleigh, NC | $273,500 | 0.7% | 8.6% |
| Richmond, VA | $252,700 | 0.8% | 9.0% |
| Riverside, CA | $362,300 | 1.6% | 11.6% |
| Rochester, NY | $154,300 | 0.5% | 8.3% |
| Sacramento, CA | $438,600 | 0.0% | 8.0% |
| Salt Lake City, UT | $384,800 | 1.2% | 11.3% |
| San Antonio, TX | $196,600 | 0.6% | 8.2% |
| San Diego, CA | $653,300 | 1.1% | 10.6% |
| San Francisco, CA | $1,361,900 | -0.4% | 0.7% |
| San Jose, CA | $1,206,600 | 0.6% | 8.1% |
| Seattle, WA | $603,900 | 1.0% | 11.1% |
| St. Louis, MO | $168,200 | 0.6% | 8.2% |
| Tacoma, WA | $403,800 | 2.0% | 15.7% |
| Tampa, FL | $237,000 | 1.3% | 10.3% |
| Tucson, AZ | $222,500 | 1.2% | 12.4% |
| Tulsa, OK | $141,800 | 0.9% | 10.3% |
| Urban Honolulu, HI | $718,400 | 0.6% | 2.8% |
| Virginia Beach, VA | $248,200 | 0.8% | 8.7% |
| Warren, MI | $225,400 | 0.6% | 8.3% |
| Washington, D.C. | $423,900 | 0.8% | 7.2% |
| West Palm Beach, FL | $290,600 | 0.8% | 7.0% |
| Worcester, MA | $303,100 | 1.1% | 10.4% |
| National | $318,100 | -0.2% | 14.5% |


