Nationwide, energy costs are taking up a smaller portion of homeowner expenses because they’re not surging nearly as quickly as housing prices.
The typical U.S. household spent an estimated $2,127 on energy utility bills in 2021, equal to 14.8% of the annual mortgage payment for homebuyers. That compares with $1,986 (15.8%) a year earlier and $1,906 (23.4%) a decade earlier.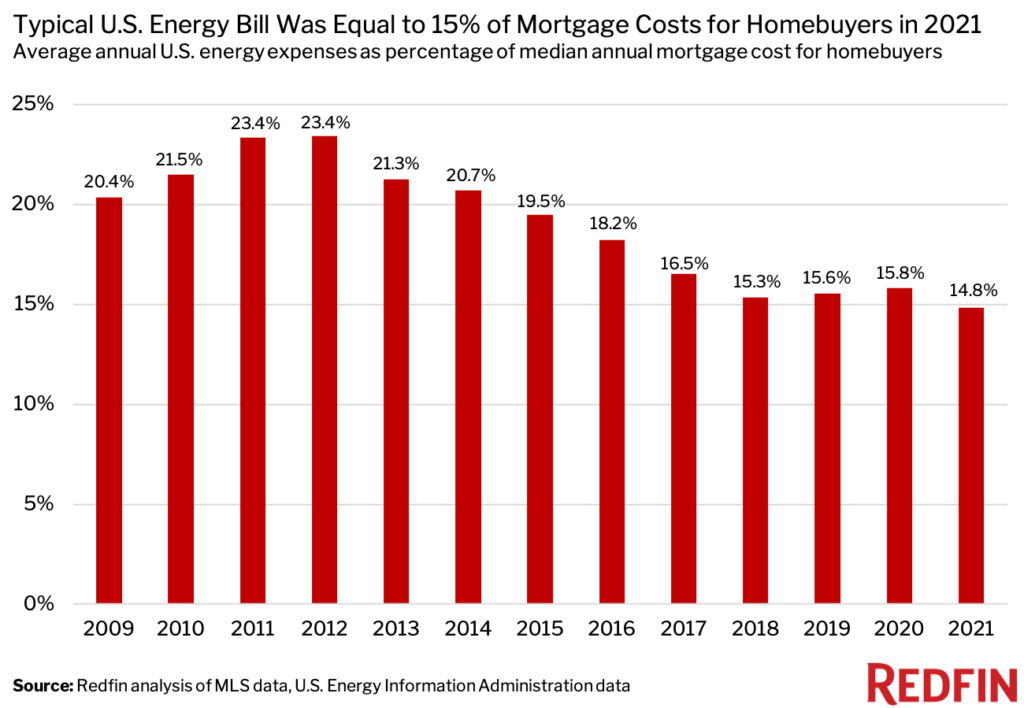
“Even though energy costs rose in 2021, they represented a smaller share of mortgage costs than in the past. That’s because they increased at a much slower rate than home prices, which skyrocketed during the pandemic due to record-low mortgage rates and a wave of relocations made possible by remote work,” said Redfin Senior Economist Sheharyar Bokhari. “This may start to level out now that home prices are no longer growing as quickly and energy costs are surging due to rising natural gas prices.”
We estimate the typical household in Cleveland spent an average of $2,065 on energy expenses in 2021, equal to 30.7% of the $6,719 median annual mortgage payment for homebuyers. That’s a higher percentage than any other major U.S. metro. Next came Oklahoma City, OK (30.2%), Birmingham, AL (28.8%), Pittsburgh (28.2%) and Buffalo, NY (28.2%).
This is according to a Redfin analysis of MLS mortgage-cost data in the 50 most populous U.S. metropolitan areas and state-level energy cost data from the U.S. Energy Information Administration. Energy costs include electricity and natural-gas expenses for utilities.
Energy costs from metro to metro don’t vary nearly as much as home prices, which is one reason relatively affordable metros are at the top of the list and expensive metros are at the bottom. In San Jose, CA, the typical household spent an estimated $2,138 on energy expenses last year, not much more than the typical Clevelander. But that was equal to just 3.9% of the annual mortgage payment for buyers—the lowest of any major metro. Other pricey West Coast metros round out the bottom five: San Francisco (4.8%), Los Angeles (6.5%), Seattle (7.3%) and San Diego (7.3%).
Oklahoma, Louisiana Saw Largest Jump in Energy Costs in 2021
Nationwide, the average annual energy cost rose 6.8% year over year in 2021. The jump was largest in Oklahoma, where the average annual energy cost climbed 21.6%—a likely reason Oklahoma City is near the top of the list above. Next came Louisiana (14.5%), followed by Arkansas (14%), Colorado (13.2%) and Hawaii (11.2%). Please note that the data in this section is at the state level only.
There were just three states where energy costs fell. In Nevada, the average annual energy bill dropped 1% year over year, and in Alaska and Arizona, it declined 0.4%. The smallest increases were in Vermont (0.1%) and Connecticut (0.2%).
Energy costs will likely continue to rise in 2022 due to the war in Ukraine, which has led to a surge in natural-gas costs. At the start of this year, the national average residential electricity rate was up 8% from a year earlier—the largest annual increase in over a decade.
Metro Energy Cost Summary: 50 Most Populous U.S Metros (2021 and 2020)
Figures in the table below represent estimates.
| U.S. Metro Area | Average Annual Energy Cost: 2021 | Median Annual Homebuyer Mortgage Payment: 2021 | Average Annual Energy Cost as % of Median Mortgage Payment: 2021 | Average Annual Energy Cost: 2020 | Median Annual Homebuyer Mortgage Payment: 2020 | Average Annual Energy Cost as % of Median Mortgage Payment: 2020 |
| Atlanta, GA | $2,516 | $10,726 | 23.5% | $2,310 | $8,783 | 26.3% |
| Austin, TX | $2,189 | $16,797 | 13.0% | $2,090 | $12,345 | 16.9% |
| Baltimore, MD | $2,174 | $13,393 | 16.2% | $2,045 | $12,142 | 16.8% |
| Birmingham, AL | $2,445 | $8,500 | 28.8% | $2,325 | $7,690 | 30.2% |
| Boston, MA | $2,473 | $21,168 | 11.7% | $2,357 | $18,375 | 12.8% |
| Buffalo, NY | $2,209 | $7,846 | 28.2% | $2,048 | $6,739 | 30.4% |
| Charlotte, NC | $1,978 | $11,491 | 17.2% | $1,865 | $9,633 | 19.4% |
| Chicago, IL | $1,970 | $10,402 | 18.9% | $1,876 | $9,208 | 20.4% |
| Cincinnati, OH | $2,065 | $8,257 | 25.0% | $1,918 | $7,204 | 26.6% |
| Cleveland, OH | $2,065 | $6,719 | 30.7% | $1,918 | $6,071 | 31.6% |
| Columbus, OH | $2,065 | $9,791 | 21.1% | $1,918 | $8,500 | 22.6% |
| Dallas, TX | $2,189 | $11,697 | 18.7% | $2,090 | $9,791 | 21.3% |
| Denver, CO | $1,863 | $20,844 | 8.9% | $1,646 | $17,505 | 9.4% |
| Detroit, MI | $2,278 | $8,095 | 28.1% | $2,095 | $7,285 | 28.8% |
| Hartford, CT | $2,650 | $10,726 | 24.7% | $2,645 | $9,511 | 27.8% |
| Houston, TX | $2,189 | $10,321 | 21.2% | $2,090 | $8,904 | 23.5% |
| Indianapolis, IN | $2,230 | $8,580 | 26.0% | $2,062 | $7,366 | 28.0% |
| Jacksonville, FL | $2,026 | $11,090 | 18.3% | $1,941 | $9,399 | 20.6% |
| Kansas City, MO | $2,139 | $8,985 | 23.8% | $2,033 | $7,973 | 25.5% |
| Las Vegas, NV | $1,840 | $14,571 | 12.6% | $1,859 | $12,142 | 15.3% |
| Los Angeles, CA | $2,138 | $32,784 | 6.5% | $1,976 | $28,332 | 7.0% |
| Louisville, KY | $2,094 | $8,500 | 24.6% | $1,905 | $7,589 | 25.1% |
| Memphis, TN | $2,092 | $7,795 | 26.8% | $1,898 | $6,719 | 28.2% |
| Miami, FL | $2,026 | $16,271 | 12.5% | $1,941 | $13,964 | 13.9% |
| Milwaukee, WI | $1,874 | $10,118 | 18.5% | $1,814 | $9,309 | 19.5% |
| Minneapolis, MN | $1,962 | $12,749 | 15.4% | $1,842 | $11,333 | 16.3% |
| Nashville, TN | $2,092 | $13,908 | 15.0% | $1,898 | $11,616 | 16.3% |
| New Orleans, LA | $2,179 | $9,527 | 22.9% | $1,902 | $8,702 | 21.9% |
| New York, NY | $2,209 | $18,011 | 12.3% | $2,048 | $15,582 | 13.1% |
| Oklahoma City, OK | $2,363 | $7,811 | 30.2% | $1,944 | $7,083 | 27.4% |
| Orlando, FL | $2,026 | $12,102 | 16.7% | $1,941 | $10,321 | 18.8% |
| Philadelphia, PA | $2,046 | $11,535 | 17.7% | $1,969 | $9,921 | 19.8% |
| Phoenix, AZ | $1,995 | $15,380 | 13.0% | $2,003 | $12,138 | 16.5% |
| Pittsburgh, PA | $2,046 | $7,245 | 28.2% | $1,969 | $6,476 | 30.4% |
| Portland, OR | $1,749 | $19,215 | 9.1% | $1,637 | $16,473 | 9.9% |
| Providence, RI | $2,414 | $14,530 | 16.6% | $2,335 | $12,628 | 18.5% |
| Raleigh, NC | $1,978 | $12,992 | 15.2% | $1,865 | $10,797 | 17.3% |
| Richmond, VA | $2,137 | $10,523 | 20.3% | $2,041 | $9,410 | 21.7% |
| Riverside, CA | $2,138 | $17,849 | 12.0% | $1,976 | $14,773 | 13.4% |
| Sacramento, CA | $2,138 | $19,832 | 10.8% | $1,976 | $16,797 | 11.8% |
| Salt Lake City, UT | $1,739 | $17,647 | 9.9% | $1,700 | $14,449 | 11.8% |
| San Antonio, TX | $2,189 | $10,118 | 21.6% | $2,090 | $8,783 | 23.8% |
| San Diego, CA | $2,138 | $29,344 | 7.3% | $1,976 | $24,892 | 7.9% |
| San Francisco, CA | $2,138 | $44,521 | 4.8% | $1,976 | $37,236 | 5.3% |
| San Jose, CA | $2,138 | $55,247 | 3.9% | $1,976 | $48,164 | 4.1% |
| Seattle, WA | $1,698 | $23,353 | 7.3% | $1,581 | $19,387 | 8.2% |
| St. Louis, MO | $2,139 | $7,694 | 27.8% | $2,033 | $7,123 | 28.5% |
| Tampa, FL | $2,026 | $11,535 | 17.6% | $1,941 | $9,552 | 20.3% |
| Virginia Beach, VA | $2,137 | $10,118 | 21.1% | $2,041 | $9,107 | 22.4% |
| Washington, D.C. | $2,137 | $16,768 | 12.7% | $2,041 | $14,692 | 13.9% |
Methodology
This analysis pairs MLS mortgage-cost data across the 50 most populous U.S. metropolitan areas with U.S. Energy Information Administration data for each corresponding state to estimate energy costs as a percentage of mortgage costs on the metro level. That means each metro within the same state has the same average annual energy cost, while annual median mortgage costs vary. We calculated the annual mortgage cost using the median sale price of single-family homes, assuming a 20% down payment. We assumed the average annual interest rate for the year, which for 2021 was 3%.
Energy costs include residential electricity and natural-gas utility expenses. To calculate cost per household, we divided the corresponding costs by the number of households, using estimates from the American Community Survey. The latest available data for the number of households is 2020. For the years 2020 and 2021, we assumed the same number of households.