A record-high share of home sellers are dropping their prices after this month’s historic mortgage-rate hike put a damper on homebuyer activity. But there are early signs that demand is leveling off.
More and more, home sellers are ceding to the mounting pressure on affordability posed by this month’s rapid mortgage-rate hike. The median asking price of newly listed homes is down 1.5% from the all-time high it reached in the spring, and a record-high share of sellers dropped their asking price during the four-week period ending June 26. Pending sales continued to fall, posting their largest decline since May 2020, but there are signs that early-stage homebuyer demand is starting to level off.
“Data on home-tours,offers and mortgage purchase applications suggest that homebuyers have noticed the shift in power and are no longer leaving the market in droves,” said Redfin chief economist Daryl Fairweather. “Buyers coming back will provide support to the housing market, but between now and the end of year I think the power will continue to shift towards buyers, resulting in mild price declines from month to month.”
“Homebuyers are worried about interest rates, having to go back to the office, getting laid off, and wondering if they can get a better deal by waiting out the market,” said Redfin Seattle-area real estate agent Caroline Loudenback. “On the other side, sellers are adjusting to this new reality and learning that sometimes there’s not much they can do to increase buyer interest. Sometimes price isn’t even the reason a home is sitting on the market without selling—some more remote areas that were super popular during the pandemic are now being overlooked as buyers reconsider long commutes with high gas prices. It’s a tricky market and you have to pay close attention to your local sales and listings to understand what’s happening.”
Leading indicators of homebuying activity:
- For the week ending June 30, 30-year mortgage rates fell slightly to 5.7%.
- Fewer people searched for “homes for sale” on Google—searches during the week ending June 25 were down 7% from a year earlier.
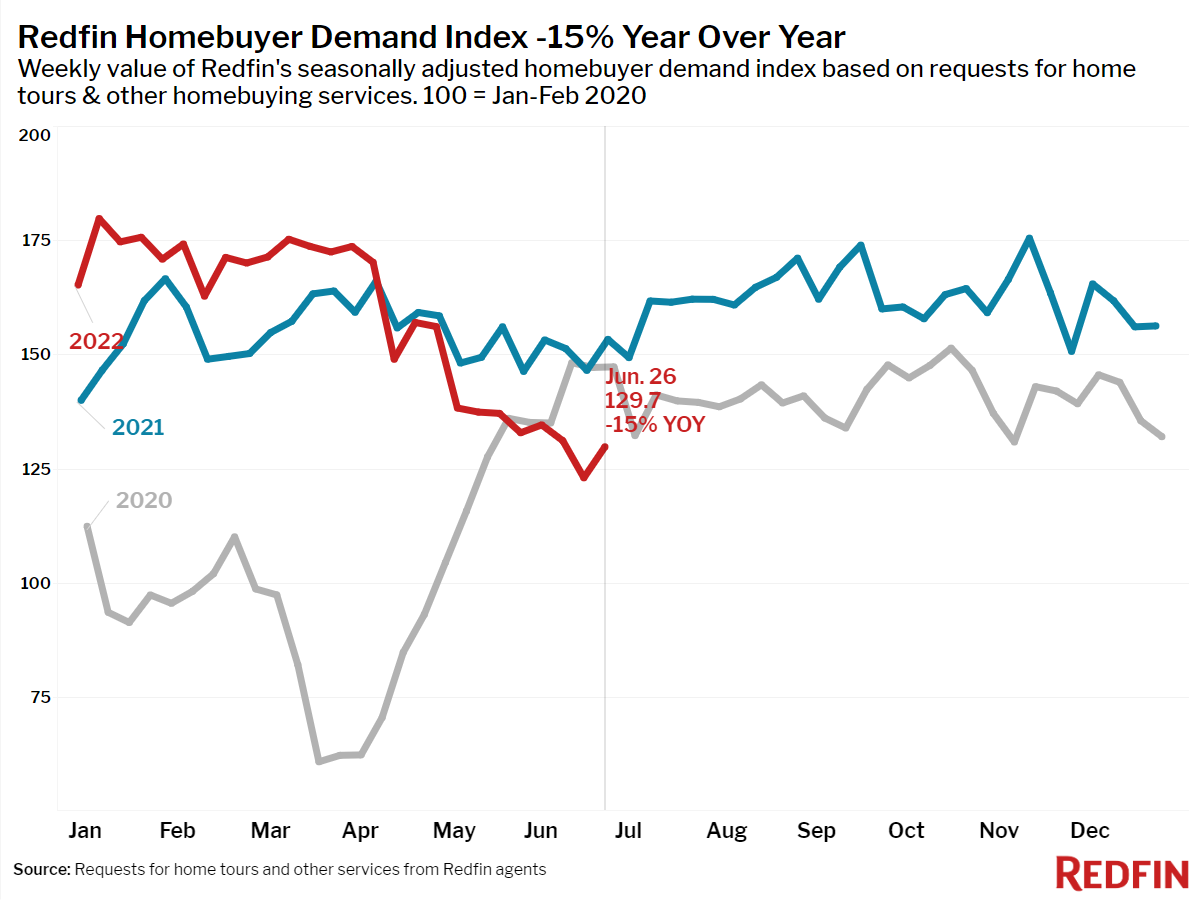
- The seasonally-adjusted Redfin Homebuyer Demand Index—a measure of requests for home tours and other home-buying services from Redfin agents—was down 15% year over year during the week ending June 26, but up 7 points from the previous week.
- Touring activity as of June 26 fell 3% from the start of the year, compared to a 24% increase at this time last year, according to home tour technology company ShowingTime.
- Mortgage purchase applications were down 24% from a year earlier, while the seasonally-adjusted index was up 0.1% week over week during the week ending June 17.
Key housing market takeaways for 400+ U.S. metro areas:
Unless otherwise noted, the data in this report covers the four-week period ending June 26. Redfin’s housing market data goes back through 2012.
Data based on homes listed and/or sold during the period:
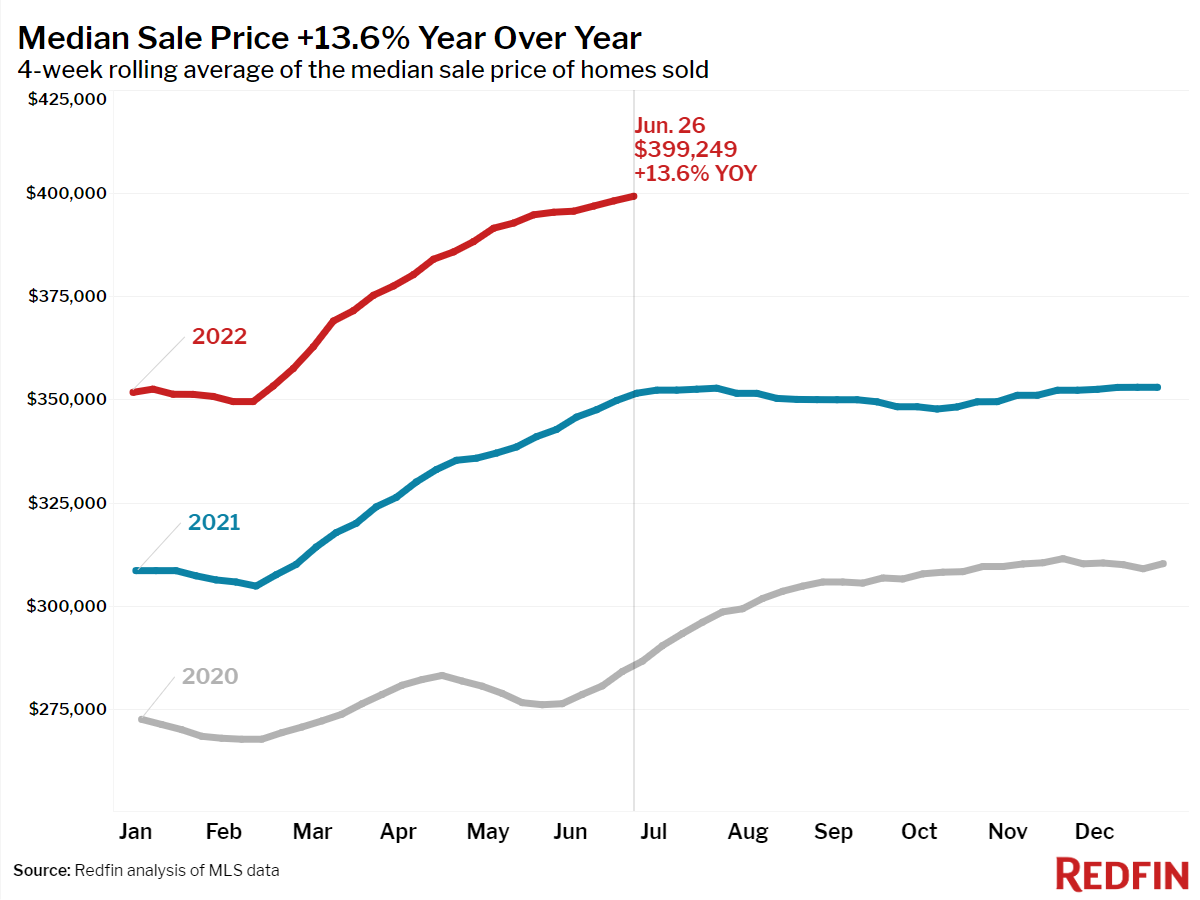
- The median home sale price was up 14% year over year to a record $399,249.
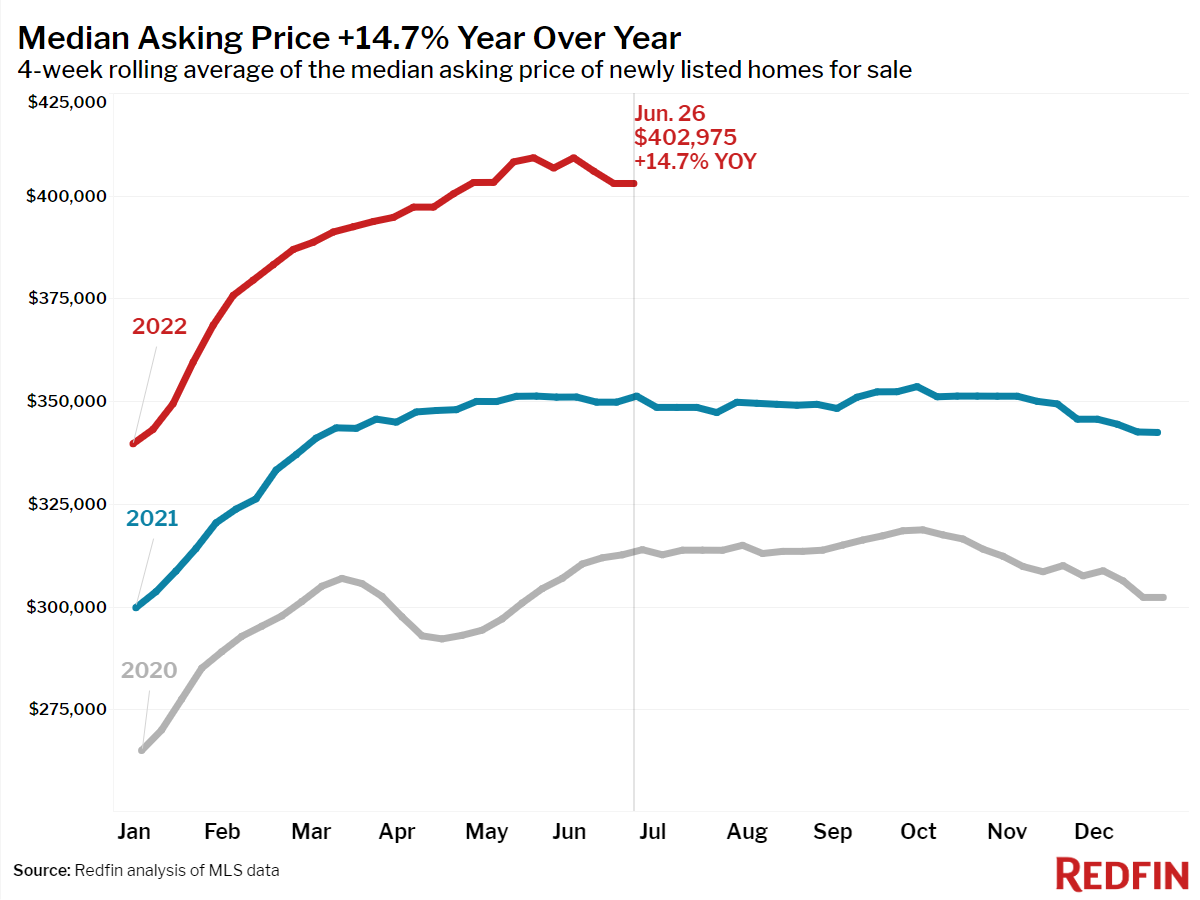
- The median asking price of newly listed homes increased 15% year over year to $405,547, but was down 1.5% from the all-time high set during the four-week period ending May 22.
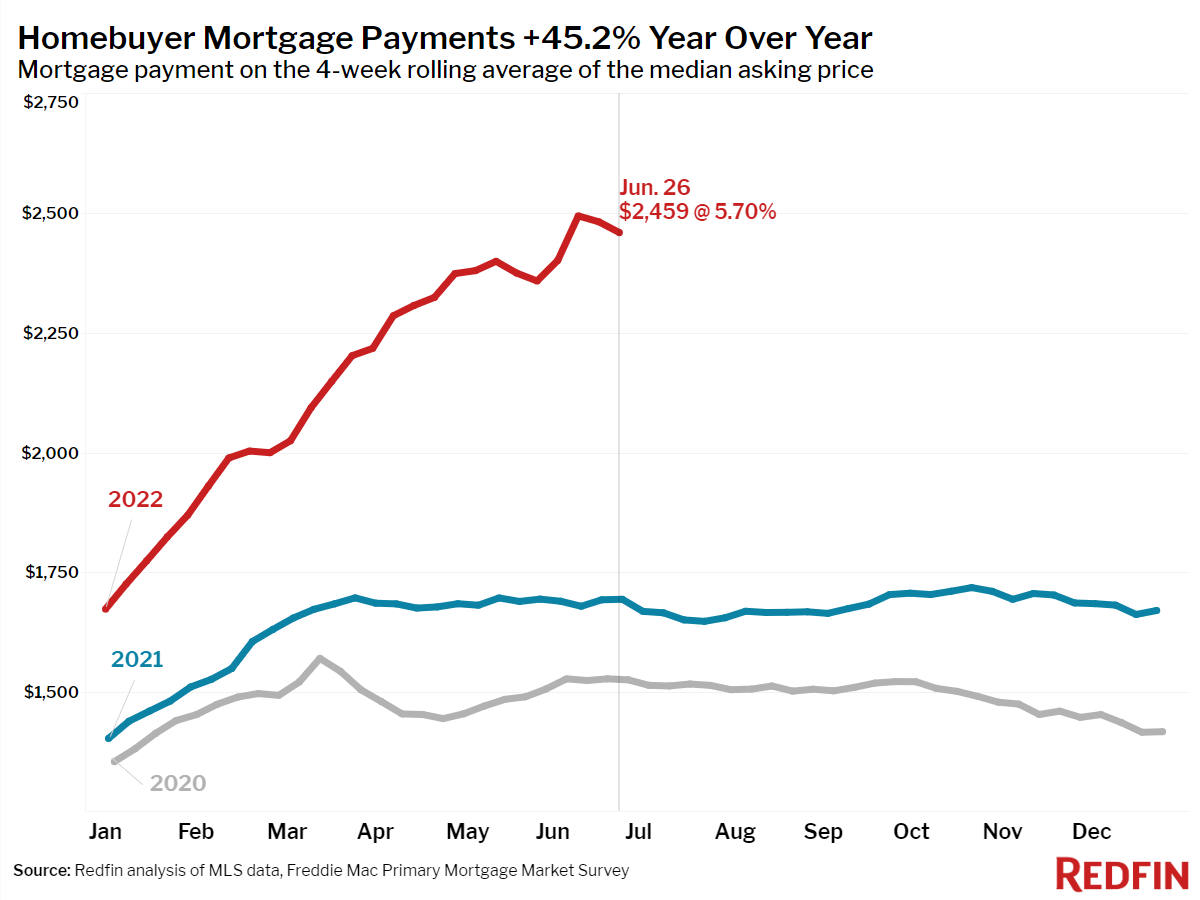
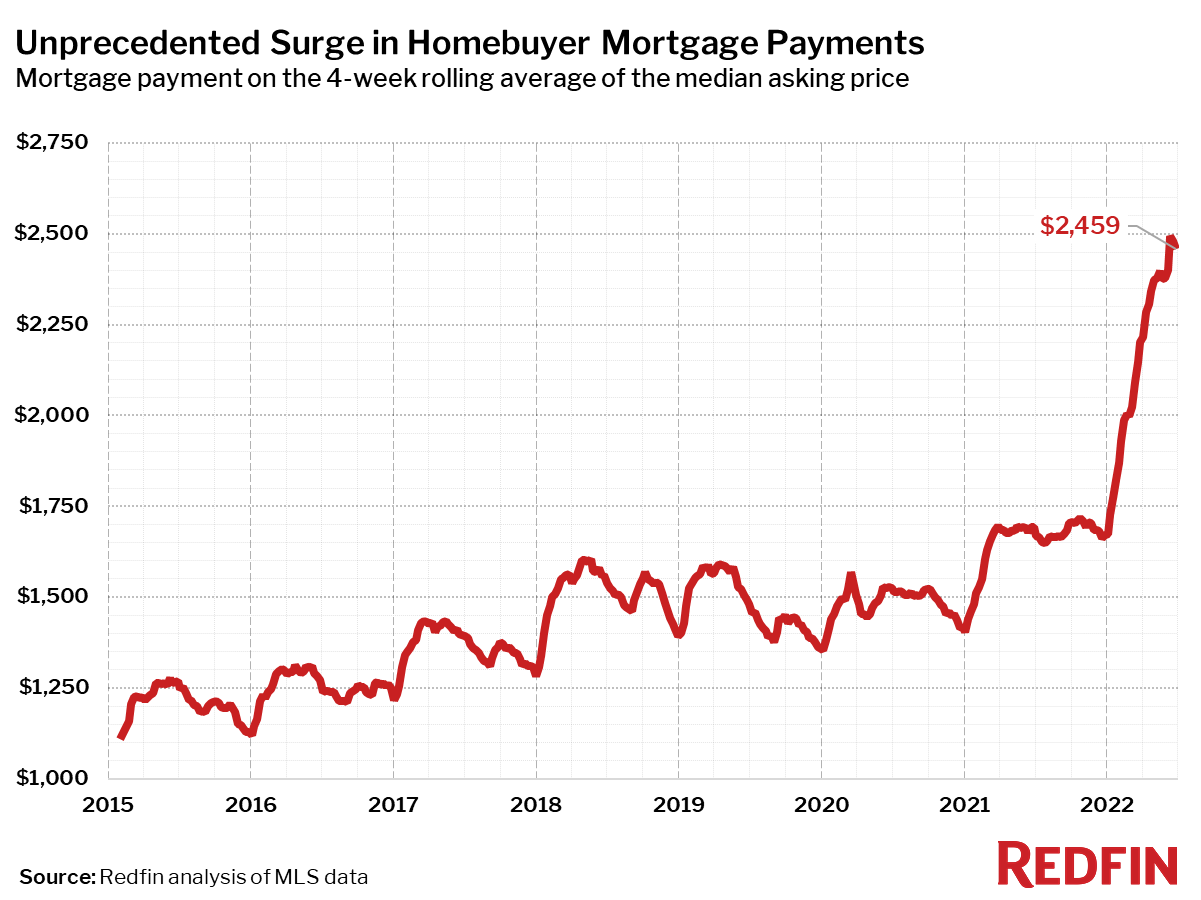
- The monthly mortgage payment on the median asking price home increased to $2,459 at the current 5.7% mortgage rate, but is down slightly from the peak of $2,494 during the four-week period ending June 12. This was up 45% from $1,694 a year earlier, when mortgage rates were 2.98%.
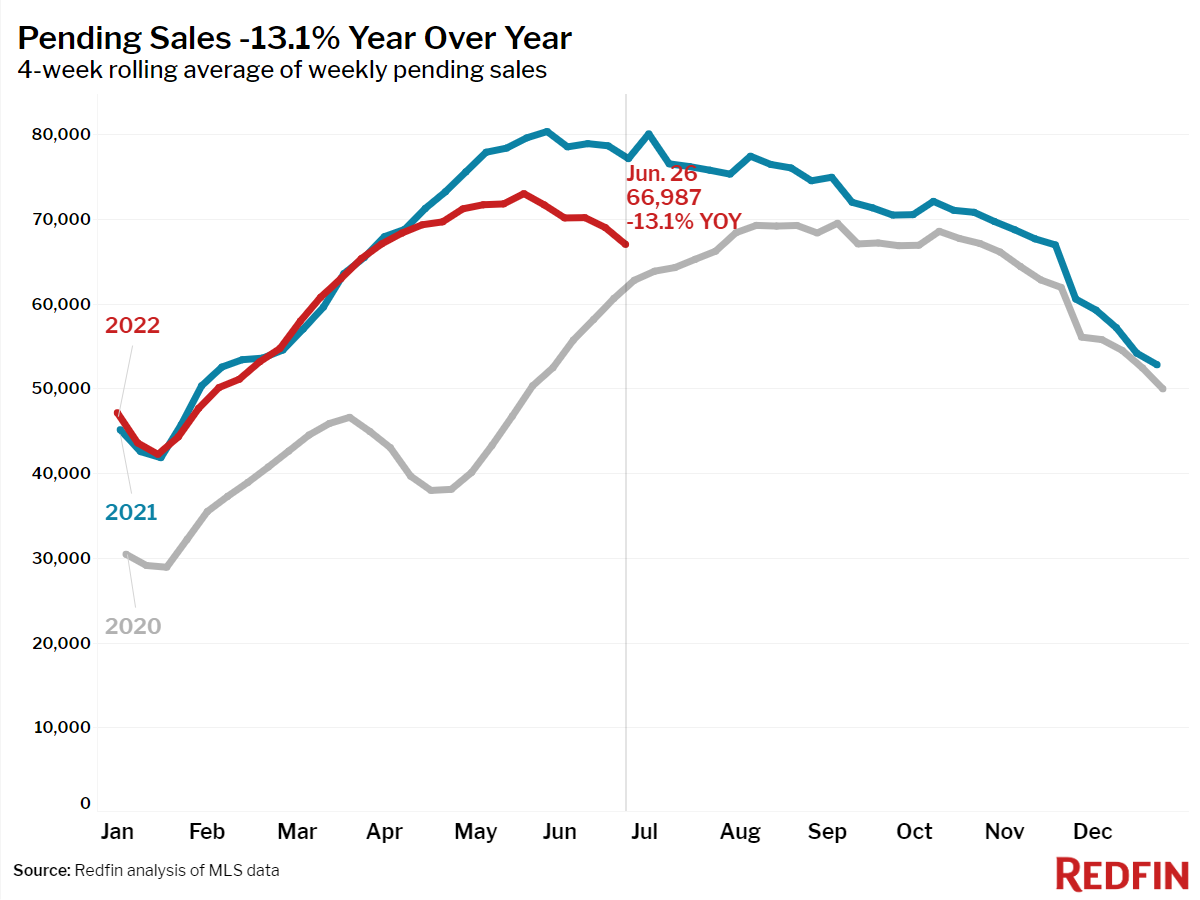
- Pending home sales were down 13% year over year, the largest decline since May 2020.
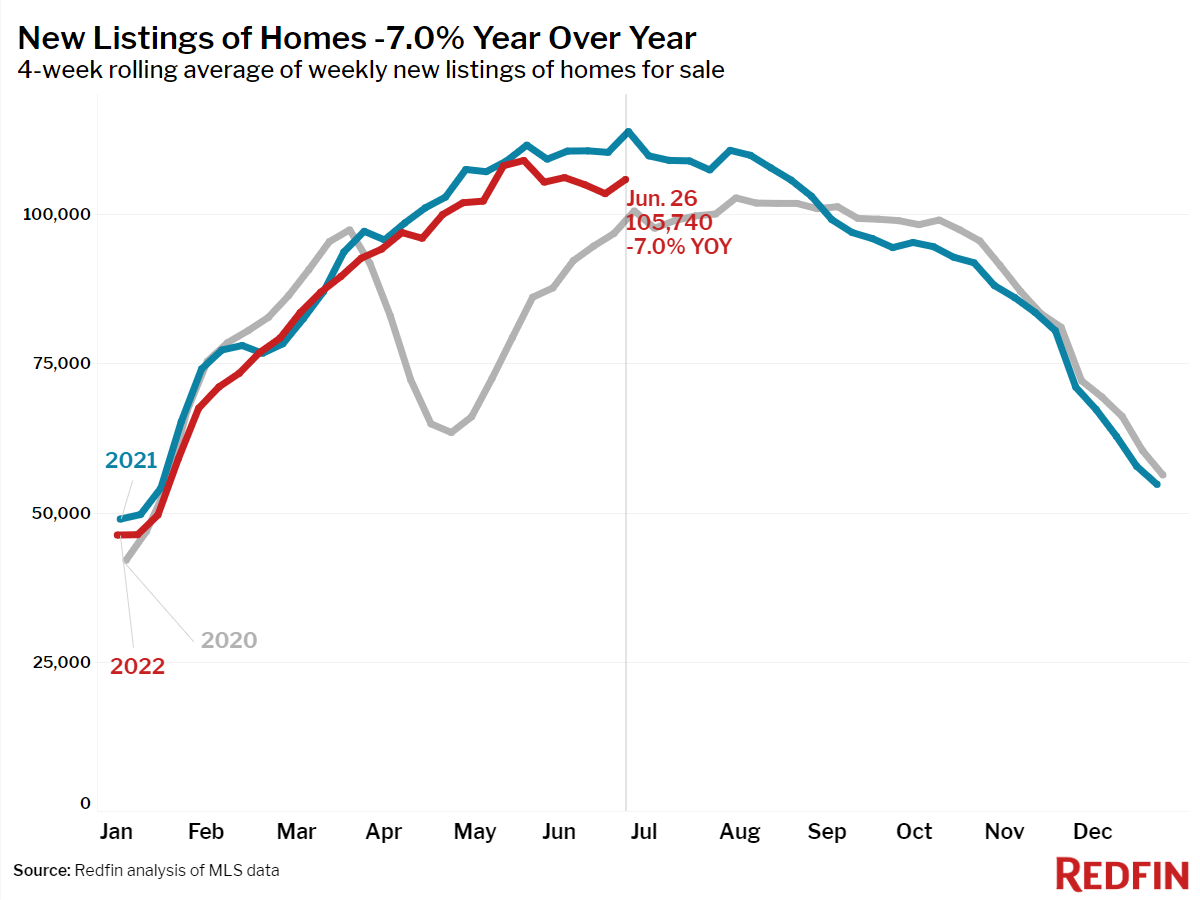
- New listings of homes for sale were down 7% from a year earlier.
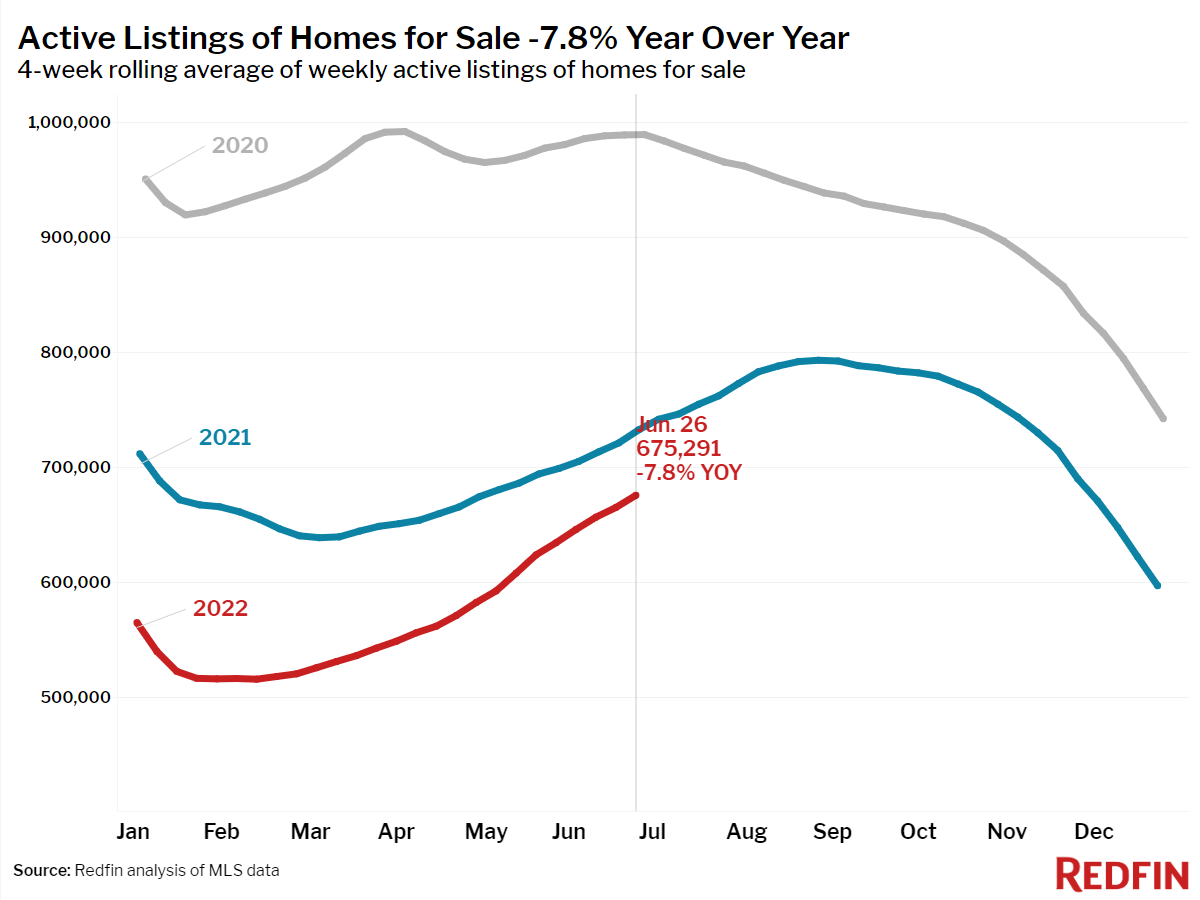
- Active listings (the number of homes listed for sale at any point during the period) fell 8% year over year—the smallest decline since March 2020.
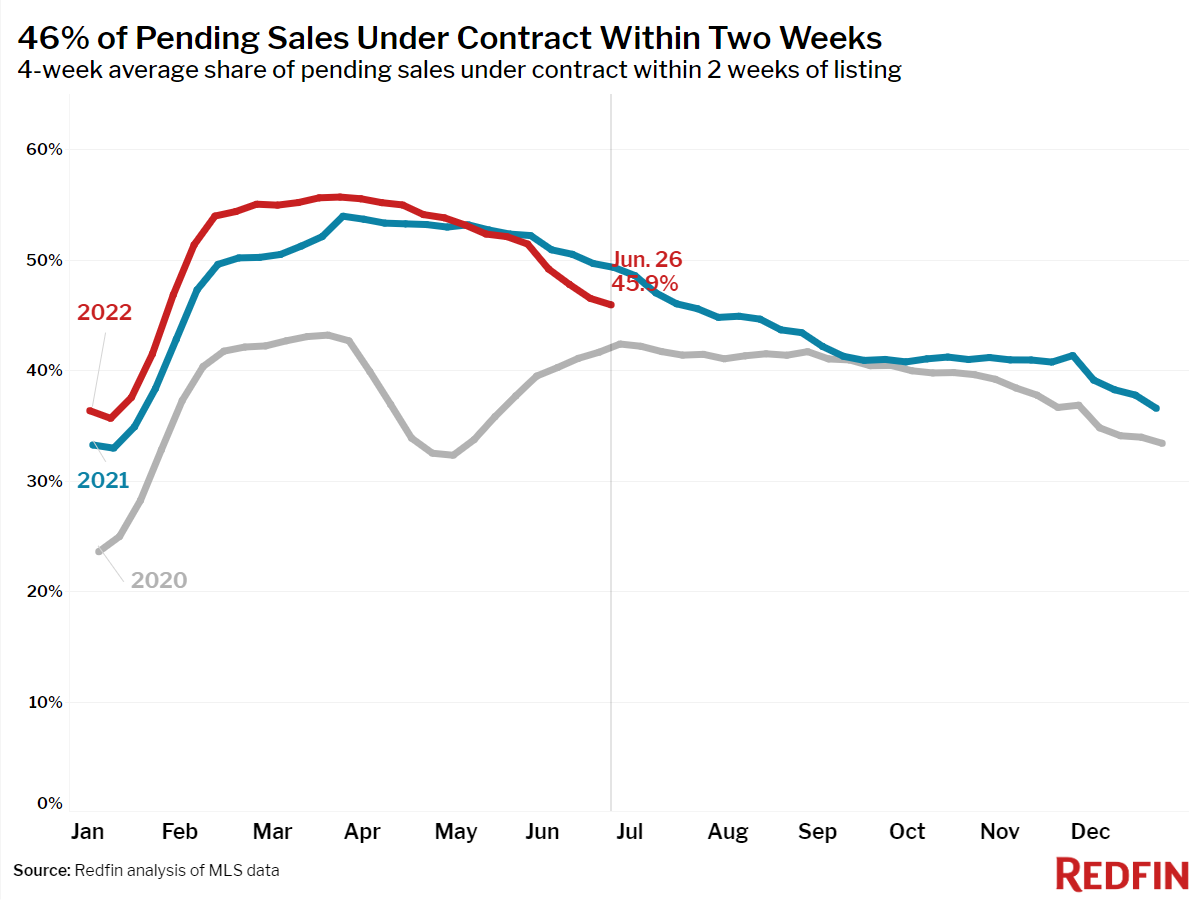
- 46% of homes that went under contract had an accepted offer within the first two weeks on the market, down from 49% a year earlier.
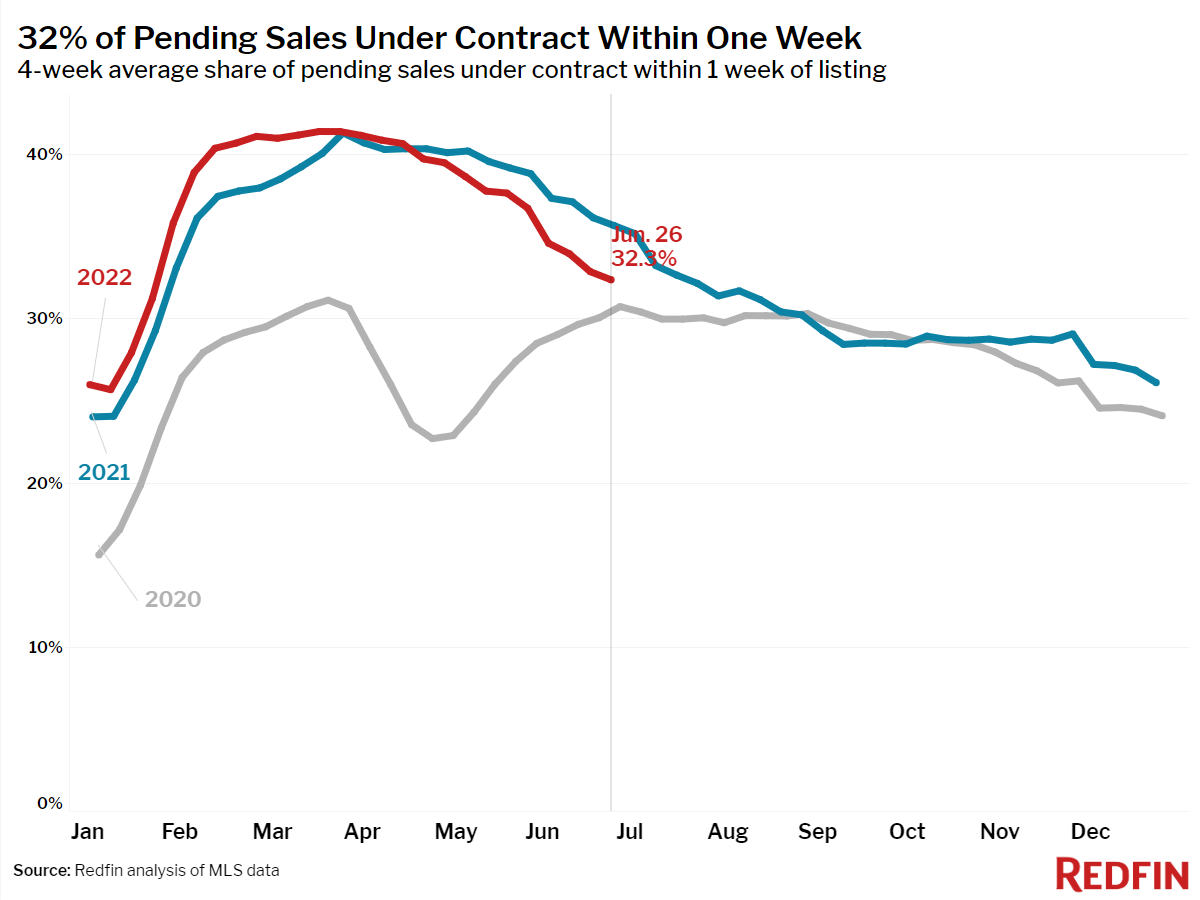
- 32% of homes that went under contract had an accepted offer within one week of hitting the market, down from 36% a year earlier.
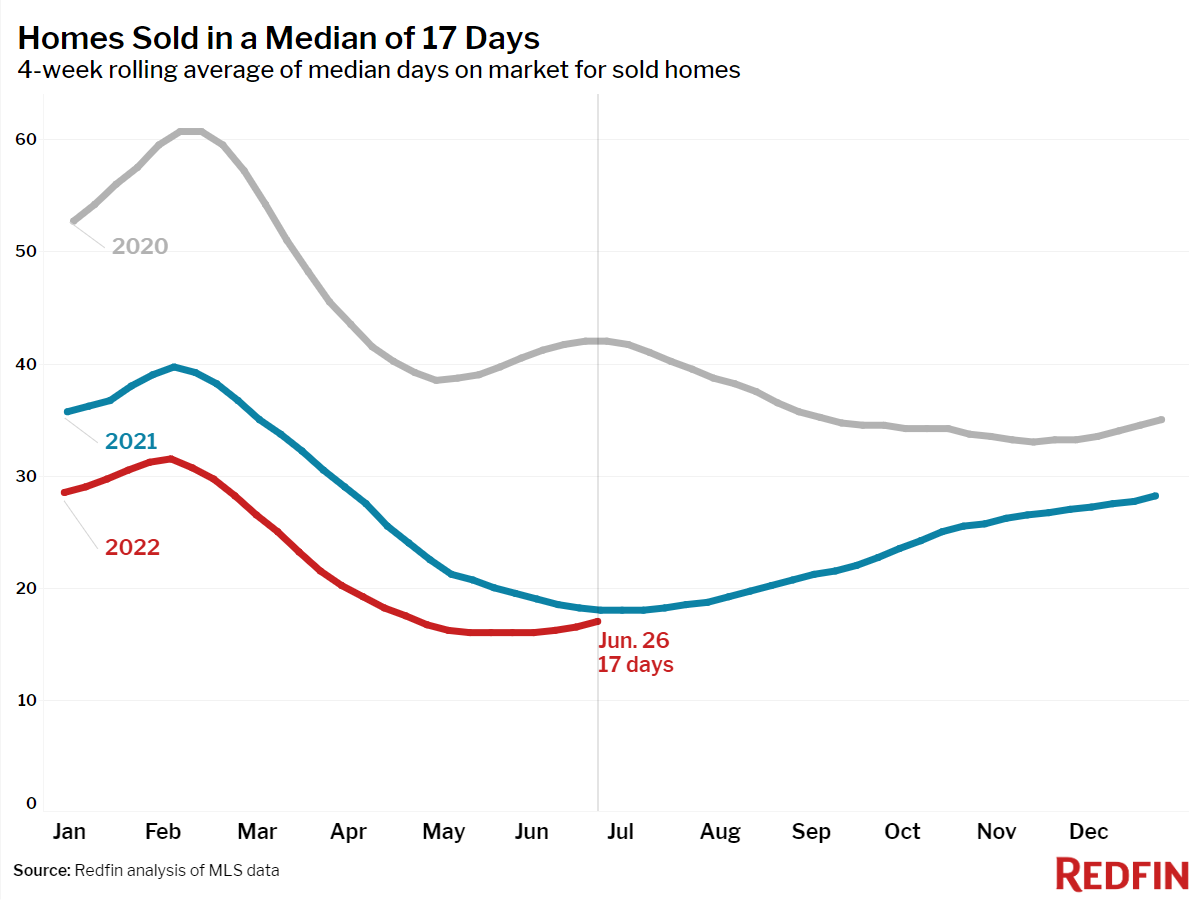
- Homes that sold were on the market for a median of 17 days, down from 18 days a year earlier and up slightly from the record low of 15 days set in May and early June.
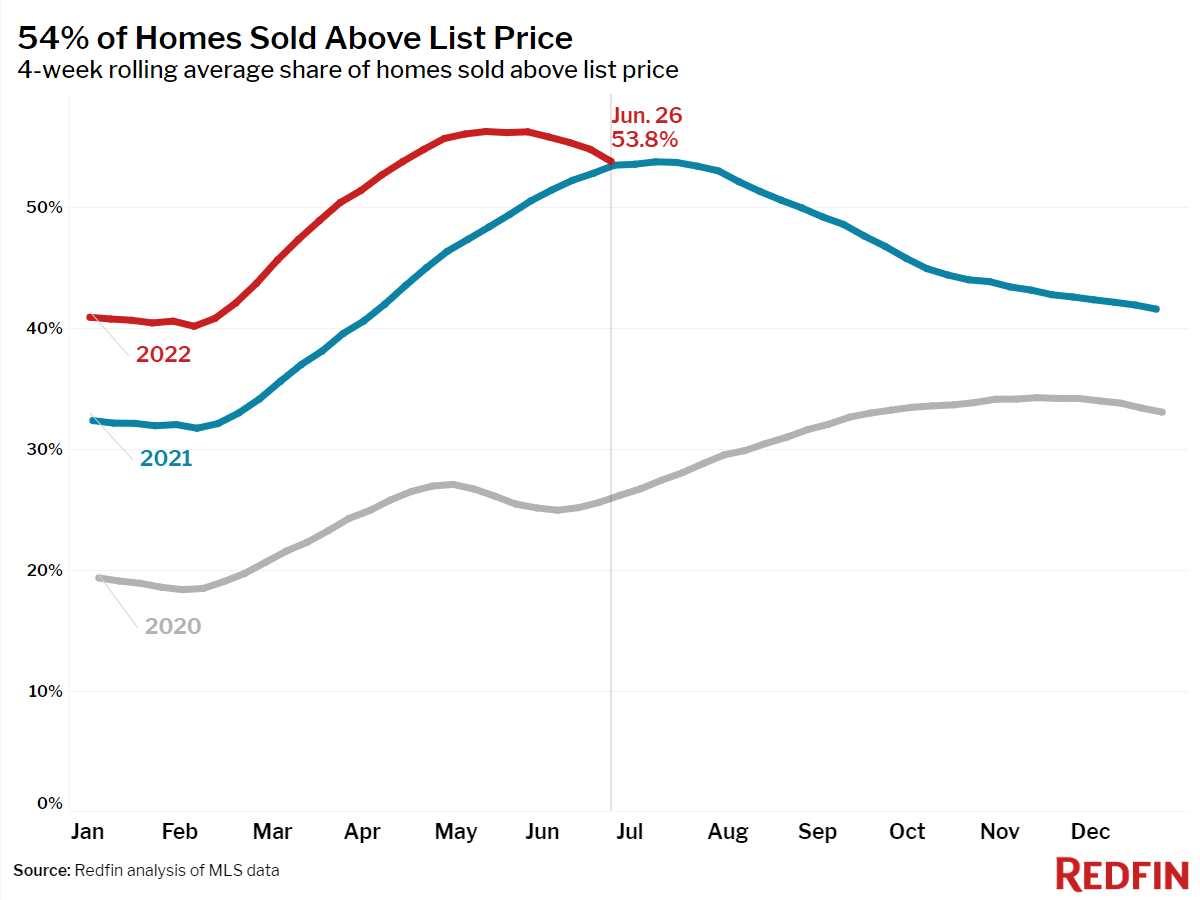
- 54% of homes sold above list price, up from 53% a year earlier. This measure peaked in mid-May and has declined 2.5 points since then. Last year it peaked in mid-July.
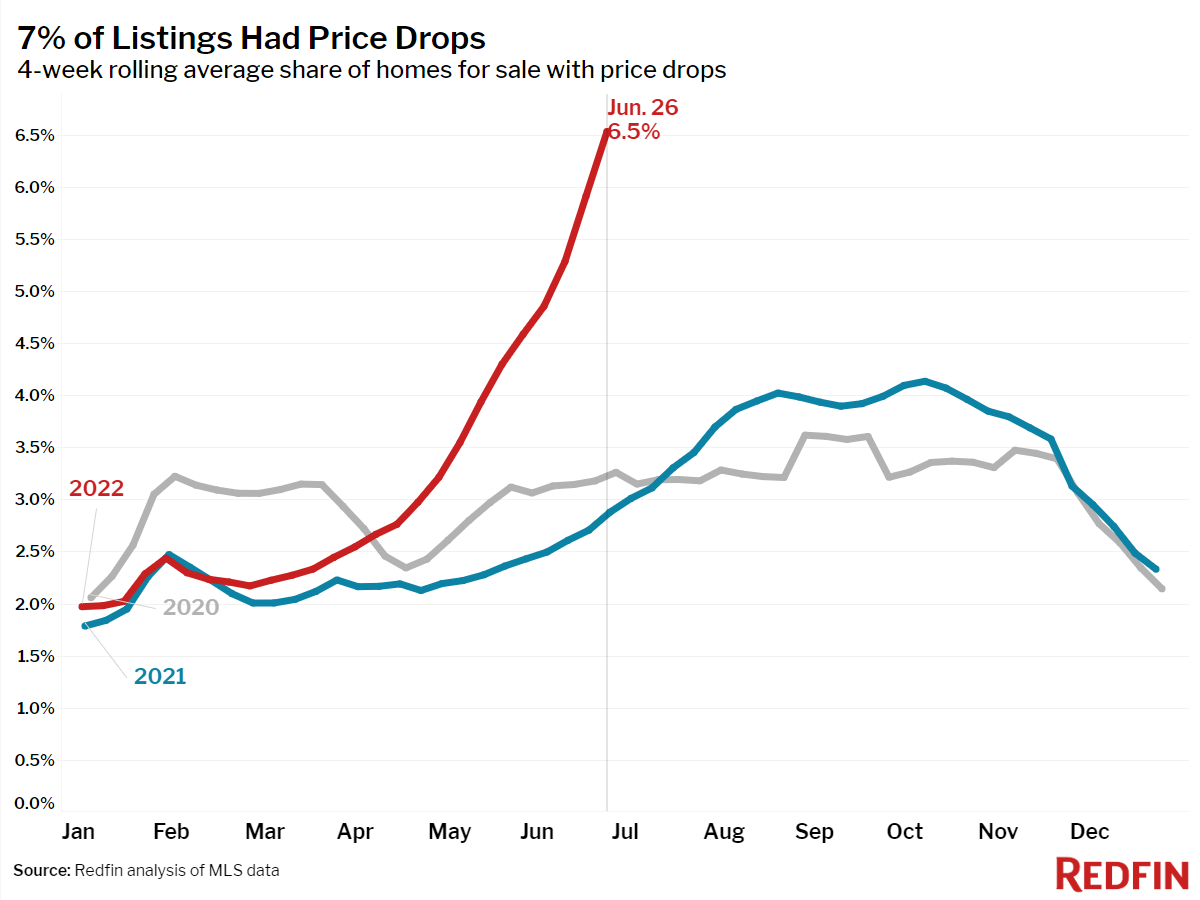
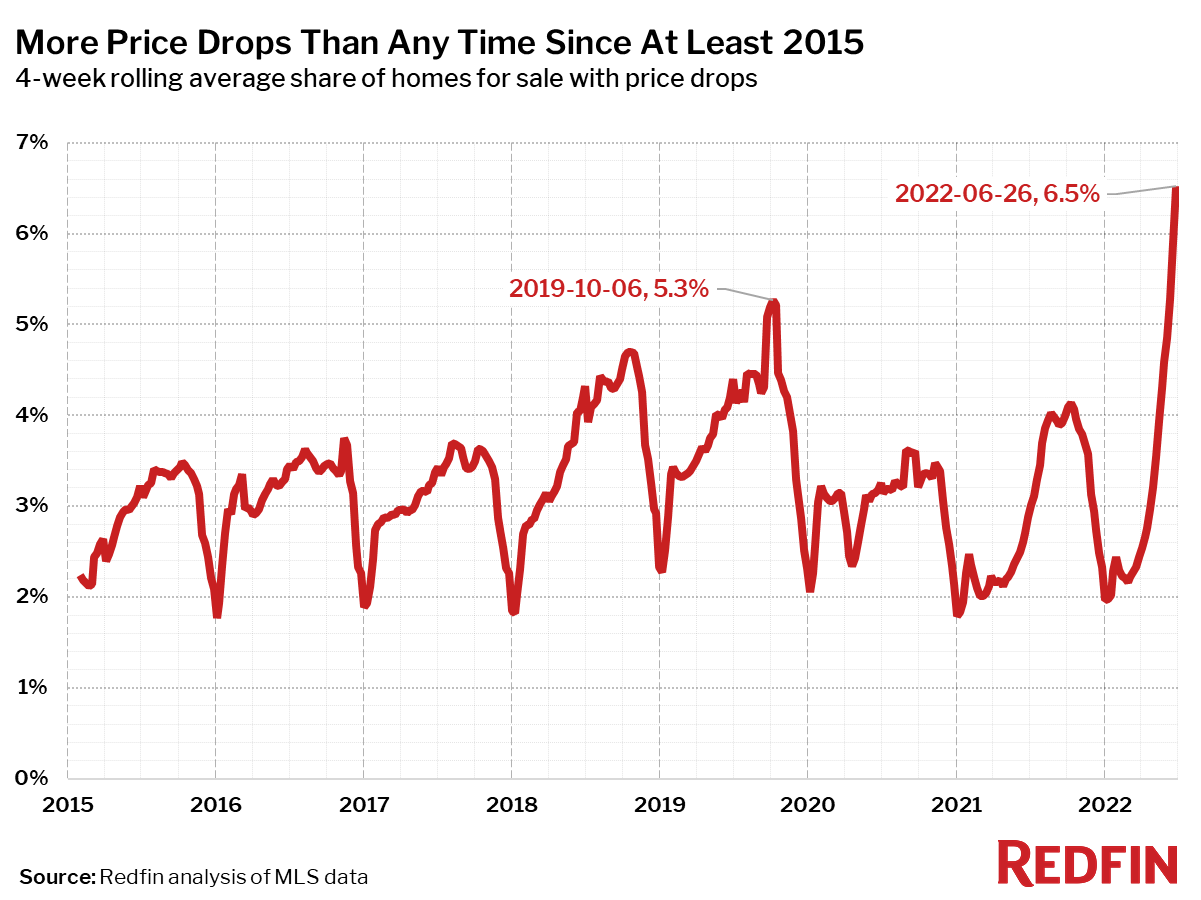
- On average, 6.5% of homes for sale each week had a price drop, a record high as far back as the data goes, through the beginning of 2015.
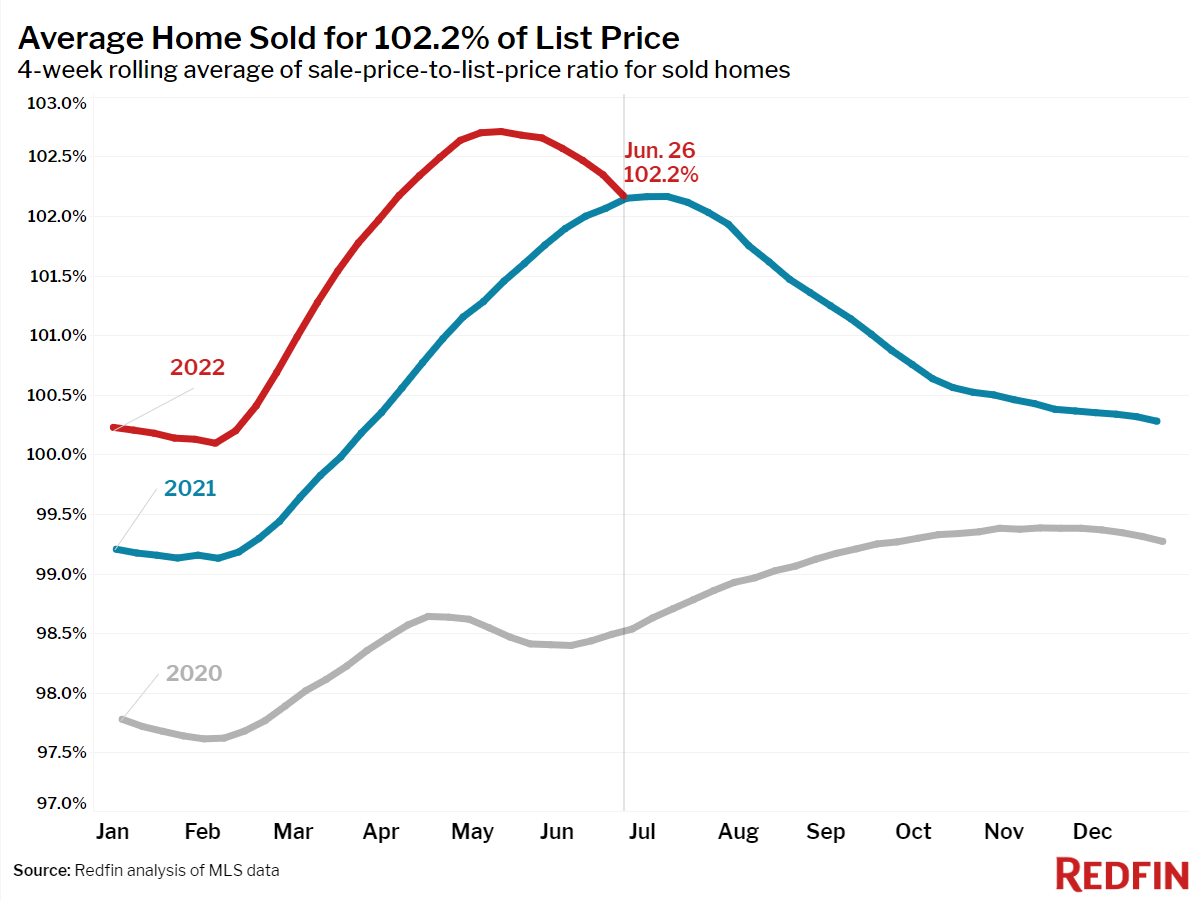
- The average sale-to-list price ratio, which measures how close homes are selling to their asking prices, declined to 102.2%. In other words, the average home sold for 2.2% above its asking price. This was up from 102.1% a year earlier.
Refer to our metrics definition page for explanations of all the metrics used in this report.