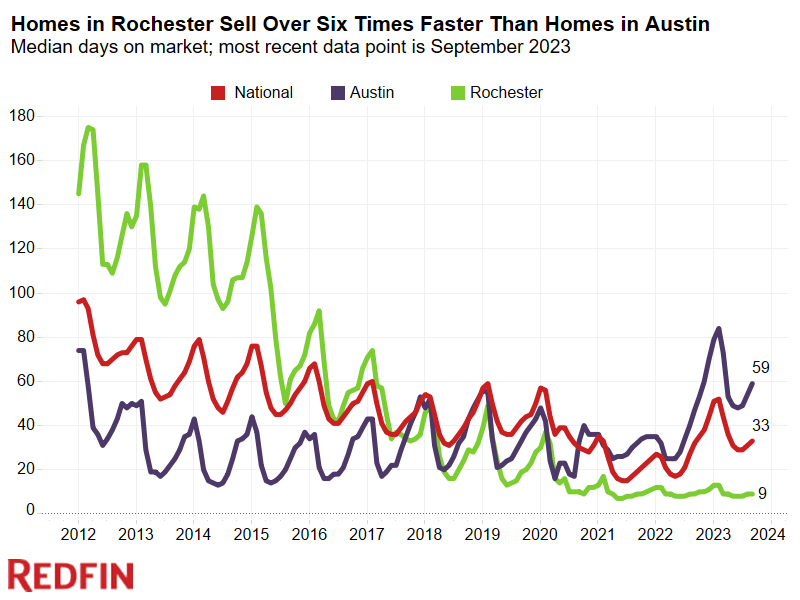
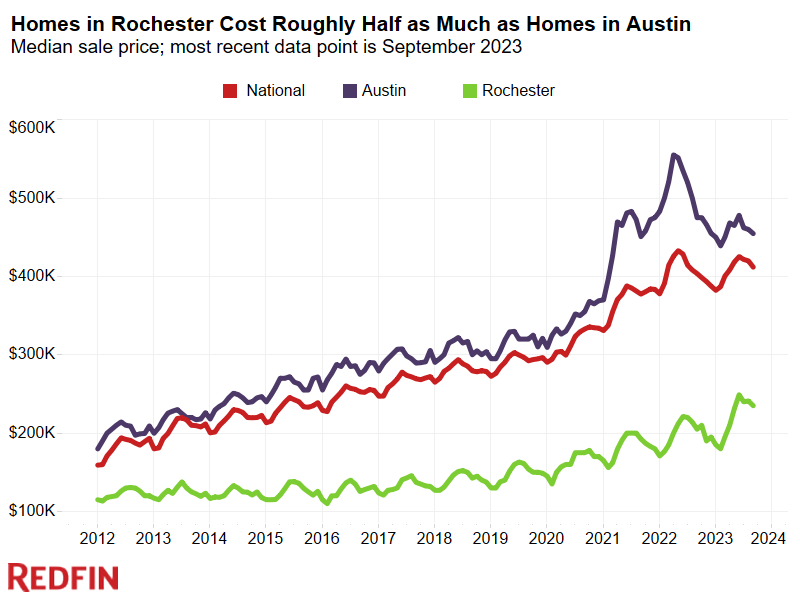
Albany, Rochester and Buffalo are among the nation’s fastest housing markets. Austin, once known for its speed, is one of the slowest.
In Albany, NY, the typical home that sold in September went under contract in just eight days, making it the fastest market in the country. Next came Rochester, NY (9), Grand Rapids, MI (9) Buffalo, NY (11), San Jose, CA (12) and Seattle (12).

Aside from Seattle and San Jose, all of the six fastest markets have median home sale prices well below the national level of $412,081—one reason homes in these metros are getting snatched up so quickly. The typical home that sold in Rochester last month went for $235,000, making it the 4th most affordable metro in the nation. Buffalo ranked 8th, with a median sale price of $255,000, and Albany and Grand Rapids ranked 21st and 24th, with median sale prices of $310,000 and $320,000, respectively. That’s based on a list of U.S. metropolitan areas with populations of at least 750,000.
Homes in affordable places have become more competitive as housing affordability has dwindled due to rising mortgage rates and still-high home prices. The average 30-year-fixed mortgage rate hit 8% last week for the first time in 23 years, sending the typical homebuyer’s monthly payment up significantly from a year ago.
“You might not think of Rochester as a hotspot, but people are still flocking into our area and supply remains very low,” said Kimberly Hogue, a local Redfin real estate agent. “Especially for someone coming with a big-city budget, paying $400,000 for a beautiful single-family home in a desirable neighborhood is a no brainer, and there just aren’t enough to go around. Even with mortgage rates near 8%, homes here are still affordable.”
The situation is a bit different in nearby Buffalo, according to local Redfin agent James Strzalkowski, who has observed signs that the market is beginning to slow.
“Buffalo was promoted for years as an affordable city with so much to offer, including cheaper labor, but our local economy is changing. Home prices and the general cost of living are catching up to other parts of the country,” he said. “We have a housing shortage in part because people can’t afford to move, but homes that are listed are starting to sit for longer and see price drops as mortgage rates rise and inflation impacts our city.”
In Austin, Homes Used to Fly Off the Shelves. Now It’s the Third Slowest Housing Market in the Country.
In New Orleans, the typical home that sold in September went under contract in 70 days, making it the slowest market in the country. Next came Honolulu (62), Austin, TX (59), West Palm Beach, FL (58), McAllen, TX (53) and Charleston, SC (53).
Homes in most of the aforementioned markets have historically taken longer to sell than the typical U.S. home. The outlier is Austin, where homes have historically sold faster. Austin exploded in popularity during the pandemic as scores of remote workers moved in from expensive coastal cities to take advantage of the area’s relatively affordable housing. In turn, home prices skyrocketed and many homebuyers were priced out.
Austin’s housing market has lost its edge in large part because it has become more expensive. The typical home that sold in September went for $450,000, or 9.2% more than the typical U.S. home. That gap has narrowed since home prices peaked last spring, when homes in Austin were selling for nearly 30% more than the typical U.S. home.

Metro-Level Summary: September 2023
| U.S. Metro Area | Median Days on Market | Year-Over-Year Change in Median Days on Market (in Days) | Median Home Sale Price |
|---|---|---|---|
| Albany, NY | 8 | -5 | $310,000 |
| Anaheim, CA | 33 | -9 | $1,090,000 |
| Atlanta, GA | 28 | 1 | $387,000 |
| Austin, TX | 59 | 12 | $450,000 |
| Bakersfield, CA | 28 | -6 | $341,250 |
| Baltimore, MD | 21 | -4 | $375,000 |
| Birmingham, AL | 47 | 3 | $277,950 |
| Boston, MA | 20 | -1 | $685,000 |
| Buffalo, NY | 11 | -1 | $255,000 |
| Camden, NJ | 20 | -4 | $325,000 |
| Cape Coral, FL | 43 | 19 | $385,000 |
| Charleston, SC | 53 | -1 | $425,000 |
| Charlotte, NC | 39 | 1 | $390,000 |
| Chicago, IL | 50 | -7 | $321,000 |
| Columbus, OH | 37 | -2 | $330,000 |
| Dallas, TX | 36 | 4 | $422,900 |
| Dayton, OH | 20 | -8 | $209,950 |
| Denver, CO | 20 | -1 | $580,000 |
| Detroit, MI | 16 | -5 | $183,165 |
| El Paso, TX | 34 | 1 | $254,475 |
| Fort Lauderdale, FL | 51 | 5 | $425,000 |
| Fort Worth, TX | 37 | 9 | $357,760 |
| Frederick, MD | 20 | -8 | $517,495 |
| Fresno, CA | 22 | 0 | $401,000 |
| Grand Rapids, MI | 9 | -1 | $320,000 |
| Greensboro, NC | 27 | 0 | $275,000 |
| Greenville, SC | 45 | 2 | $326,000 |
| Honolulu, HI | 62 | 10 | $727,444 |
| Houston, TX | 34 | 8 | $333,200 |
| Indianapolis, IN | 14 | 2 | $299,992 |
| Jacksonville, FL | 44 | 8 | $360,000 |
| Kansas City, MO | 23 | 3 | $312,750 |
| Knoxville, TN | 47 | -1 | $364,000 |
| Lake County, IL | 48 | -6 | $337,750 |
| Las Vegas, NV | 37 | -10 | $415,000 |
| Los Angeles, CA | 36 | -7 | $875,000 |
| Louisville, KY | 22 | 1 | $255,000 |
| McAllen, TX | 53 | 23 | $251,000 |
| Memphis, TN | 39 | 5 | $275,000 |
| Miami, FL | 51 | 0 | $510,000 |
| Milwaukee, WI | 39 | -7 | $305,000 |
| Minneapolis, MN | 21 | -1 | $375,000 |
| Montgomery County, PA | 17 | -4 | $435,000 |
| Nashville, TN | 50 | 11 | $440,000 |
| Nassau County, NY | 26 | -2 | $653,000 |
| New Brunswick, NJ | 24 | -19 | $510,000 |
| New Orleans, LA | 70 | 42 | $278,985 |
| New York, NY | 52 | 2 | $695,000 |
| Newark, NJ | 25 | -6 | $525,000 |
| North Port, FL | 42 | 18 | $442,831 |
| Oakland, CA | 14 | -10 | $930,000 |
| Oklahoma City, OK | 17 | 4 | $248,000 |
| Omaha, NE | 13 | 2 | $300,000 |
| Orlando, FL | 26 | 5 | $395,000 |
| Oxnard, CA | 37 | -10 | $840,000 |
| Philadelphia, PA | 38 | -3 | $270,000 |
| Phoenix, AZ | 40 | -5 | $442,000 |
| Pittsburgh, PA | 49 | -3 | $225,000 |
| Portland, OR | 21 | -1 | $545,000 |
| Providence, RI | 23 | -4 | $450,000 |
| Raleigh, NC | 37 | 0 | $435,000 |
| Richmond, VA | 13 | -2 | $370,000 |
| Riverside, CA | 36 | -7 | $545,000 |
| Rochester, NY | 9 | 0 | $235,000 |
| Sacramento, CA | 16 | -13 | $575,000 |
| Salt Lake City, UT | 34 | 1 | $506,250 |
| San Antonio, TX | 50 | 17 | $318,075 |
| San Diego, CA | 16 | -12 | $867,500 |
| San Francisco, CA | 24 | -5 | $1,450,000 |
| San Jose, CA | 12 | -16 | $1,487,000 |
| Seattle, WA | 12 | -9 | $769,990 |
| St. Louis, MO | 18 | -3 | $255,000 |
| Stockton, CA | 15 | -15 | $540,000 |
| Tacoma, WA | 15 | -11 | $533,900 |
| Tampa, FL | 25 | 5 | $380,000 |
| Tucson, AZ | 46 | -2 | $360,000 |
| Tulsa, OK | 18 | 4 | $260,000 |
| Virginia Beach, VA | 21 | -4 | $333,950 |
| Warren, MI | 17 | -5 | $296,000 |
| Washington, D.C. | 30 | -6 | $520,000 |
| West Palm Beach, FL | 58 | 8 | $470,000 |
| Worcester, MA | 19 | -3 | $433,000 |
| National—U.S.A. | 33 | 1 | $412,081 |
Editor’s note: A previous version of this report stated that Austin was the second slowest housing market. It is the third slowest. The report has been updated.

 United States
 Canada