
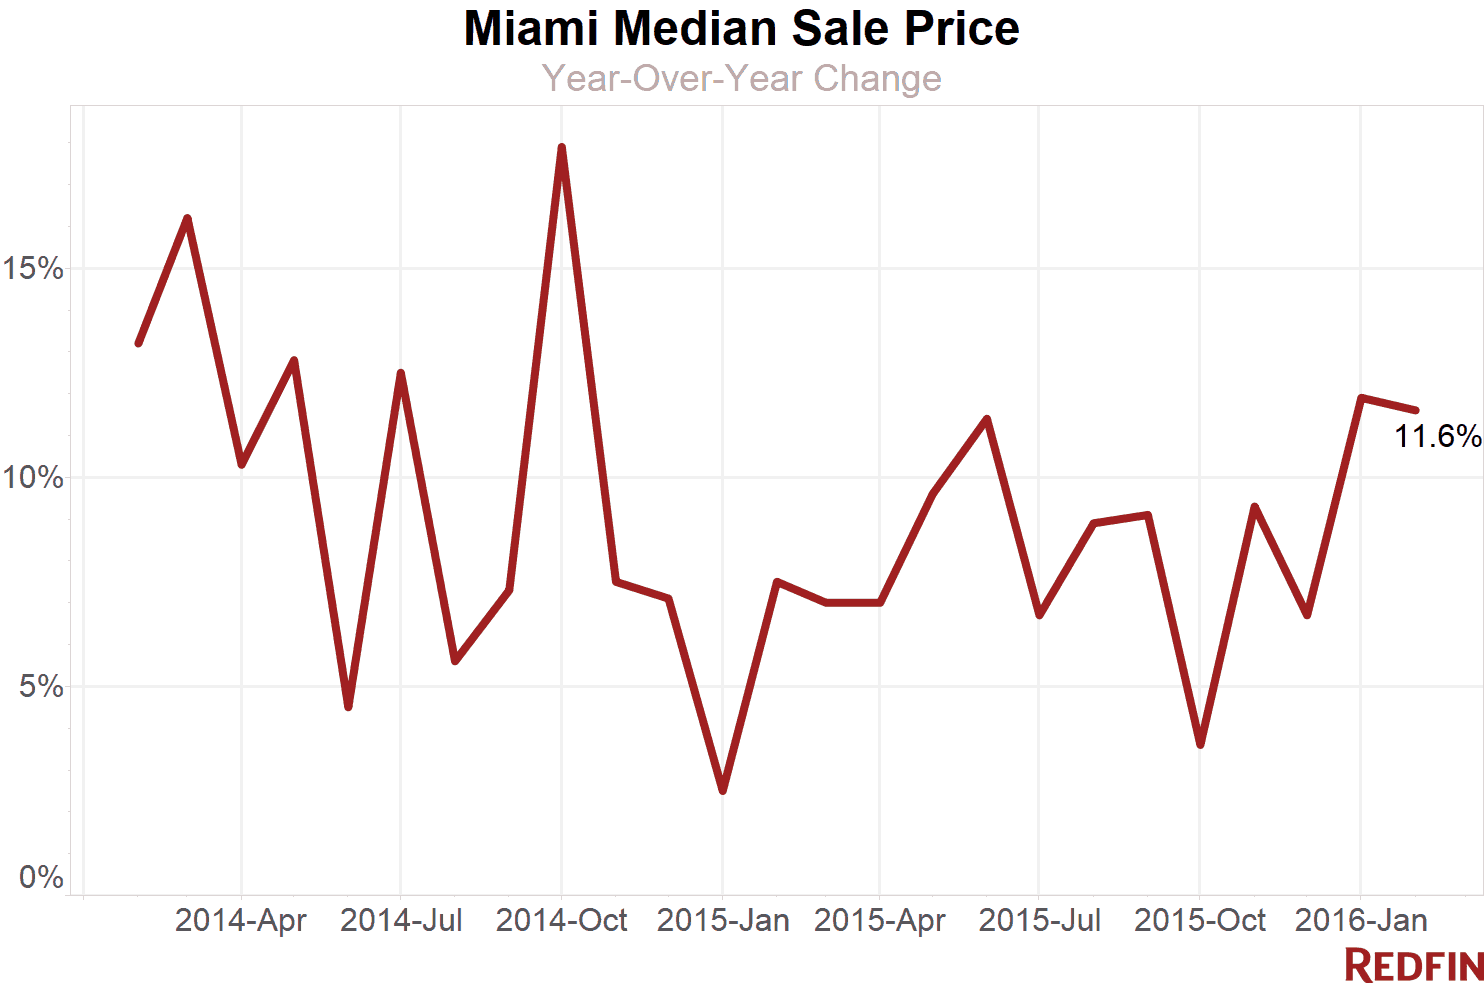
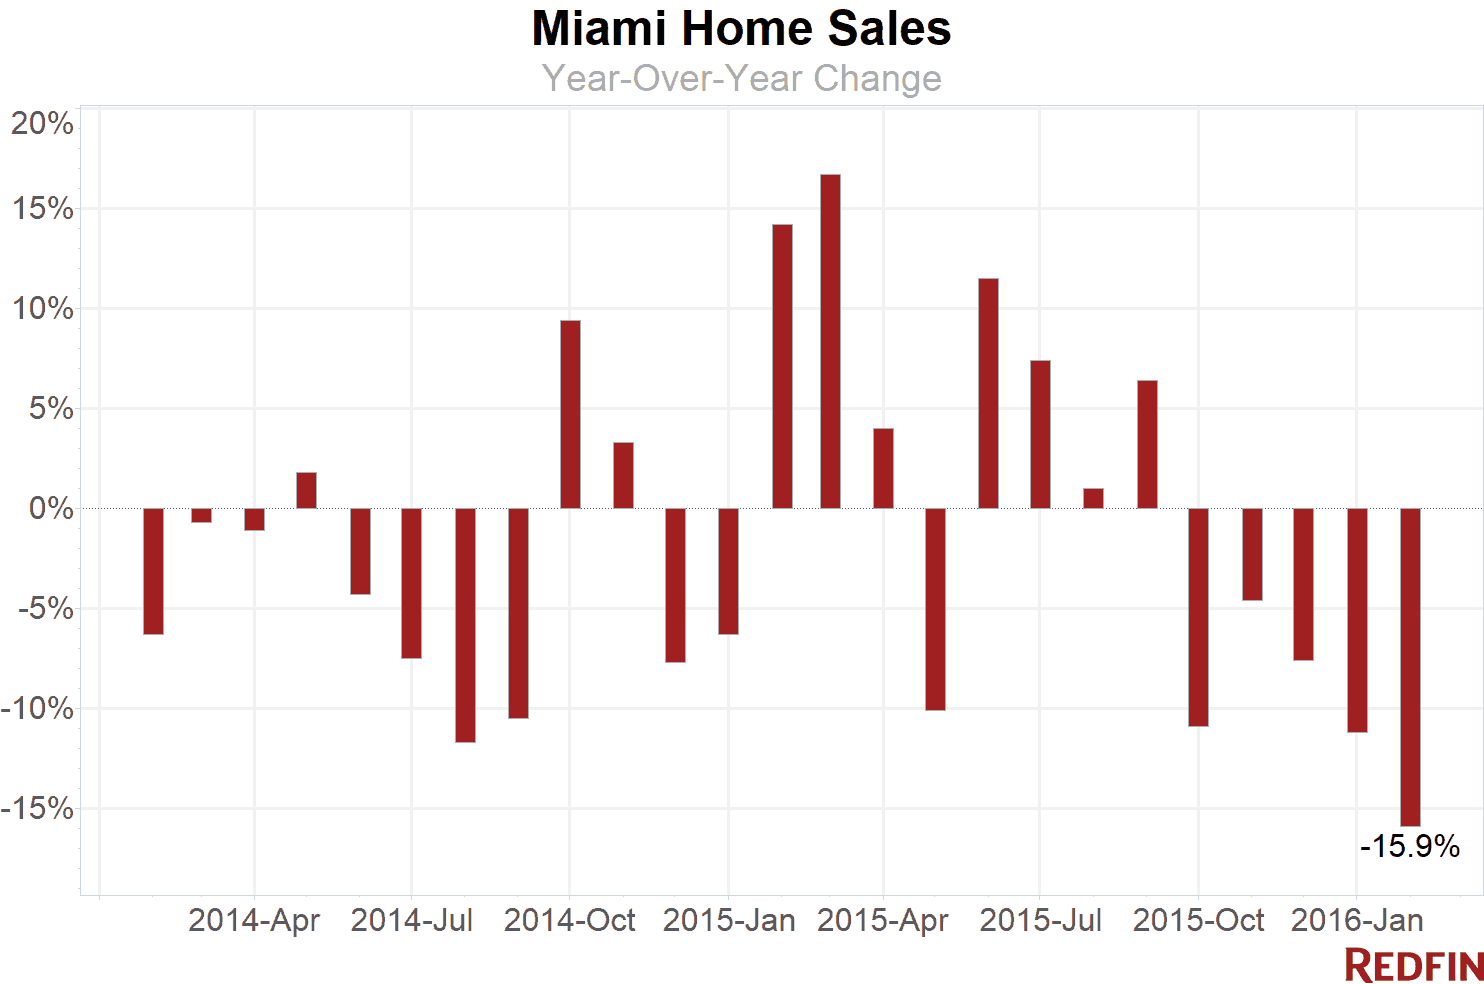
Miami home prices rose 11.6 percent in February from a year earlier, to a median $240,000. Sales plummeted 15.9 percent from a year ago, the biggest drop in at least four years.
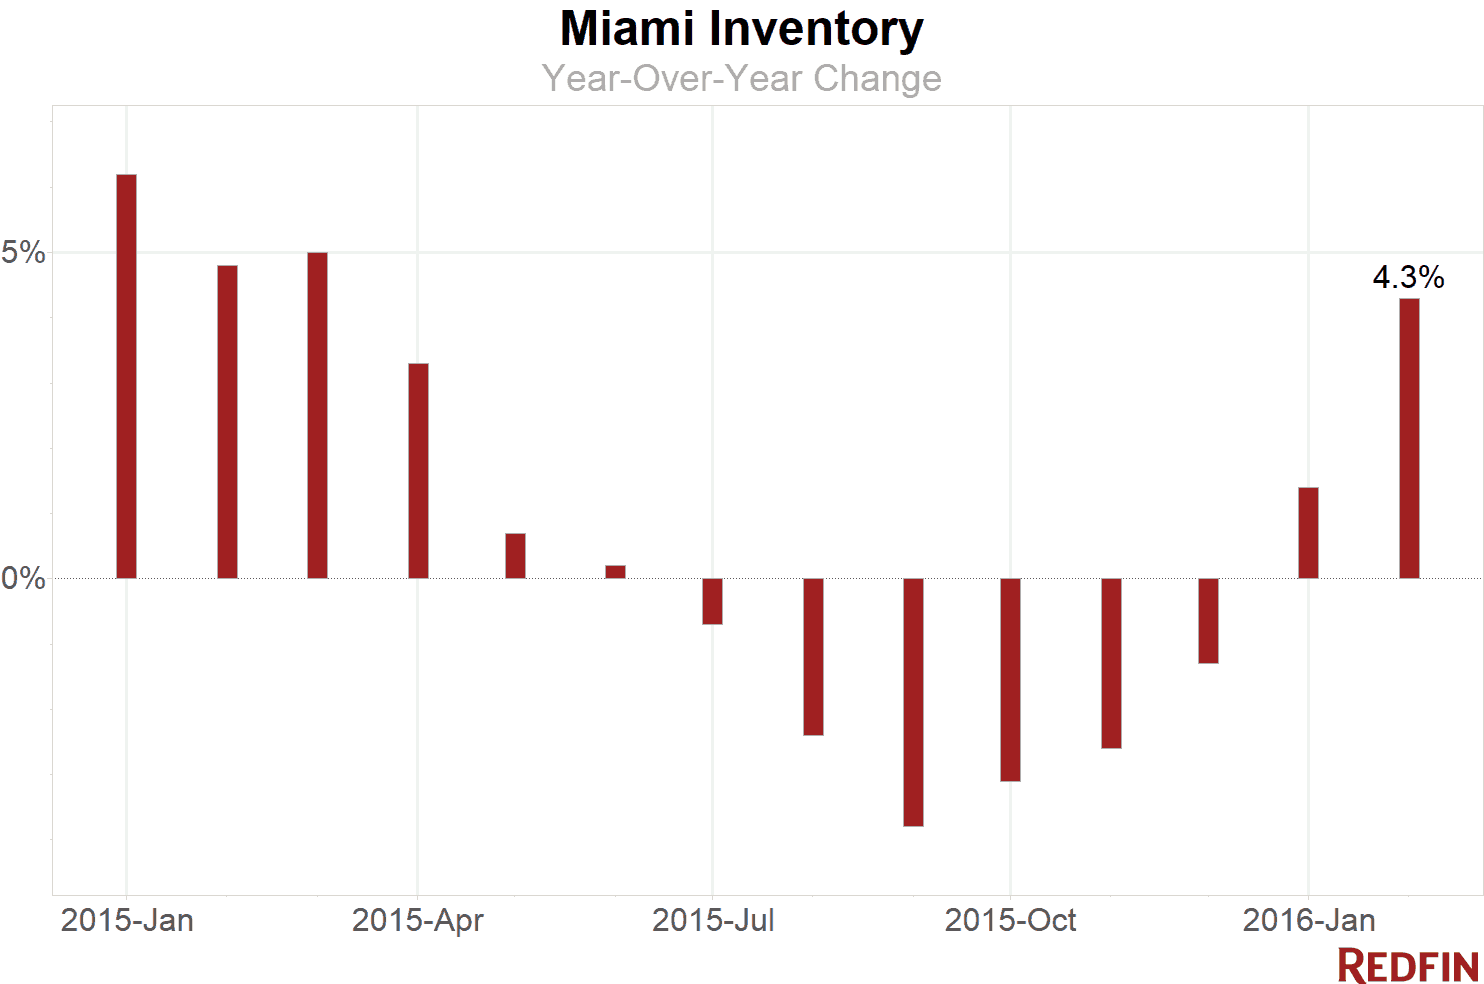
Meanwhile, condos are flooding the market as developers put hundreds of newly constructed beachfront units up for sale, leading to a 12 percent jump in new listings.
The influx of luxury condos has driven an increase in the total stockpile of homes on the market. In February, the Miami area had an eight-month supply of homes for sale, the most in at least two years and well above the six months that signals a balance between buyers and sellers.
Disruptions in the high-end condo market also have contributed to a slowdown in Miami sales that has dragged on since October. Wealthy investors and foreign buyers, buffeted by stock market volatility and low oil prices since late last year, have been pulling back on real estate purchases.
Miami’s local market for single-family homes is a different story. Activity in that segment is strong as buyers compete for houses and mom-and-pop rehabbers seek to profit by fixing up foreclosures. Redfin agents estimate that single-family houses sell about three times more quickly than luxury condos, and price growth is steady.
“When buyers see a house listed at $500,000 that sold three years ago for $350,000, they wonder, ‘Wow, is it really worth it?’” Redfin agent Aaron Drucker said. “Most times, though, buyers move past the initial sticker shock and end up purchasing because they realize prices are continuing to rise and if they buy now they can lock in a low interest rate.”
Throughout Miami, homes found buyers 11 days faster in February than they did a year prior, but they still spent an average of 52 days on the market.
Hot Neighborhoods
Little Haiti remained competitive for buyers, with a median sale price of $194,562, up 64 percent year over year. In North Shore, prices dropped 22 percent to $252,375.
In the Upper Eastside neighborhood, the number of homes for sale nearly doubled over last year. Despite the cascade of new listings, sales dropped 48 percent year over year, indicating that buyers aren’t biting on the new surge in inventory. Wynwood-Edgewater also saw a big bump in new listings.
Little Havana posted one of the area’s lowest median prices at $122,500, down 5 percent from a year ago. South Point posted one of the highest median sale prices at $876,250, up 17 percent.
| Neighborhood | Median Sale Price | Year-Over-Year | Homes Sold | Year-Over-Year | Inventory | Year-Over-Year | New Listings | Median Days on Market | Avg Sale-to-List |
|---|---|---|---|---|---|---|---|---|---|
| Andover | $210,000 | 80.6% | 2 | 0.0% | NA | NA | NA | 12 | 101.5% |
| Aventura | $336,000 | 8.4% | 53 | -27.4% | 358 | 36.6% | 276 | 66 | 93.7% |
| Bay Point | $2,175,000 | 35.9% | 6 | -33.3% | 24 | 118.2% | 14 | 44 | 94.9% |
| Bayshore | $934,500 | 8.3% | 18 | -35.7% | 115 | 35.3% | 89 | 56 | 91.9% |
| Biscayne Point | $875,000 | 34.6% | 14 | -46.2% | 40 | 17.6% | 29 | 70 | 93.4% |
| Brentwood | $105,000 | -16.0% | 3 | 0.0% | 2 | 0.0% | 3 | 3 | 104.4% |
| Brickell | $390,000 | 0.0% | 186 | -12.3% | 1,143 | 22.9% | 781 | 94 | 95.2% |
| Coral Way | $350,000 | 13.6% | 154 | 2.0% | 345 | -0.3% | 306 | 52 | 95.8% |
| Downtown | $377,000 | -8.0% | 116 | -2.5% | 677 | 24.0% | 450 | 119 | 94.0% |
| Eastern Shores | $216,250 | 35.2% | 20 | -37.5% | 103 | 8.4% | 86 | 88 | 93.9% |
| Flamingo-Lummus | $230,000 | 9.5% | 112 | 25.8% | 384 | 9.1% | 305 | 91 | 94.3% |
| Hialeah | $190,000 | 21.0% | 97 | -18.5% | 112 | -29.6% | 179 | 34 | 98.1% |
| Highland Village | $92,878 | 33.6% | 2 | 100.0% | 1 | 0.0% | 3 | 10 | 105.0% |
| Keystone Point | $1,050,000 | 50.2% | 16 | 6.7% | 37 | 42.3% | 30 | 78 | 97.1% |
| La Gorce | $1,575,000 | -9.2% | 14 | -12.5% | 80 | 60.0% | 57 | 86 | 91.7% |
| Lakewood Estates | $196,000 | 88.5% | 4 | 300.0% | NA | NA | NA | 19 | 99.0% |
| Little Haiti | $194,562 | 63.5% | 39 | -26.4% | 89 | -1.1% | 98 | 33 | 98.6% |
| Little Havana | $122,500 | -5.0% | 30 | -36.2% | 84 | -9.7% | 87 | 34 | 94.9% |
| Miami Lakes | $351,500 | 21.2% | 36 | -2.7% | 75 | -24.2% | 86 | 35 | 96.7% |
| Miami Shores | $161,000 | -1.8% | 4 | -42.9% | 11 | -26.7% | 13 | 108 | 93.5% |
| New Belle Meade | $278,000 | -41.5% | 11 | -42.1% | 45 | 73.1% | 40 | 58 | 95.8% |
| Normandy Isle | $178,000 | 14.8% | 19 | -29.6% | 69 | 19.0% | 68 | 52 | 95.1% |
| North Shore | $252,375 | -22.3% | 66 | -26.7% | 261 | 22.0% | 210 | 69 | 96.5% |
| Northeast Coconut Grove | $612,000 | 21.2% | 69 | -21.6% | 174 | 0.6% | 162 | 61 | 95.2% |
| Overtown | $167,450 | 90.3% | 8 | -11.1% | 13 | 18.2% | 18 | 56 | 88.4% |
| South Miami | $1,080,000 | 57.4% | 12 | -14.3% | 33 | 73.7% | 27 | 152 | 96.3% |
| South Point | $876,250 | 16.8% | 62 | -1.6% | 271 | 60.4% | 202 | 82 | 93.6% |
| Southwest Coconut Grove | $960,000 | 39.1% | 27 | -28.9% | 120 | 42.9% | 90 | 75 | 93.2% |
| The Roads | $307,000 | -26.5% | 12 | -25.0% | 42 | -16.0% | 51 | 90 | 94.5% |
| Upper Eastside | $306,000 | -18.9% | 43 | -47.6% | 187 | 96.8% | 159 | 50 | 94.6% |
| Venetian Islands | $817,500 | 22.9% | 18 | -48.6% | 92 | 46.0% | 52 | 56 | 93.0% |
| West Avenue | $359,500 | 9.8% | 58 | -15.9% | 286 | 33.0% | 228 | 80 | 94.5% |
| West Flagler | $244,950 | 10.1% | 64 | 4.9% | 103 | -20.8% | 119 | 46 | 94.9% |
| Wynwood-Edgewater | $325,000 | -7.1% | 77 | -31.9% | 502 | 55.9% | 387 | 98 | 95.2% |
| Miami, FL | $240,000 | 11.6% | 2,020 | -15.9% | 16,000 | 4.3% | 5,663 | 52 | 96.4% |
NOTE: Not all neighborhoods are listed, but table totals encompass entire Miami market.
METHODOLOGY: Data is based on listing information and might not reflect all real estate activity in the market. Neighborhood-specific data is measured over a three-month span that ended Feb. 29. Miami data includes the cities of Miami Beach, Miami Gardens, Miami Lakes, Miami Shores, Miami Springs, Fisher Island, West Miami, El Portal, Biscayne Park, North Miami, North Miami Beach, South Miami, Aventura, Bal Harbour, Bay Harbor Islands, Coral Gables, Hialeah, Kendall, Pinecrest, Doral, Key Biscayne, North Bay Village, Palmetto Bay, Sunny Isles Beach, Homestead, Cutler Bay and Sweetwater.
For more information, contact Redfin journalist services:
Phone: 206-588-6863
Email: press@redfin.com
See Redfin’s data center to find out what’s happening in other cities.
To be added to Redfin’s press release distribution list, please click here.


