
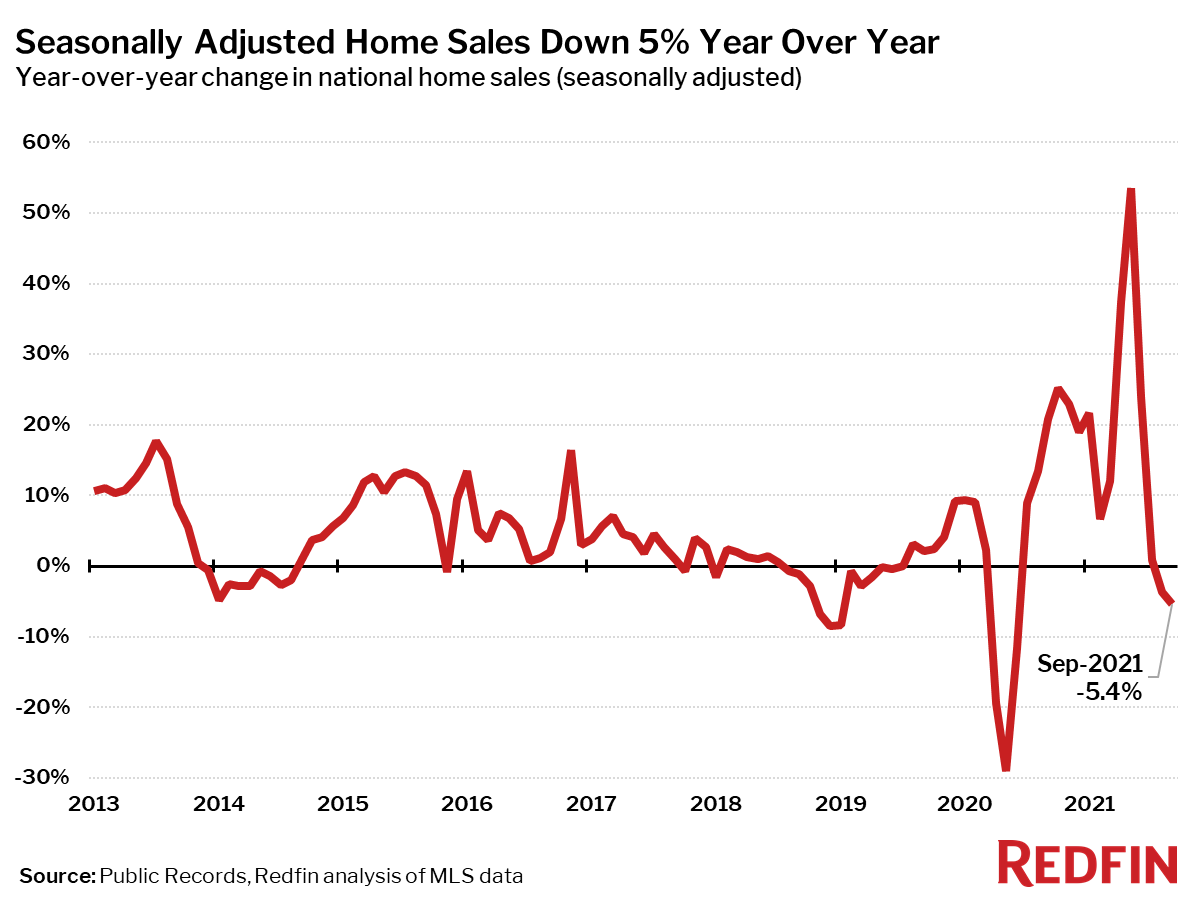
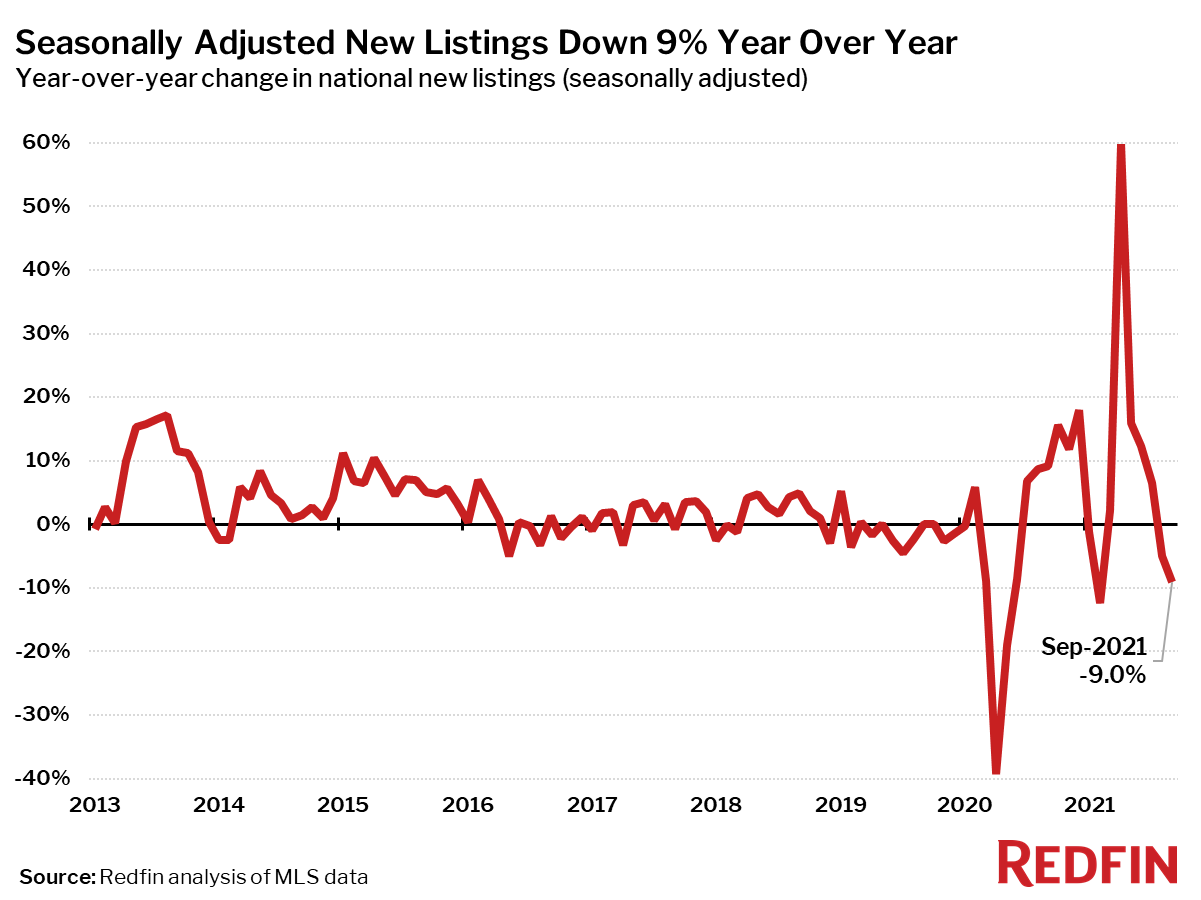
New listings of homes for sale fell 9% from a year earlier and closed home sales were down 5%.
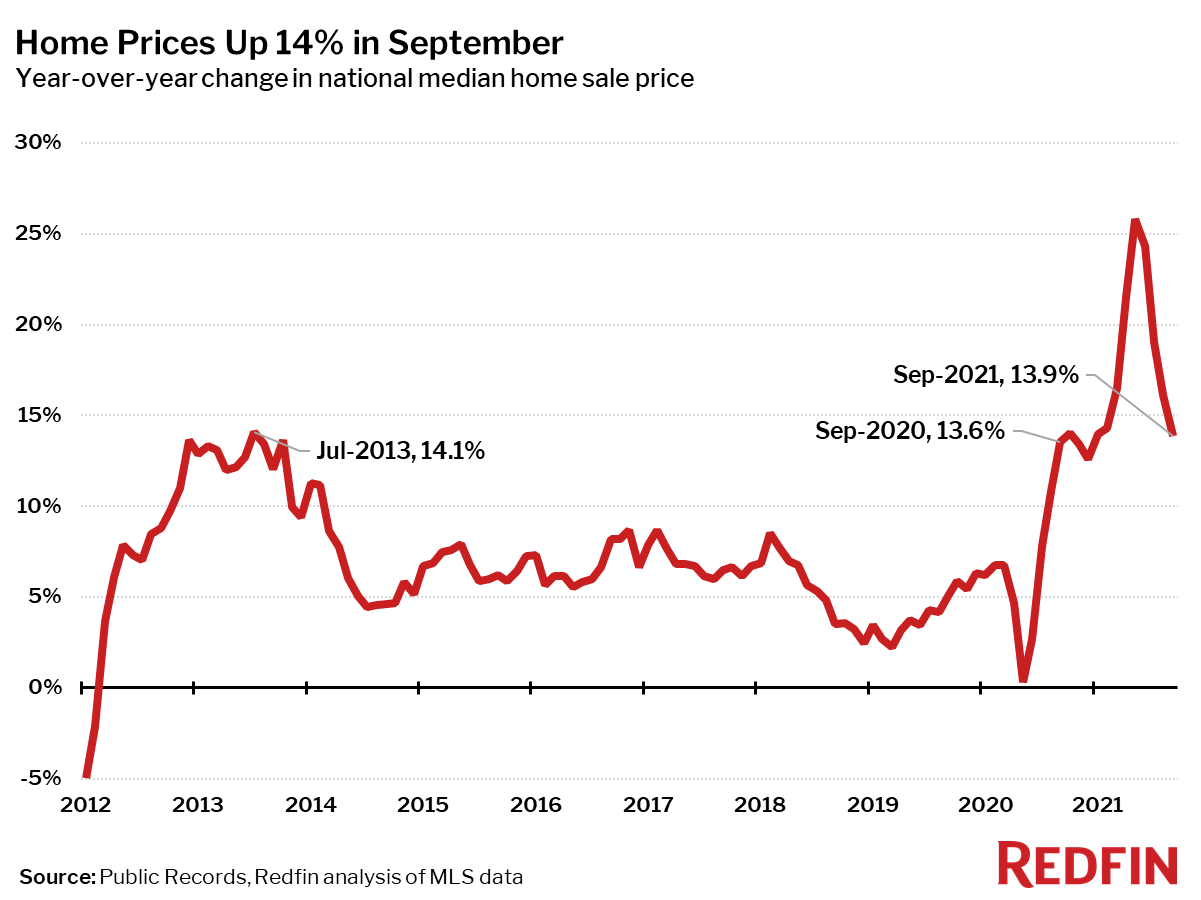
The median price of homes sold in September was $376,800, up 14% from a year earlier, the lowest growth rate since December 2020. September marked the 14th consecutive month of double-digit price gains. Closed home sales and new listings of homes for sale both fell from a year earlier, by 5% and 9% respectively.
“The severe lack of inventory is restricting home sales, said Redfin Chief Economist Daryl Fairweather. “Even though plenty of people bought homes last year, many homebuyers waited while the pandemic went from bad to worse and remote-work policies were finalized. The homebuyers who are just beginning their search are finding that the well has run dry. But I am hopeful that as it becomes easier to get building materials, we will finally have a strong year for new construction in 2022. That’s what the market needs more than anything.”
| Market Summary | September 2021 | Month-Over-Month | Year-Over-Year |
|---|---|---|---|
| Median sale price | $376,800 | -0.8% | 13.9% |
| Homes sold, seasonally-adjusted | 613,200 | 1.6% | -5.4% |
| Pending sales, seasonally-adjusted | 604,900 | 2.9% | 2.8% |
| New listings, seasonally-adjusted | 631,800 | -2.3% | -9.0% |
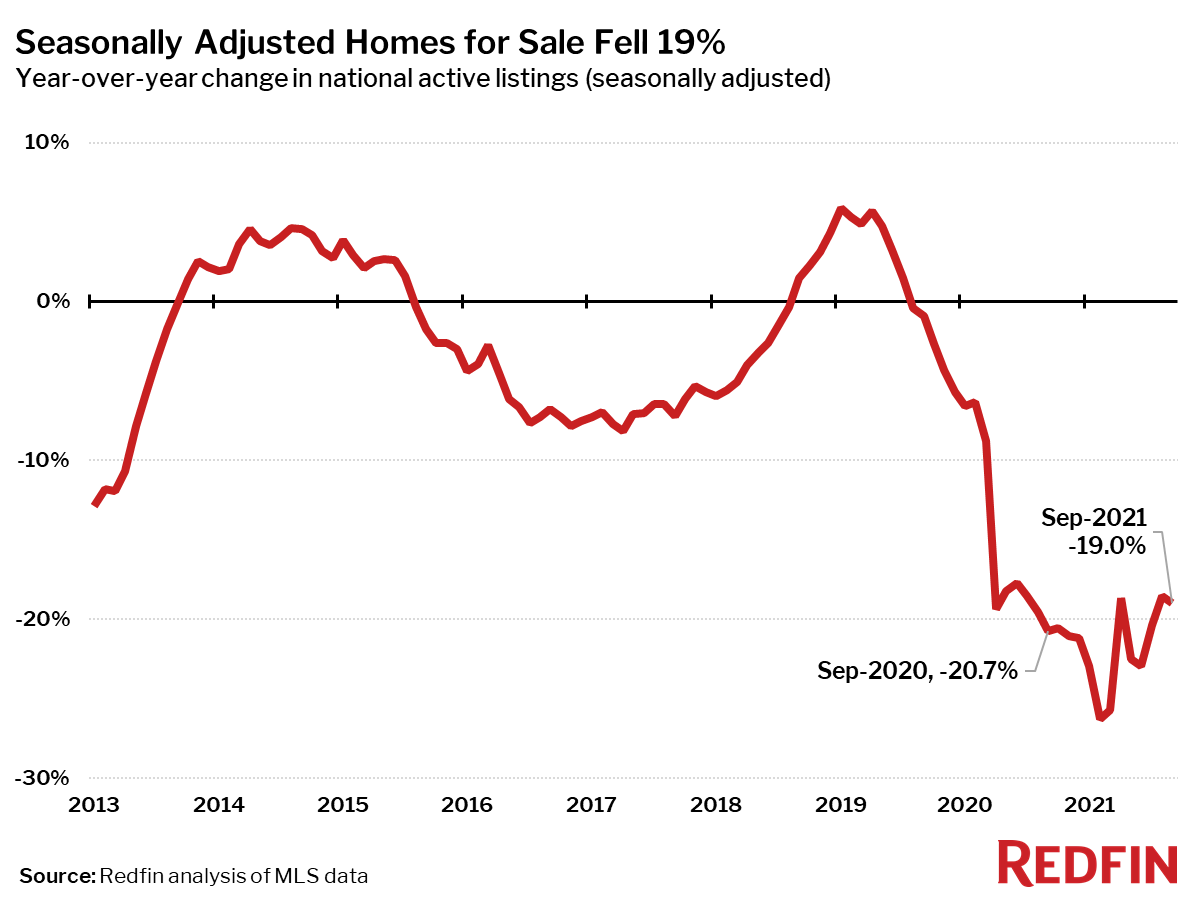
| All Homes for sale, seasonally-adjusted | 1,384,200 | -2.0% | -19.0% |
| Median days on market | 18 | 2 | -11 |
| Months of supply | 1.4 | 0 | -0.3 |
| Sold above list | 47.8% | -4.1 pts† | 13.8 pts† |
| Median Off-Market Redfin Estimate | $381,900 | 7.3% | 19.9% |
| Average Sale-to-list | 101.0% | -0.6 pts† | 1.6 pts† |
| Average 30-year fixed mortgage rate | 2.90% | +0.06 pts† | +0.01 pts† |
Median sale prices increased from a year earlier in all but one of the 85 largest metro areas Redfin tracks: Bridgeport, CT, where prices were down 2.2%. A year ago prices were up 32% in Bridgeport as the area experienced a sudden flood of interest from homebuyers looking to leave New York. The current price decline is likely a cooling from an extremely overheated state.
The largest price increases in September 2021 were in North Port, FL (+30%), Salt Lake City (+28%) and Austin, TX (+27%).
Seasonally-adjusted home sales in September were down 5% from a year earlier, the second annual decline in 16 months. Home sales fell in 66 of the 85 largest metro areas Redfin tracks. The biggest sales declines were seen in New Orleans (-42%), Bridgeport, CT (-24%) and Salt Lake City (-23%). The largest gains were in places where sales were still somewhat depressed in September 2020, including New York (+26%), Honolulu (+24%), and San Jose, CA (+15%).
Seasonally adjusted active listings—the count of all homes that were for sale at any time during the month—fell 19% year over year in September, on par with the previous month.
Only three of the 85 largest metros tracked by Redfin posted a year-over-year increase in the number of seasonally adjusted active listings of homes for sale: Austin, TX (+3%), Tacoma, WA (+3%) and Columbus, OH (+0.3%). The biggest year-over-year declines in active housing supply in September were in Baton Rouge, LA (-53%), Salt Lake City (-50%) and Rochester, NY (-47%).
Seasonally adjusted new listings of homes for sale were down 9% in September from a year earlier, only the second decline since February. New listings fell from a year ago in 75 of the 85 largest metro areas. The biggest declines were in Baton Rouge (-59%), Allentown, PA (-57%) and Salt Lake City, UT (-51%). New listings rose the most from a year ago in Austin, TX (+18%), Tacoma, WA (+9%) and Portland, OR (+8%).
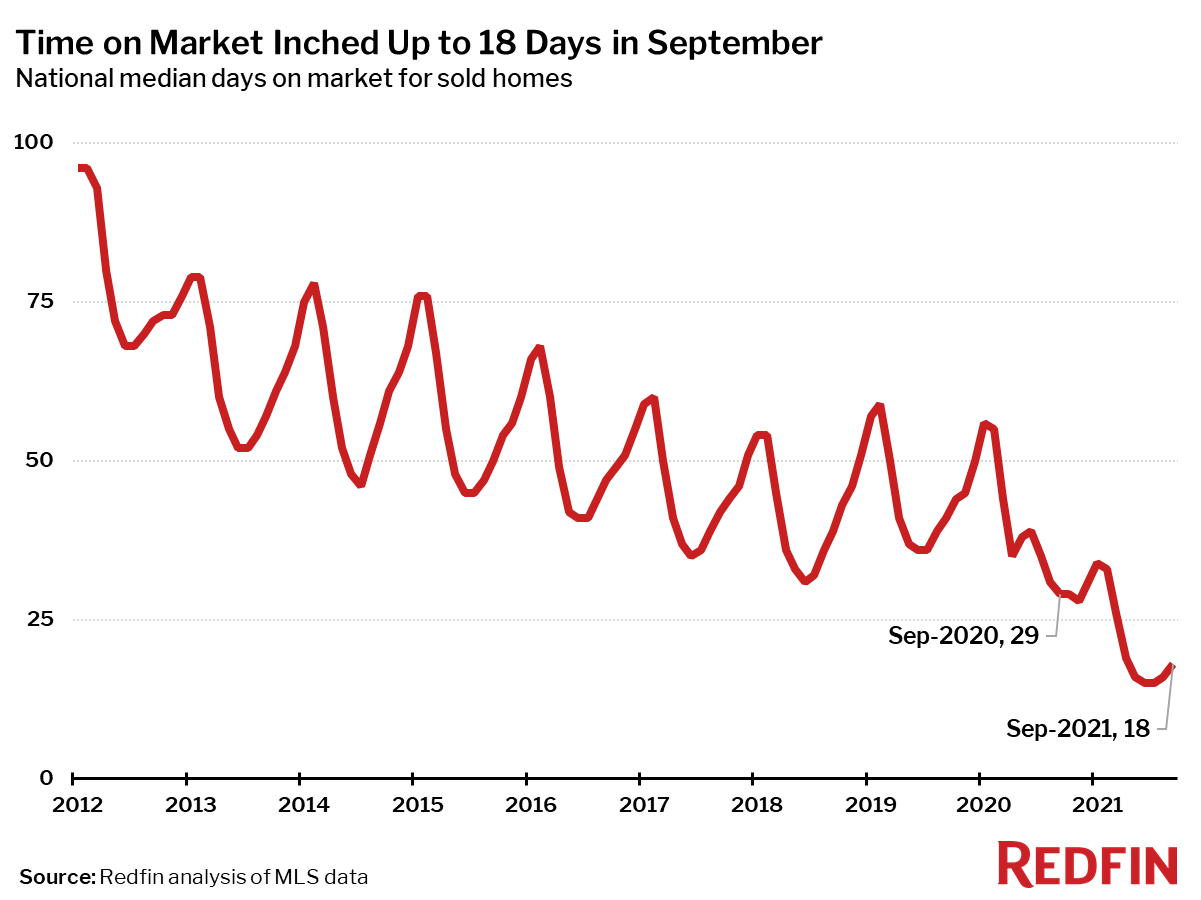
Measures of housing market competition based on completed home sales eased further in September.
The typical home that sold in September went under contract in 18 days—more than a week faster than a year earlier, when homes sold in a median 29 days, but up three days from the record low in June.
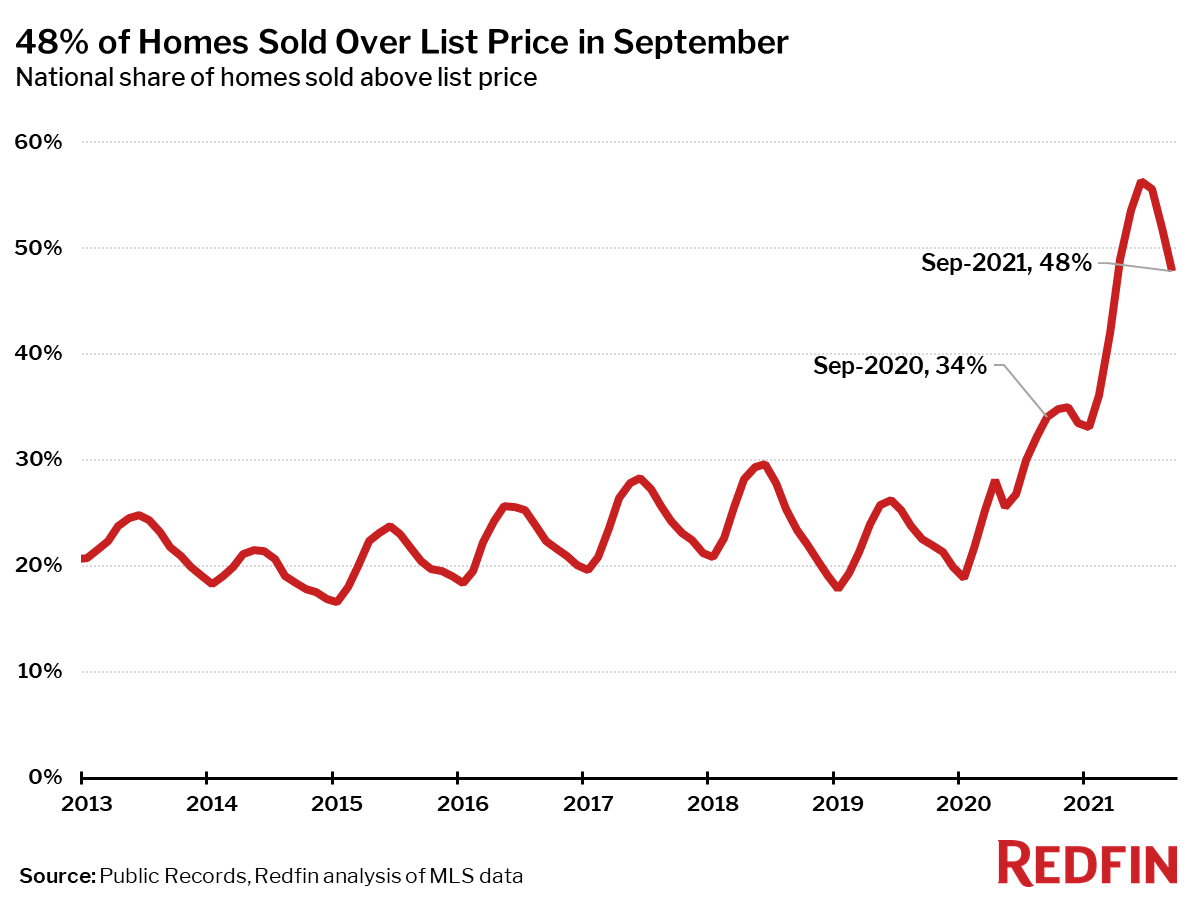
In September, 48% of homes sold above list price, down 8 percentage points from the record high in June, but up 14 percentage points from a year earlier.
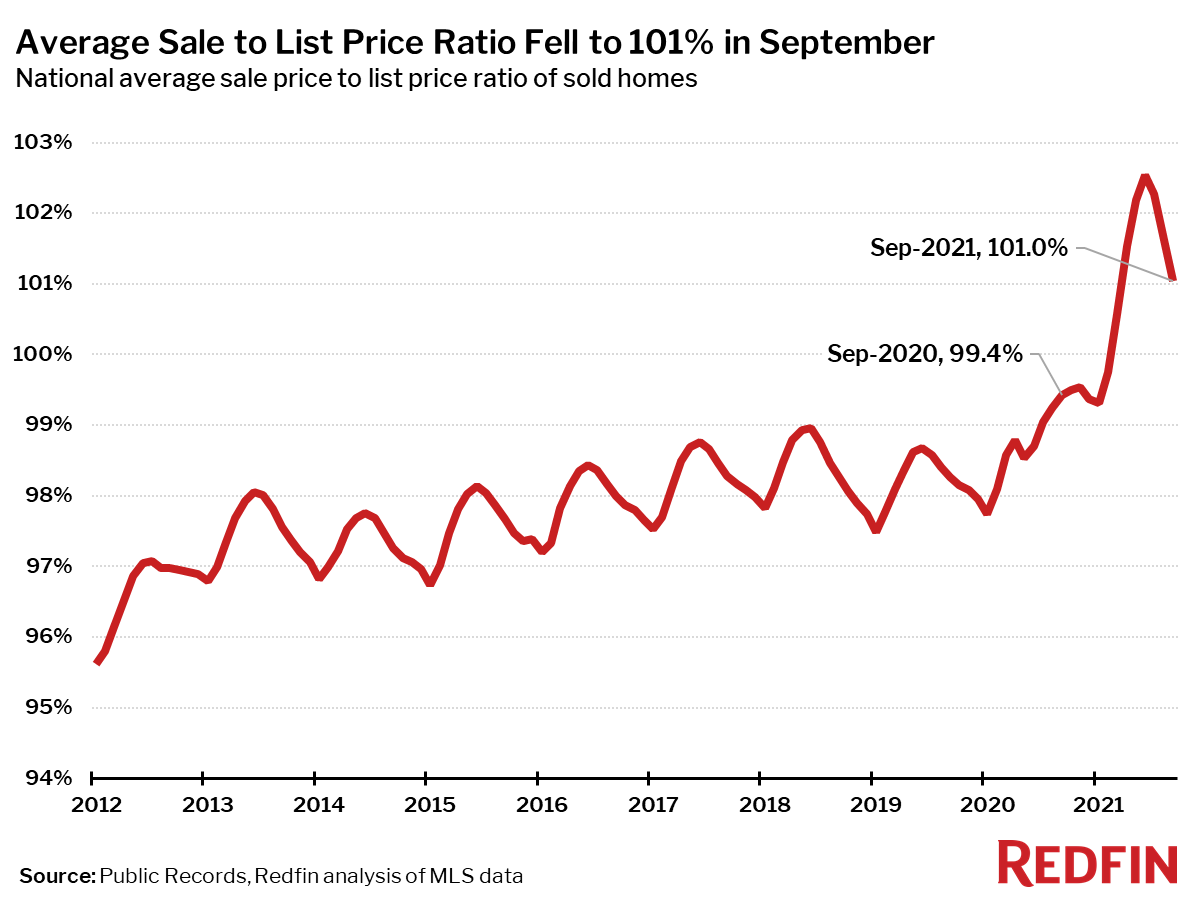
The average sale-to-list price ratio also dipped slightly in September to 101%, down from a record high of 102.5% in June but up from 99.4% a year earlier.
Other September Highlights
Competition
- Indianapolis was the fastest market, with half of all homes pending sale in just 5 days, down from 7 days a year earlier. Denver was the next fastest market, with 6 median days on market, followed by Grand Rapids, MI, Seattle and Tacoma, WA all with 7 days on market.
- The most competitive market in September was Oakland, CA where 77.6% of homes sold above list price, followed by 75.5% in San Jose, CA, 71.4% in San Francisco, 69.5% in Rochester, NY, and 67.3% in Buffalo, NY.
Prices
- North Port, FL had the nation’s highest price growth, rising 29.7% since last year to $389,000. Salt Lake City had the second highest growth at 27.8% year-over-year price growth, followed by Austin, TX (27.3%), Phoenix (25.6%), and McAllen, TX (25.1%).
- 1 metro saw price declines in September: Bridgeport, CT (-2.2%).
Sales
- New York led the nation in year-over-year sales growth, up 25.9%, followed by Honolulu, HI, up 23.6%. San Jose, CA rounded out the top three with sales up 14.7% from a year ago.
- New Orleans saw the largest decline in sales since last year, falling 41.7%. Home sales in Bridgeport, CT and Salt Lake City declined by 23.5% and 23.3%, respectively.
Inventory
- Austin, TX had the highest increase in the number of homes for sale, up 3.3% year over year, followed by Tacoma, WA (2.6%) and Columbus, OH (0.3%).
- Baton Rouge, LA had the largest decrease in overall active listings, falling 52.6% since last September. Salt Lake City (-50.3%), Rochester, NY (-46.9%), and North Port, FL (-42.6%) also saw far fewer homes available on the market than a year ago.
Redfin Estimate
- Miami (86.3%) had the largest share of homes predicted to sell for below list price, according to Redfin Estimate data, followed by Fort Lauderdale, FL (82.0%) and West Palm Beach, FL (81.2%).
- Oakland, CA (93.6%) had the largest share of homes predicted to sell at or above list price, followed by San Jose, CA (92.7%) and Portland, OR (87.9%).
Below are market-by-market breakdowns for prices, inventory, new listings and sales for markets with populations of 750,000 or more. For downloadable data on all of the markets Redfin tracks, visit the Redfin Data Center.
Median Sale Price
| Redfin Metro | Median Sale Price | Month-Over-Month | Year-Over-Year |
|---|---|---|---|
| Albany, NY | $270,000 | 0.0% | 9.1% |
| Allentown, PA | $270,500 | 0.2% | 13.9% |
| Anaheim, CA | $900,000 | -0.6% | 15.1% |
| Atlanta, GA | $330,000 | 0.0% | 16.6% |
| Austin, TX | $452,000 | -4.8% | 27.3% |
| Bakersfield, CA | $328,500 | 4.3% | 20.6% |
| Baltimore, MD | $342,000 | -2.3% | 5.2% |
| Baton Rouge, LA | $242,400 | -3.8% | 7.7% |
| Birmingham, AL | $257,900 | 3.2% | 5.3% |
| Boston, MA | $605,000 | -4.0% | 8.0% |
| Bridgeport, CT | $484,000 | -8.7% | -2.2% |
| Buffalo, NY | $217,800 | -3.0% | 15.4% |
| Camden, NJ | $275,000 | 0.0% | 17.0% |
| Charleston, SC | $355,000 | -1.4% | 13.6% |
| Charlotte, NC | $343,000 | 0.0% | 16.3% |
| Chicago, IL | $294,500 | -3.4% | 6.7% |
| Cincinnati, OH | $240,000 | -2.4% | 10.6% |
| Cleveland, OH | $185,900 | -7.1% | 6.2% |
| Columbus, OH | $279,900 | -1.8% | 13.4% |
| Dallas, TX | $375,000 | -1.1% | 17.2% |
| Dayton, OH | $180,000 | 0.6% | 6.5% |
| Denver, CO | $530,000 | 0.0% | 16.5% |
| Detroit, MI | $186,000 | 3.3% | 12.7% |
| El Paso, TX | $200,000 | -4.3% | 9.3% |
| Elgin, IL | $270,000 | -1.8% | 8.0% |
| Fort Lauderdale, FL | $350,000 | -1.4% | 14.8% |
| Fort Worth, TX | $315,000 | 0.0% | 18.9% |
| Frederick, MD | $480,000 | -4.0% | 8.3% |
| Fresno, CA | $370,000 | -0.3% | 15.6% |
| Grand Rapids, MI | $269,700 | 1.2% | 10.1% |
| Greensboro, NC | $230,000 | 2.5% | 16.2% |
| Greenville, SC | $269,500 | -2.2% | 14.2% |
| Hartford, CT | $275,000 | -3.5% | 9.1% |
| Houston, TX | $300,000 | -2.3% | 14.8% |
| Indianapolis, IN | $250,000 | 0.0% | 11.1% |
| Jacksonville, FL | $310,500 | 0.5% | 19.4% |
| Kansas City, MO | $270,000 | -1.8% | 3.9% |
| Knoxville, TN | $289,000 | 0.2% | 18.0% |
| Lake County, IL | $292,000 | 0.7% | 6.2% |
| Las Vegas, NV | $378,000 | 0.8% | 19.3% |
| Los Angeles, CA | $815,000 | -0.6% | 12.1% |
| Louisville, KY | $240,000 | 1.5% | 8.1% |
| McAllen, TX | $203,500 | 8.8% | 25.1% |
| Memphis, TN | $245,000 | -1.2% | 1.2% |
| Miami, FL | $406,800 | -0.8% | 14.6% |
| Milwaukee, WI | $270,000 | 0.0% | 10.2% |
| Minneapolis, MN | $345,000 | -1.4% | 10.8% |
| Montgomery County, PA | $390,000 | -3.7% | 8.2% |
| Nashville, TN | $390,000 | -0.8% | 19.1% |
| Nassau County, NY | $590,000 | -1.7% | 12.4% |
| New Brunswick, NJ | $429,000 | -0.2% | 11.1% |
| New Haven, CT | $275,000 | -2.5% | 5.8% |
| New Orleans, LA | $289,400 | 7.6% | 17.2% |
| New York, NY | $650,000 | -3.7% | 13.0% |
| Newark, NJ | $465,000 | -4.1% | 6.7% |
| North Port, FL | $389,000 | 3.5% | 29.7% |
| Oakland, CA | $940,000 | 0.0% | 13.3% |
| Oklahoma City, OK | $226,300 | 2.9% | 9.9% |
| Omaha, NE | $250,000 | -2.0% | 8.2% |
| Orlando, FL | $335,000 | 0.3% | 18.8% |
| Oxnard, CA | $765,500 | -1.2% | 9.4% |
| Philadelphia, PA | $260,000 | -4.1% | 6.1% |
| Phoenix, AZ | $417,000 | 1.2% | 25.6% |
| Pittsburgh, PA | $210,800 | -4.2% | 4.9% |
| Portland, OR | $500,000 | -3.3% | 11.2% |
| Providence, RI | $385,000 | -0.9% | 14.9% |
| Raleigh, NC | $380,500 | 1.5% | 20.8% |
| Richmond, VA | $317,500 | -2.3% | 7.8% |
| Riverside, CA | $505,000 | 0.0% | 16.1% |
| Rochester, NY | $195,000 | -2.5% | 11.4% |
| Sacramento, CA | $550,000 | 0.0% | 16.7% |
| Salt Lake City, UT | $489,000 | 3.6% | 27.8% |
| San Antonio, TX | $297,000 | 0.7% | 14.2% |
| San Diego, CA | $760,000 | 2.0% | 14.8% |
| San Francisco, CA | $1,530,000 | 1.3% | 5.5% |
| San Jose, CA | $1,340,000 | -1.1% | 11.8% |
| Seattle, WA | $710,900 | -2.6% | 11.8% |
| St. Louis, MO | $230,000 | 0.0% | 7.5% |
| Tacoma, WA | $501,000 | -0.8% | 16.5% |
| Tampa, FL | $320,000 | 1.6% | 20.1% |
| Tucson, AZ | $321,400 | 2.1% | 23.1% |
| Tulsa, OK | $225,000 | -2.2% | 5.6% |
| Honolulu, HI | $683,500 | -2.4% | 6.5% |
| Virginia Beach, VA | $283,000 | -2.4% | 4.8% |
| Warren, MI | $270,000 | -1.7% | 8.9% |
| Washington, D.C. | $480,000 | -2.0% | 5.0% |
| West Palm Beach, FL | $365,000 | 0.0% | 14.1% |
| Worcester, MA | $371,000 | 0.3% | 11.9% |
| National | $376,800 | -0.8% | 13.9% |
Homes Sold
| Redfin Metro | Homes Sold | Month-Over-Month | Year-Over-Year |
|---|---|---|---|
| Albany, NY | 1,079 | -11.0% | -5.6% |
| Allentown, PA | 1,002 | -8.9% | -12.6% |
| Anaheim, CA | 3,027 | -5.1% | -9.5% |
| Atlanta, GA | 9,936 | -10.4% | -7.7% |
| Austin, TX | 3,372 | -7.0% | -10.3% |
| Bakersfield, CA | 826 | -9.1% | -10.8% |
| Baltimore, MD | 4,323 | -8.4% | -0.1% |
| Baton Rouge, LA | 1,011 | -1.9% | -13.8% |
| Birmingham, AL | 1,643 | -10.9% | -2.2% |
| Boston, MA | 4,975 | -11.4% | -3.8% |
| Bridgeport, CT | 1,394 | -14.3% | -23.5% |
| Buffalo, NY | 1,090 | -15.7% | -9.8% |
| Camden, NJ | 1,947 | -8.1% | -2.3% |
| Charleston, SC | 1,676 | -11.1% | -11.6% |
| Charlotte, NC | 4,688 | -6.9% | -2.8% |
| Chicago, IL | 9,704 | -14.3% | -6.1% |
| Cincinnati, OH | 3,025 | -8.2% | -7.6% |
| Cleveland, OH | 3,176 | -2.7% | 6.5% |
| Columbus, OH | 3,341 | -6.3% | 2.8% |
| Dallas, TX | 6,457 | -6.6% | -8.1% |
| Dayton, OH | 1,225 | 0.4% | -3.2% |
| Denver, CO | 5,574 | -6.8% | -9.2% |
| Detroit, MI | 2,097 | -4.9% | -3.0% |
| El Paso, TX | 869 | -13.3% | -9.1% |
| Elgin, IL | 1,247 | -12.9% | -9.2% |
| Fort Lauderdale, FL | 3,035 | -14.5% | -3.9% |
| Fort Worth, TX | 3,352 | -5.7% | -5.7% |
| Frederick, MD | 1,838 | -11.9% | -2.2% |
| Fresno, CA | 843 | -7.1% | 3.4% |
| Grand Rapids, MI | 1,408 | -8.3% | -17.6% |
| Greensboro, NC | 1,122 | -2.0% | 9.1% |
| Greenville, SC | 1,359 | 0.7% | -2.2% |
| Hartford, CT | 1,726 | -10.5% | -6.3% |
| Houston, TX | 9,447 | -8.3% | 0.6% |
| Indianapolis, IN | 3,711 | -4.2% | -0.8% |
| Jacksonville, FL | 2,821 | -14.1% | -11.5% |
| Kansas City, MO | 3,689 | -7.2% | -4.8% |
| Knoxville, TN | 1,409 | -5.2% | -4.7% |
| Lake County, IL | 1,455 | -12.2% | -8.1% |
| Las Vegas, NV | 4,154 | -3.5% | 4.9% |
| Los Angeles, CA | 6,889 | -1.5% | 3.3% |
| Louisville, KY | 1,880 | -2.1% | 3.2% |
| McAllen, TX | 376 | -13.2% | -18.4% |
| Memphis, TN | 1,256 | -15.8% | 3.7% |
| Miami, FL | 2,915 | -17.8% | 3.8% |
| Milwaukee, WI | 2,181 | -10.3% | -7.3% |
| Minneapolis, MN | 6,391 | -9.8% | -5.8% |
| Montgomery County, PA | 2,709 | -16.7% | -7.3% |
| Nashville, TN | 3,692 | -9.1% | -11.9% |
| Nassau County, NY | 2,934 | -12.5% | -8.5% |
| New Brunswick, NJ | 3,483 | -12.5% | -18.6% |
| New Haven, CT | 1,194 | -8.5% | -7.5% |
| New Orleans, LA | 930 | -28.5% | -41.7% |
| New York, NY | 7,033 | -21.0% | 25.9% |
| Newark, NJ | 2,278 | -20.3% | -21.9% |
| North Port, FL | 2,091 | -3.8% | -11.2% |
| Oakland, CA | 2,941 | -6.3% | 2.2% |
| Oklahoma City, OK | 2,250 | -11.6% | -6.2% |
| Omaha, NE | 1,347 | -6.5% | -6.5% |
| Orlando, FL | 4,613 | -4.6% | 7.8% |
| Oxnard, CA | 876 | 0.1% | -7.2% |
| Philadelphia, PA | 2,452 | -7.4% | -6.2% |
| Phoenix, AZ | 8,859 | 2.9% | -1.8% |
| Pittsburgh, PA | 2,604 | -9.1% | -9.4% |
| Portland, OR | 4,057 | -4.4% | -5.7% |
| Providence, RI | 2,212 | 1.4% | -2.8% |
| Raleigh, NC | 2,401 | -13.2% | -11.6% |
| Richmond, VA | 1,982 | -11.7% | 6.6% |
| Riverside, CA | 5,811 | -0.5% | -4.6% |
| Rochester, NY | 1,195 | -13.8% | -14.3% |
| Sacramento, CA | 2,954 | -6.6% | -17.8% |
| Salt Lake City, UT | 1,515 | -9.9% | -23.3% |
| San Antonio, TX | 3,257 | -8.2% | -7.3% |
| San Diego, CA | 3,592 | -3.6% | -6.7% |
| San Francisco, CA | 1,223 | -4.6% | 8.0% |
| San Jose, CA | 1,709 | -3.0% | 14.7% |
| Seattle, WA | 5,312 | -3.2% | -1.1% |
| St. Louis, MO | 4,332 | -6.1% | -1.3% |
| Tacoma, WA | 1,756 | -2.1% | 3.9% |
| Tampa, FL | 6,442 | -3.0% | 3.3% |
| Tucson, AZ | 1,483 | -3.7% | -8.7% |
| Tulsa, OK | 1,610 | -2.6% | 4.1% |
| Honolulu, HI | 1,020 | -4.1% | 23.6% |
| Virginia Beach, VA | 3,051 | -7.7% | 7.7% |
| Warren, MI | 4,135 | -3.5% | -12.5% |
| Washington, D.C. | 6,963 | -12.9% | -9.1% |
| West Palm Beach, FL | 2,811 | -14.4% | -13.2% |
| Worcester, MA | 1,231 | -5.0% | 3.0% |
| National | 613,200 | 1.6% | -5.4% |
New Listings
| Redfin Metro | New Listings | Month-Over-Month | Year-Over-Year |
|---|---|---|---|
| Albany, NY | 1,118 | -16.6% | -20.9% |
| Allentown, PA | 534 | -35.3% | -57.3% |
| Anaheim, CA | 2,567 | -16.1% | -27.4% |
| Atlanta, GA | 9,548 | -14.1% | -10.4% |
| Austin, TX | 3,840 | -7.3% | 17.6% |
| Bakersfield, CA | 992 | -6.0% | -5.7% |
| Baltimore, MD | 4,408 | -10.4% | -8.5% |
| Baton Rouge, LA | 440 | -40.0% | -59.0% |
| Birmingham, AL | 1,543 | -14.9% | -13.0% |
| Boston, MA | 6,478 | 32.2% | -4.6% |
| Bridgeport, CT | 1,338 | -5.8% | -30.7% |
| Buffalo, NY | 1,113 | -24.7% | -22.8% |
| Camden, NJ | 1,845 | -14.7% | -15.8% |
| Charleston, SC | 1,753 | -5.3% | -2.2% |
| Charlotte, NC | 3,143 | -26.2% | -36.0% |
| Chicago, IL | 10,927 | -7.4% | -10.1% |
| Cincinnati, OH | 3,123 | -15.0% | -7.1% |
| Cleveland, OH | 3,287 | -5.7% | -4.2% |
| Columbus, OH | 3,305 | -9.7% | 1.3% |
| Dallas, TX | 6,655 | -10.0% | -2.4% |
| Dayton, OH | 1,273 | -11.5% | -7.0% |
| Denver, CO | 5,918 | 0.3% | 0.4% |
| Detroit, MI | 2,561 | -11.5% | 2.2% |
| El Paso, TX | 956 | -5.7% | -1.4% |
| Elgin, IL | 1,144 | -18.1% | -7.7% |
| Fort Lauderdale, FL | 2,995 | -12.4% | -25.2% |
| Fort Worth, TX | 3,415 | -6.8% | 1.9% |
| Frederick, MD | 1,969 | 2.0% | -1.3% |
| Fresno, CA | 883 | -9.2% | -6.8% |
| Grand Rapids, MI | 1,536 | -5.9% | -4.4% |
| Greensboro, NC | 780 | -24.3% | -27.4% |
| Greenville, SC | 1,309 | -9.3% | -2.7% |
| Hartford, CT | 1,788 | -6.4% | -15.0% |
| Houston, TX | 10,080 | -13.5% | 3.0% |
| Indianapolis, IN | 3,727 | -7.4% | -7.4% |
| Jacksonville, FL | 3,131 | -8.4% | 5.8% |
| Kansas City, MO | 3,464 | -12.8% | -11.5% |
| Knoxville, TN | 1,203 | -17.2% | -11.3% |
| Lake County, IL | 1,291 | -15.3% | -12.9% |
| Las Vegas, NV | 4,416 | -11.4% | -4.4% |
| Los Angeles, CA | 6,806 | -10.8% | -18.9% |
| Louisville, KY | 1,997 | -6.6% | -0.7% |
| McAllen, TX | 503 | -13.3% | -10.5% |
| Memphis, TN | 1,260 | -15.7% | -3.7% |
| Miami, FL | 3,908 | -5.9% | -2.2% |
| Milwaukee, WI | 2,212 | -9.2% | -8.0% |
| Minneapolis, MN | 6,586 | -8.0% | -10.4% |
| Montgomery County, PA | 2,555 | -9.0% | -13.3% |
| Nashville, TN | 3,801 | -0.7% | -5.8% |
| Nassau County, NY | 2,986 | -9.8% | -28.8% |
| New Brunswick, NJ | 3,491 | -14.7% | -29.2% |
| New Haven, CT | 1,168 | -16.5% | -23.1% |
| New Orleans, LA | 773 | -49.1% | -49.4% |
| New York, NY | 8,719 | 6.6% | -22.6% |
| Newark, NJ | 2,464 | -8.4% | -27.7% |
| North Port, FL | 2,169 | -8.2% | -9.7% |
| Oakland, CA | 3,078 | -4.2% | -3.9% |
| Oklahoma City, OK | 2,231 | -16.6% | -2.1% |
| Omaha, NE | 1,353 | -0.3% | -3.8% |
| Orlando, FL | 4,599 | -10.8% | -3.6% |
| Oxnard, CA | 806 | -14.0% | -32.4% |
| Philadelphia, PA | 2,988 | -2.2% | -10.0% |
| Phoenix, AZ | 8,765 | -10.2% | -12.0% |
| Pittsburgh, PA | 2,870 | -11.0% | 0.5% |
| Portland, OR | 4,150 | -4.0% | 8.3% |
| Providence, RI | 2,292 | -6.3% | -14.3% |
| Raleigh, NC | 2,658 | 1.3% | -1.6% |
| Richmond, VA | 1,890 | -11.6% | -10.7% |
| Riverside, CA | 6,307 | -5.9% | -3.8% |
| Rochester, NY | 967 | -20.6% | -31.6% |
| Sacramento, CA | 3,111 | -3.4% | -12.8% |
| Salt Lake City, UT | 879 | -40.0% | -51.3% |
| San Antonio, TX | 3,401 | -15.2% | 1.3% |
| San Diego, CA | 3,204 | -11.9% | -14.4% |
| San Francisco, CA | 1,335 | 15.4% | -29.4% |
| San Jose, CA | 1,550 | -9.1% | -11.4% |
| Seattle, WA | 5,355 | 0.4% | -6.3% |
| St. Louis, MO | 2,345 | -37.0% | -49.0% |
| Tacoma, WA | 1,734 | -5.7% | 9.1% |
| Tampa, FL | 6,535 | -6.1% | 3.2% |
| Tucson, AZ | 1,719 | 1.5% | -6.8% |
| Tulsa, OK | 1,540 | -17.0% | -2.4% |
| Honolulu, HI | 907 | -8.0% | 3.7% |
| Virginia Beach, VA | 2,812 | -15.5% | -0.8% |
| Warren, MI | 4,417 | -14.0% | -2.9% |
| Washington, D.C. | 7,781 | 0.9% | -8.0% |
| West Palm Beach, FL | 3,173 | -0.5% | -16.1% |
| Worcester, MA | 1,399 | 0.4% | -5.7% |
| National | 631,800 | -2.3% | -9.0% |
All Homes for Sale
| Redfin Metro | All Homes for Sale | Month-Over-Month | Year-Over-Year |
|---|---|---|---|
| Albany, NY | 3,174 | -7.8% | -13.6% |
| Allentown, PA | 1,642 | -21.7% | -37.7% |
| Anaheim, CA | 6,550 | -12.9% | -35.8% |
| Atlanta, GA | 21,830 | -9.4% | -25.2% |
| Austin, TX | 9,426 | -3.5% | 3.3% |
| Bakersfield, CA | 2,249 | -2.7% | -8.1% |
| Baltimore, MD | 10,451 | -6.3% | -7.1% |
| Baton Rouge, LA | 1,828 | -21.1% | -52.6% |
| Birmingham, AL | 4,567 | -8.8% | -21.0% |
| Boston, MA | 12,679 | 7.5% | -15.1% |
| Bridgeport, CT | 5,194 | -7.4% | -28.5% |
| Buffalo, NY | 2,394 | -15.6% | -21.7% |
| Camden, NJ | 4,918 | -8.9% | -9.4% |
| Charleston, SC | 5,308 | -1.0% | -22.8% |
| Charlotte, NC | 9,350 | -14.8% | -36.0% |
| Chicago, IL | 31,391 | -4.1% | -10.2% |
| Cincinnati, OH | 9,198 | -4.4% | -5.2% |
| Cleveland, OH | 8,411 | -4.9% | -6.7% |
| Columbus, OH | 8,690 | -5.3% | 0.3% |
| Dallas, TX | 15,451 | -8.6% | -23.4% |
| Dayton, OH | 3,028 | -3.9% | -4.9% |
| Denver, CO | 9,919 | -4.4% | -14.2% |
| Detroit, MI | 6,391 | 0.3% | -1.4% |
| El Paso, TX | 2,414 | -7.8% | -24.5% |
| Elgin, IL | 2,511 | -10.5% | -15.5% |
| Fort Lauderdale, FL | 10,676 | -7.8% | -35.4% |
| Fort Worth, TX | 7,741 | -6.9% | -17.4% |
| Frederick, MD | 4,380 | -2.7% | -2.1% |
| Fresno, CA | 1,795 | -4.3% | -4.0% |
| Grand Rapids, MI | 2,744 | -4.7% | -14.2% |
| Greensboro, NC | 2,081 | -13.4% | -32.6% |
| Greenville, SC | 3,886 | -4.4% | -19.8% |
| Hartford, CT | 5,153 | -5.3% | -20.1% |
| Houston, TX | 27,563 | -5.7% | -10.2% |
| Indianapolis, IN | 6,603 | -7.8% | -17.0% |
| Jacksonville, FL | 7,444 | -6.1% | -18.8% |
| Kansas City, MO | 8,063 | -7.7% | -7.5% |
| Knoxville, TN | 4,084 | -5.3% | -13.6% |
| Lake County, IL | 3,664 | -10.3% | -17.3% |
| Las Vegas, NV | 10,634 | -4.2% | -22.3% |
| Los Angeles, CA | 19,577 | -7.7% | -20.5% |
| Louisville, KY | 4,468 | -2.4% | -9.7% |
| McAllen, TX | 1,719 | -6.0% | -19.4% |
| Memphis, TN | 3,235 | -10.2% | -7.4% |
| Miami, FL | 15,347 | -4.0% | -21.8% |
| Milwaukee, WI | 7,353 | -4.8% | -1.5% |
| Minneapolis, MN | 14,368 | -3.7% | -10.3% |
| Montgomery County, PA | 6,213 | -7.7% | -15.6% |
| Nashville, TN | 8,502 | -0.8% | -28.6% |
| Nassau County, NY | 9,782 | -5.3% | -25.6% |
| New Brunswick, NJ | 10,510 | -5.0% | -21.4% |
| New Haven, CT | 3,946 | -6.6% | -18.9% |
| New Orleans, LA | 3,530 | -18.5% | -25.1% |
| New York, NY | 37,536 | -2.0% | -21.5% |
| Newark, NJ | 8,179 | -3.3% | -18.3% |
| North Port, FL | 4,037 | -4.7% | -42.6% |
| Oakland, CA | 5,742 | -4.3% | -3.7% |
| Oklahoma City, OK | 5,040 | -7.2% | -9.8% |
| Omaha, NE | 2,438 | -3.2% | -10.6% |
| Orlando, FL | 9,513 | -6.8% | -28.3% |
| Oxnard, CA | 2,134 | -6.6% | -26.3% |
| Philadelphia, PA | 9,096 | -2.2% | -6.7% |
| Phoenix, AZ | 19,636 | -5.8% | -15.4% |
| Pittsburgh, PA | 10,328 | -3.3% | -5.9% |
| Portland, OR | 7,948 | -4.1% | -8.0% |
| Providence, RI | 5,668 | -3.7% | -13.3% |
| Raleigh, NC | 5,733 | -3.1% | -30.0% |
| Richmond, VA | 3,710 | -8.8% | -12.5% |
| Riverside, CA | 15,342 | -3.1% | -11.1% |
| Rochester, NY | 1,594 | -26.4% | -46.9% |
| Sacramento, CA | 6,141 | -4.6% | -11.9% |
| Salt Lake City, UT | 2,084 | -25.9% | -50.3% |
| San Antonio, TX | 8,494 | -8.1% | -16.3% |
| San Diego, CA | 6,546 | -11.8% | -21.6% |
| San Francisco, CA | 2,971 | 0.2% | -38.0% |
| San Jose, CA | 3,057 | -10.4% | -22.6% |
| Seattle, WA | 8,616 | -5.1% | -21.2% |
| St. Louis, MO | 7,395 | -21.2% | -36.4% |
| Tacoma, WA | 2,953 | -5.8% | 2.6% |
| Tampa, FL | 12,173 | -6.6% | -20.3% |
| Tucson, AZ | 4,423 | 1.0% | -12.6% |
| Tulsa, OK | 3,327 | -8.0% | -12.2% |
| Honolulu, HI | 3,133 | -6.7% | -21.0% |
| Virginia Beach, VA | 6,764 | -10.7% | -1.4% |
| Warren, MI | 10,282 | -4.9% | -7.9% |
| Washington, D.C. | 18,884 | -3.2% | -0.1% |
| West Palm Beach, FL | 9,665 | -4.2% | -38.8% |
| Worcester, MA | 2,989 | 0.2% | -6.6% |
| National | 1,384,200 | -2.0% | -19.0% |
Median Off-Market Redfin Estimate
| Redfin Metro | Estimate | Month-Over-Month | Year-Over-Year |
|---|---|---|---|
| Albany, NY | $232,700 | 1.8% | 13.8% |
| Allentown, PA | $263,700 | 5.5% | 19.8% |
| Anaheim, CA | $919,300 | 4.7% | 22.2% |
| Atlanta, GA | $301,600 | 5.8% | 25.2% |
| Austin, TX | $463,300 | 10.5% | 48.9% |
| Bakersfield, CA | $248,700 | 7.5% | 21.2% |
| Baltimore, MD | $326,500 | 3.9% | 16.6% |
| Baton Rouge, LA | $145,400 | -1.8% | 9.8% |
| Birmingham, AL | $162,400 | 2.8% | 16.0% |
| Boston, MA | $616,900 | 2.1% | 13.4% |
| Bridgeport, CT | $462,600 | 4.8% | 16.9% |
| Buffalo, NY | $187,500 | 4.5% | 19.0% |
| Camden, NJ | $267,000 | 6.1% | 23.9% |
| Charleston, SC | $296,800 | 5.2% | 20.7% |
| Charlotte, NC | $282,700 | 6.3% | 28.7% |
| Chicago, IL | $284,300 | -2.5% | 6.0% |
| Cincinnati, OH | $207,000 | 5.7% | 20.2% |
| Cleveland, OH | $173,300 | 4.2% | 17.4% |
| Columbus, OH | $244,900 | 5.5% | 17.9% |
| Dallas, TX | $332,400 | 7.5% | 25.6% |
| Dayton, OH | $158,500 | 6.4% | 21.4% |
| Denver, CO | $524,200 | 7.0% | 22.1% |
| Detroit, MI | $128,900 | 3.4% | 19.7% |
| Elgin, IL | $258,500 | -1.7% | 9.3% |
| Fort Lauderdale, FL | $329,100 | 4.3% | 17.0% |
| Fort Worth, TX | $281,900 | 7.2% | 23.9% |
| Frederick, MD | $493,500 | 3.6% | 15.9% |
| Fresno, CA | $341,100 | 7.2% | 25.6% |
| Grand Rapids, MI | $237,600 | 9.7% | 32.0% |
| Greensboro, NC | $176,800 | 5.1% | 23.0% |
| Greenville, SC | $201,900 | 6.0% | 21.2% |
| Hartford, CT | $269,500 | 7.6% | 18.1% |
| Houston, TX | $248,700 | 6.0% | 21.2% |
| Indianapolis, IN | $209,800 | 6.7% | 21.6% |
| Jacksonville, FL | $275,000 | 6.6% | 25.4% |
| Kansas City, MO | $233,100 | 7.6% | 22.5% |
| Knoxville, TN | $232,000 | 5.4% | 24.5% |
| Lake County, IL | $246,800 | -0.2% | 9.8% |
| Las Vegas, NV | $362,800 | 5.7% | 24.3% |
| Los Angeles, CA | $801,500 | 5.0% | 20.5% |
| Louisville, KY | $195,100 | -0.9% | 6.1% |
| Memphis, TN | $184,900 | 3.1% | 19.2% |
| Miami, FL | $382,700 | 5.6% | 18.7% |
| Milwaukee, WI | $252,600 | 5.5% | 16.5% |
| Minneapolis, MN | $328,800 | 5.2% | 16.0% |
| Montgomery County, PA | $396,000 | 4.8% | 18.0% |
| Nashville, TN | $354,100 | 7.5% | 23.3% |
| Nassau County, NY | $581,200 | 3.6% | 16.1% |
| New Brunswick, NJ | $431,100 | 5.3% | 21.0% |
| New Haven, CT | $277,600 | 7.7% | 21.9% |
| New Orleans, LA | $195,700 | -0.5% | 10.8% |
| Newark, NJ | $439,300 | 1.9% | 16.1% |
| North Port, FL | $312,700 | 8.6% | 28.5% |
| Oakland, CA | $1,002,700 | 5.5% | 25.1% |
| Oklahoma City, OK | $177,000 | 5.7% | 16.8% |
| Omaha, NE | $231,200 | 3.6% | 17.1% |
| Orlando, FL | $296,200 | 7.5% | 22.2% |
| Oxnard, CA | $754,700 | 5.7% | 22.2% |
| Philadelphia, PA | $230,800 | 1.5% | 15.1% |
| Phoenix, AZ | $396,900 | 11.8% | 39.3% |
| Pittsburgh, PA | $158,700 | 3.2% | 12.8% |
| Portland, OR | $499,400 | 5.9% | 20.9% |
| Providence, RI | $371,300 | 4.8% | 20.7% |
| Raleigh, NC | $336,900 | 8.8% | 26.1% |
| Richmond, VA | $279,600 | 2.4% | 13.7% |
| Riverside, CA | $452,600 | 7.2% | 31.1% |
| Rochester, NY | $176,500 | 4.7% | 17.0% |
| Sacramento, CA | $549,500 | 8.0% | 28.3% |
| Salt Lake City, UT | $500,400 | 11.7% | 34.6% |
| San Antonio, TX | $231,400 | 6.9% | 21.5% |
| San Diego, CA | $795,500 | 5.4% | 26.1% |
| San Francisco, CA | $1,531,900 | 3.7% | 11.3% |
| San Jose, CA | $1,436,400 | 5.1% | 21.8% |
| Seattle, WA | $724,800 | 5.1% | 23.1% |
| St. Louis, MO | $181,900 | 5.3% | 10.5% |
| Tacoma, WA | $490,200 | 6.5% | 27.1% |
| Tampa, FL | $282,400 | 8.1% | 23.1% |
| Tucson, AZ | $270,500 | 4.8% | 26.6% |
| Tulsa, OK | $155,500 | 2.6% | 12.8% |
| Honolulu, HI | $819,900 | 3.0% | 16.4% |
| Virginia Beach, VA | $273,300 | 3.0% | 13.2% |
| Warren, MI | $257,100 | 4.2% | 17.0% |
| Washington, D.C. | $476,600 | 3.5% | 15.4% |
| West Palm Beach, FL | $344,600 | 5.8% | 21.4% |
| Worcester, MA | $350,900 | 4.9% | 19.9% |
| National | $381,900 | 7.3% | 19.9% |


