
Record-low supply spurs unprecedented winter homebuying competition.
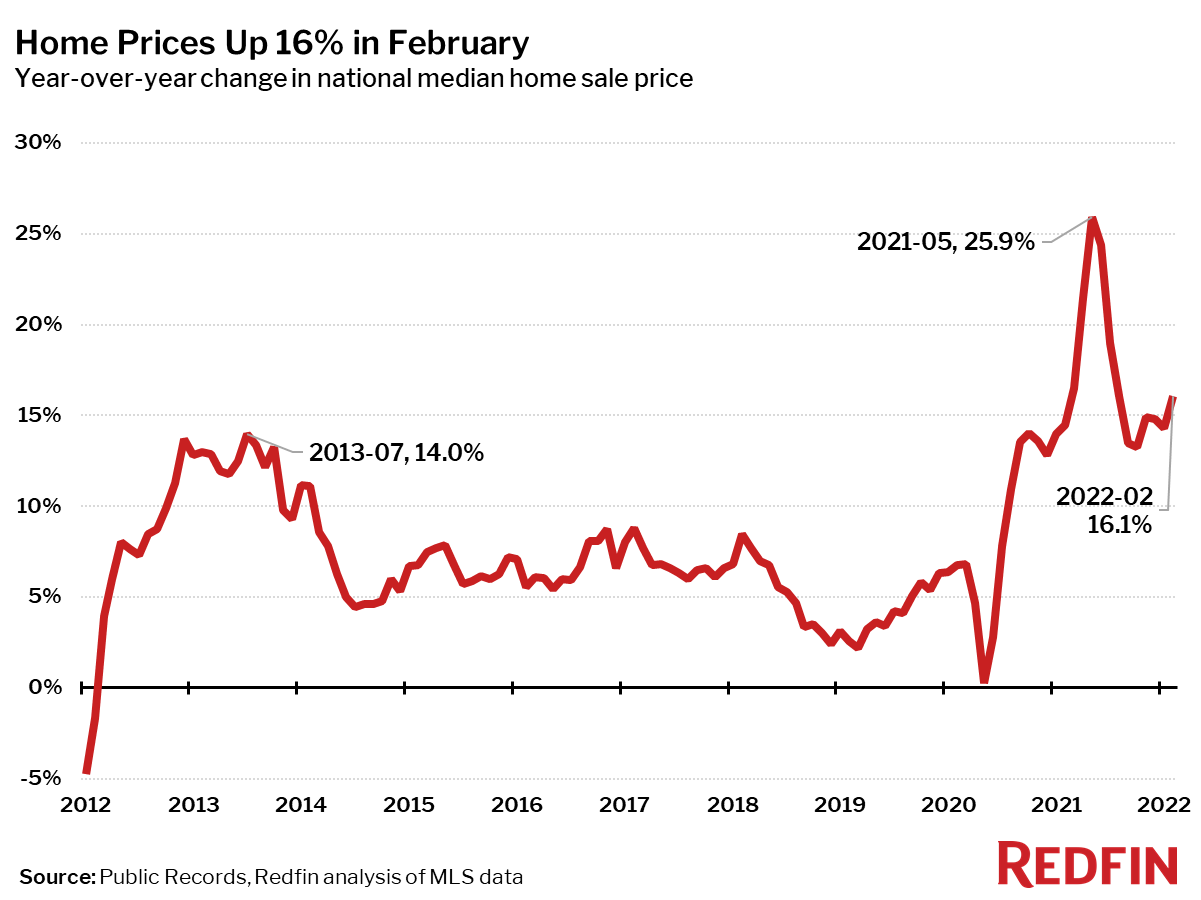
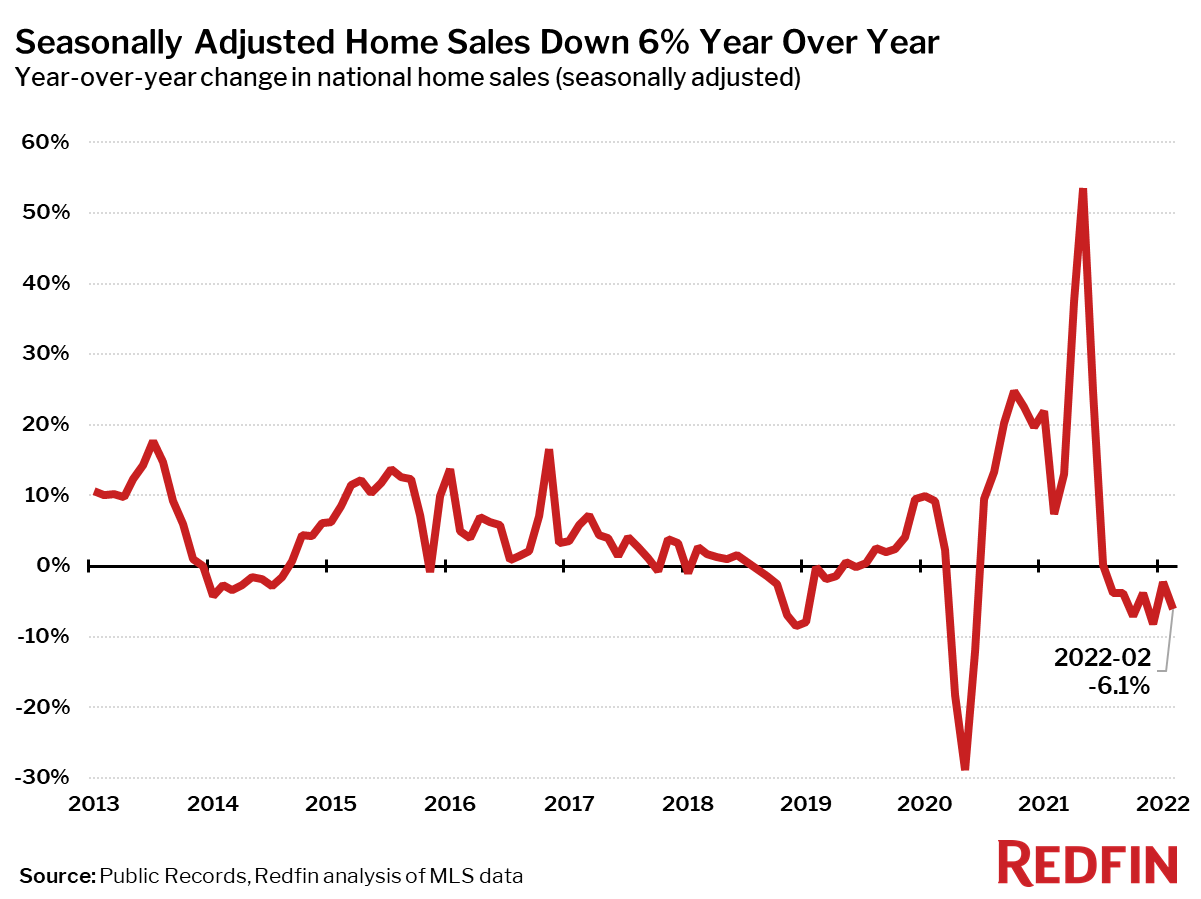
The median home sale price rose 3.5% between January and February, the fastest month-over-month gain ever seen during the winter months. Prices were up 16% year over year to an all-time high of $389,500 in February as the number of homes for sale fell to another new low. The lack of inventory is holding back home sales, which fell 4% from January.
“An acute shortage of homes for sale continues to stymie buyers in the current market,” said Redfin chief economist Daryl Fairweather. “Rather than dropping out of the housing market, homebuyers only seem to be getting even more voracious, driving prices up at a startling clip. Typically, rising mortgage rates weaken demand for homes—we don’t see demand weakening yet, but we will be watching to see if buyers back off or remain steadfast amidst rising borrowing costs.”
| Market Summary | February 2022 | Month-Over-Month | Year-Over-Year |
|---|---|---|---|
| Median sale price | $389,500 | 3.5% | 16.1% |
| Homes sold, seasonally-adjusted | 594,300 | -7.0% | -6.1% |
| Pending sales, seasonally-adjusted | 561,700 | -4.2% | -2.8% |
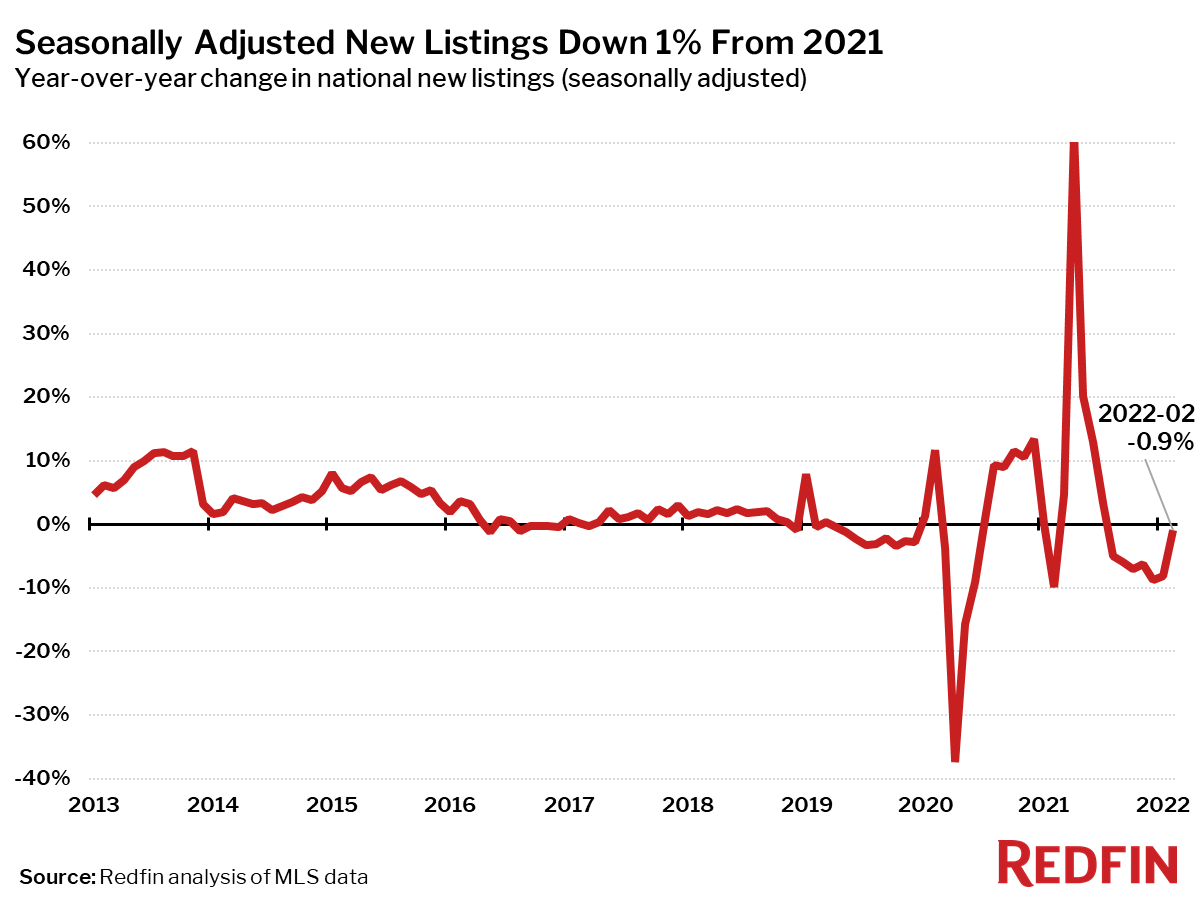
| New listings, seasonally-adjusted | 628,700 | -0.4% | -0.9% |
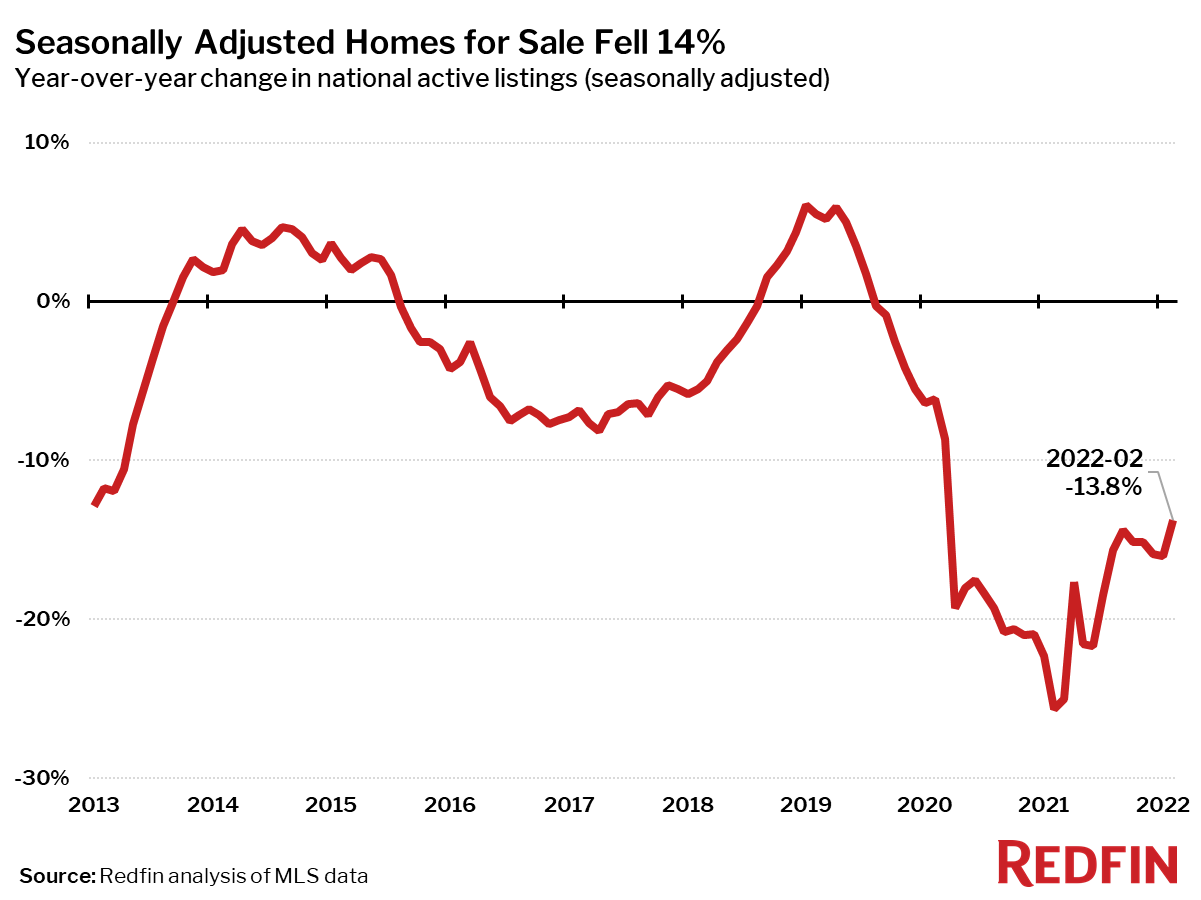
| All Homes for sale, seasonally-adjusted | 1,340,300 | -1.5% | -13.8% |
| Median days on market | 25 | -2 | -8 |
| Months of supply | 1.3 | 0 | -0.3 |
| Sold above list | 47.3% | 4.8 pts† | 11.1 pts† |
| Median Off-Market Redfin Estimate | $406,500 | 3.7% | 20.7% |
| Average Sale-to-list | 101.3% | 0.9 pts† | 1.5 pts† |
| Average 30-year fixed mortgage rate | 3.76% | +0.32 pts† | +0.95 pts† |
“Virtually every home for sale gets multiple offers these days,” said San Diego Redfin real estate agent Ashley Van Leuven. “Most listings receive 20 or more offers, and the buyers who win are nearly always waiving contingencies and offering substantially above list price—sometimes by several hundred thousand dollars.”
Median sale prices increased from a year earlier in all but one of the 88 largest metro areas Redfin tracks. The only metro area with a decrease was Bridgeport, CT, where home prices are still correcting from a major pandemic surge and fell 6% from a year earlier. The largest price increases were in North Port, FL (+29%), Phoenix, AZ (+28%) and Las Vegas, NV (+28%).
Seasonally-adjusted home sales in February were down 7% from a month earlier and down 6% from a year earlier. Home sales fell from the prior year in 63 of the 88 largest metro areas Redfin tracks. The biggest sales declines were in Rochester, NY (-27%), Anaheim, CA (-21%) and Albany, NY (-20%). The largest gains were in Houston, TX (+22%), McAllen, TX (+16%) and Tulsa, OK (+10%).
Seasonally adjusted active listings—the count of all homes that were for sale at any time during the month—fell 14% year over year to an all-time low in February.
82 of the 88 largest metros tracked by Redfin posted year-over-year decreases in the number of seasonally adjusted active listings of homes for sale. The only metro areas where the number of homes for sale increased were Elgin, IL (+22%), Detroit, MI (+8%), Chicago, IL (+5%) and Austin, TX (+2%). The biggest year-over-year declines in active housing supply in February were in Greensboro, NC (-43%), Allentown, PA (-41%) and Fort Lauderdale, FL (-38%).
New listings fell from a year ago in 53 of the 88 largest metro areas. The largest declines were in Allentown, PA (-41%), Greensboro, NC (-39%) and Charlotte, NC (-23%). Listings rose the most in New York, NY (+19%), Memphis, TN (+17%) and Houston, TX (+17%).
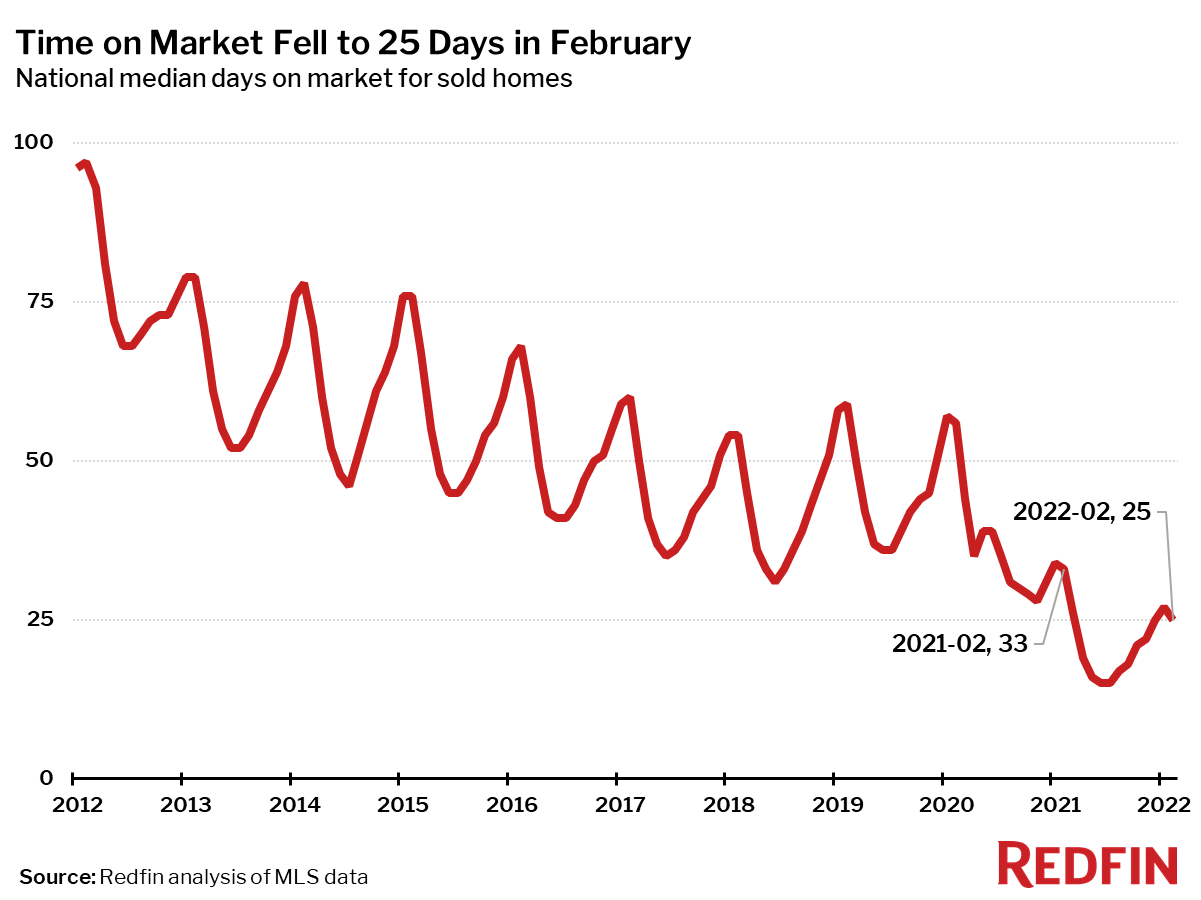
Home sales that closed in February reflected a turn toward a more competitive housing market, a trend that is typical for this time of year, even as we exit the most competitive winter ever.
The typical home that sold in February went under contract in 25 days—eight days faster than a year earlier, when homes sold in a median 33 days, and the shortest time on market ever for a February.
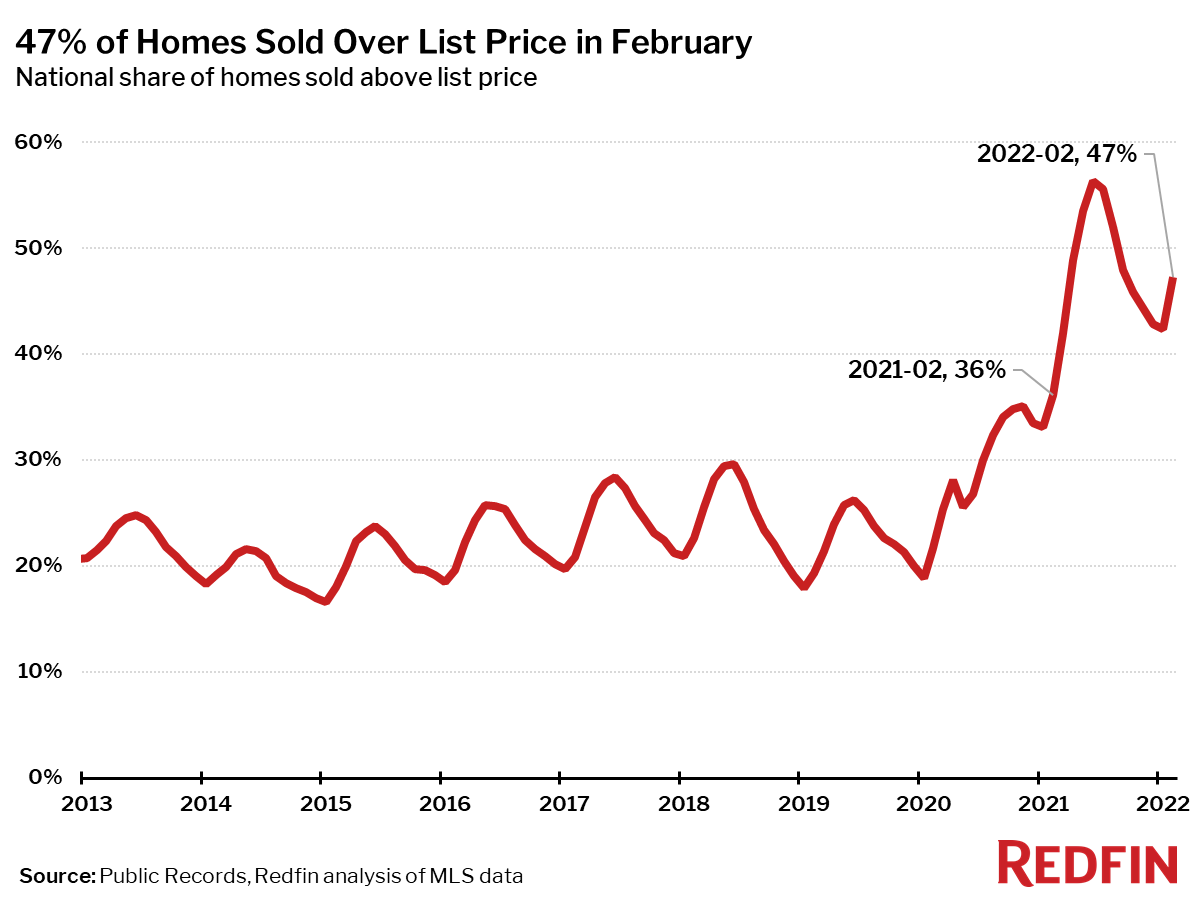
In February, 47% of homes sold above list price, up 11 percentage points from a year earlier, up 5 points from January and the highest level seen in February.
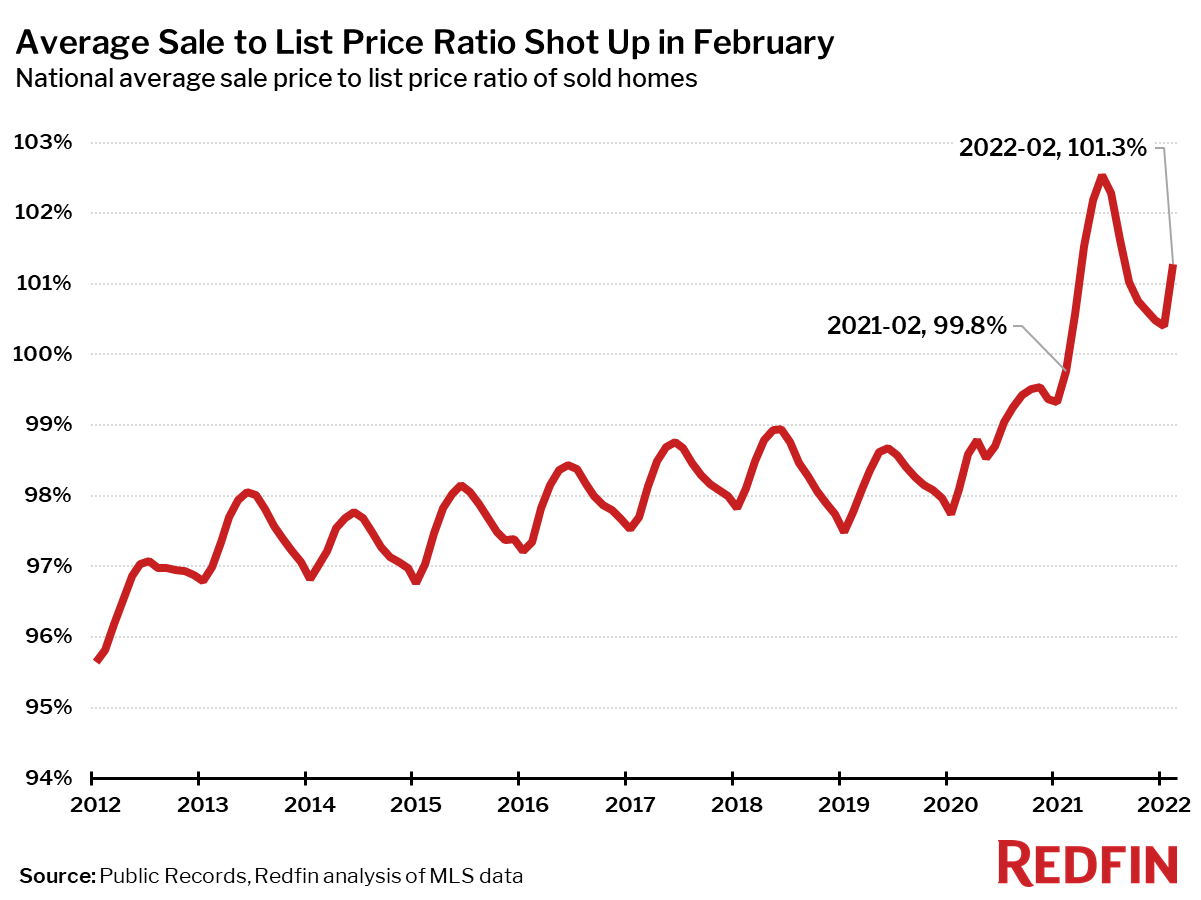
The average sale-to-list price ratio in February was 101.3%, up from 99.8% a year earlier, up from 100.4% in January and the highest level on record for a February.
Other February Highlights
Competition
- Denver and Seattle were the fastest markets, with half of all homes pending sale in just 5 days. Tacoma, WA and Grand Rapids, MI were the next fastest markets with 6 median days on market, followed by North Port, FL (7).
- The most competitive market in February was San Jose, CA where 83.1% of homes sold above list price, followed by 79.5% in Oakland, CA, 73.6% in San Francisco, 69.3% in Denver, and 68.5% in Anaheim, CA.
Prices
- North Port, FL had the nation’s highest price growth, rising 28.8% since last year to $425,000. Phoenix had the second highest growth at 28.3% year-over-year price growth, followed by Las Vegas (28.2%), Tampa, FL (27.8%), and Austin, TX (26.1%).
- One metro area saw price declines in February: Bridgeport, CT (-6.2%).
Sales
- Houston led the nation in year-over-year sales growth, up 22.4%, followed by McAllen, TX, up 16.3%. Tulsa, OK rounded out the top three with sales up 9.5% from a year ago.
- Rochester, NY saw the largest decline in sales since last year, falling 26.7%. Home sales in Anaheim, CA and Albany, NY declined by 21.2% and 20.1%, respectively.
Inventory
- Elgin, IL had the highest increase in the number of homes for sale, up 21.9% year over year, followed by Detroit (8.4%) and Chicago (5.2%).
- Greensboro, NC had the largest decrease in overall active listings, falling 42.6% since last February. Allentown, PA (-41.5%), Fort Lauderdale, FL (-37.9%), and West Palm Beach, FL (-37.0%) also saw far fewer homes available on the market than a year ago.
Redfin Estimate
- Miami (47.2%) had the largest share of homes predicted to sell for below list price, according to Redfin Estimate data, followed by Baton Rouge, LA (42.1%) and Fort Lauderdale, FL (36.1%).
- San Jose, CA (93.5%) had the largest share of homes predicted to sell at or above list price, followed by Oakland, CA (91.7%) and Seattle (91.6%).
Below are market-by-market breakdowns for prices, inventory, new listings and sales for markets with populations of 750,000 or more. For downloadable data on all of the markets Redfin tracks, visit the Redfin Data Center.
Median Sale Price
| Redfin Metro | Median Sale Price | Month-Over-Month | Year-Over-Year |
|---|---|---|---|
| Albany, NY | $266,200 | 2.8% | 10.9% |
| Allentown, PA | $275,000 | 1.9% | 19.6% |
| Anaheim, CA | $999,500 | 4.1% | 20.4% |
| Atlanta, GA | $355,000 | 3.2% | 23.3% |
| Austin, TX | $500,000 | 3.1% | 26.1% |
| Bakersfield, CA | $345,000 | 3.0% | 23.2% |
| Baltimore, MD | $315,000 | 0.0% | 5.0% |
| Baton Rouge, LA | $255,000 | 6.2% | 10.9% |
| Birmingham, AL | $269,800 | 5.8% | 12.4% |
| Boston, MA | $594,500 | -0.1% | 8.1% |
| Bridgeport, CT | $450,000 | -1.8% | -6.2% |
| Buffalo, NY | $195,000 | -2.5% | 14.7% |
| Camden, NJ | $267,500 | -2.7% | 13.8% |
| Charleston, SC | $380,000 | 2.9% | 15.2% |
| Charlotte, NC | $367,200 | 3.2% | 22.4% |
| Chicago, IL | $295,000 | 1.0% | 7.3% |
| Cincinnati, OH | $234,500 | 4.2% | 11.7% |
| Cleveland, OH | $178,000 | 1.7% | 13.9% |
| Columbus, OH | $270,000 | 1.9% | 13.6% |
| Dallas, TX | $400,000 | 5.3% | 20.9% |
| Dayton, OH | $170,000 | 5.6% | 12.1% |
| Denver, CO | $572,000 | 5.9% | 21.2% |
| Detroit, MI | $165,000 | 1.2% | 10.0% |
| El Paso, TX | $225,000 | 4.7% | 19.7% |
| Elgin, IL | $275,000 | 5.8% | 13.4% |
| Fort Lauderdale, FL | $363,000 | 2.3% | 15.3% |
| Fort Worth, TX | $348,000 | 4.9% | 23.0% |
| Frederick, MD | $485,000 | 2.1% | 12.8% |
| Fresno, CA | $387,000 | -0.8% | 13.7% |
| Grand Rapids, MI | $280,000 | 10.5% | 16.3% |
| Greensboro, NC | $230,000 | 2.2% | 23.1% |
| Greenville, SC | $290,400 | 1.9% | 19.9% |
| Hartford, CT | $265,000 | 1.1% | 6.0% |
| Houston, TX | $325,000 | 4.9% | 18.2% |
| Indianapolis, IN | $250,000 | 4.2% | 13.3% |
| Jacksonville, FL | $333,000 | 4.1% | 24.4% |
| Kansas City, MO | $271,000 | 2.3% | 8.4% |
| Knoxville, TN | $310,000 | 2.8% | 25.3% |
| Lake County, IL | $270,000 | 0.0% | 5.9% |
| Las Vegas, NV | $423,000 | 5.0% | 28.2% |
| Los Angeles, CA | $836,500 | 1.4% | 12.3% |
| Louisville, KY | $232,000 | 2.9% | 10.5% |
| McAllen, TX | $196,500 | -1.0% | 19.8% |
| Memphis, TN | $261,700 | 0.3% | 19.5% |
| Miami, FL | $450,000 | 4.3% | 20.8% |
| Milwaukee, WI | $242,600 | 2.1% | 5.5% |
| Minneapolis, MN | $345,000 | 3.0% | 9.5% |
| Montgomery County, PA | $381,000 | 0.3% | 8.9% |
| Nashville, TN | $420,000 | 5.8% | 25.4% |
| Nassau County, NY | $586,000 | -0.5% | 9.4% |
| New Brunswick, NJ | $425,000 | 0.0% | 13.0% |
| New Haven, CT | $269,800 | -0.1% | 10.1% |
| New Orleans, LA | $285,000 | 2.6% | 13.8% |
| New York, NY | $670,000 | 1.7% | 11.7% |
| Newark, NJ | $450,000 | 0.0% | 9.8% |
| North Port, FL | $425,000 | -0.1% | 28.8% |
| Oakland, CA | $925,000 | 7.9% | 12.1% |
| Oklahoma City, OK | $235,000 | 5.1% | 11.6% |
| Omaha, NE | $255,000 | -1.2% | 6.2% |
| Orlando, FL | $360,000 | 2.9% | 20.2% |
| Oxnard, CA | $809,000 | 0.9% | 15.7% |
| Philadelphia, PA | $249,900 | 0.0% | 5.5% |
| Phoenix, AZ | $456,000 | 2.6% | 28.3% |
| Pittsburgh, PA | $199,900 | 0.5% | 3.6% |
| Portland, OR | $525,000 | 1.9% | 12.2% |
| Providence, RI | $381,000 | 1.6% | 17.6% |
| Raleigh, NC | $400,000 | 0.0% | 25.0% |
| Richmond, VA | $320,000 | 4.4% | 6.9% |
| Riverside, CA | $549,000 | 3.6% | 21.0% |
| Rochester, NY | $175,000 | 2.8% | 12.2% |
| Sacramento, CA | $575,000 | 5.5% | 17.5% |
| Salt Lake City, UT | $515,000 | 3.0% | 24.1% |
| San Antonio, TX | $308,000 | 2.7% | 18.0% |
| San Diego, CA | $800,000 | 2.6% | 16.8% |
| San Francisco, CA | $1,525,000 | 8.5% | 10.9% |
| San Jose, CA | $1,450,000 | 6.9% | 20.8% |
| Seattle, WA | $750,500 | 5.7% | 15.0% |
| St. Louis, MO | $215,000 | 0.0% | 7.2% |
| Tacoma, WA | $530,000 | 2.4% | 16.5% |
| Tampa, FL | $351,300 | 3.3% | 27.8% |
| Tucson, AZ | $335,000 | 3.1% | 24.5% |
| Tulsa, OK | $225,000 | 0.0% | 7.1% |
| Honolulu, HI | $675,000 | -6.2% | 5.8% |
| Virginia Beach, VA | $285,000 | 1.8% | 9.7% |
| Warren, MI | $250,000 | 3.1% | 9.2% |
| Washington, D.C. | $495,000 | 5.3% | 10.0% |
| West Palm Beach, FL | $400,000 | 2.6% | 14.3% |
| Worcester, MA | $350,000 | -5.4% | 16.7% |
| National | $389,500 | 3.5% | 16.1% |
Homes Sold
| Redfin Metro | Homes Sold | Month-Over-Month | Year-Over-Year |
|---|---|---|---|
| Albany, NY | 542 | -27.9% | -20.1% |
| Allentown, PA | 520 | -26.0% | -9.2% |
| Anaheim, CA | 1,812 | -2.6% | -21.2% |
| Atlanta, GA | 7,481 | 13.1% | -3.6% |
| Austin, TX | 2,465 | 10.0% | 6.8% |
| Bakersfield, CA | 654 | -4.0% | -5.2% |
| Baltimore, MD | 2,792 | -1.2% | -8.9% |
| Baton Rouge, LA | 951 | 18.9% | 3.0% |
| Birmingham, AL | 1,084 | 4.1% | -15.5% |
| Boston, MA | 2,129 | -28.9% | -15.6% |
| Bridgeport, CT | 775 | -20.1% | -16.8% |
| Buffalo, NY | 686 | -29.9% | -14.9% |
| Camden, NJ | 1,155 | -18.6% | -13.4% |
| Charleston, SC | 1,267 | 3.5% | -19.1% |
| Charlotte, NC | 3,434 | 1.7% | 4.2% |
| Chicago, IL | 5,949 | -4.8% | -0.7% |
| Cincinnati, OH | 1,902 | -1.7% | -7.6% |
| Cleveland, OH | 1,721 | -10.9% | -8.1% |
| Columbus, OH | 1,863 | 4.0% | -0.4% |
| Dallas, TX | 4,394 | 5.2% | -1.3% |
| Dayton, OH | 736 | -8.9% | -4.7% |
| Denver, CO | 3,373 | 13.3% | -13.1% |
| Detroit, MI | 1,347 | -7.7% | -7.4% |
| El Paso, TX | 738 | 7.3% | 3.2% |
| Elgin, IL | 651 | 0.5% | -6.7% |
| Fort Lauderdale, FL | 2,766 | 0.9% | -8.1% |
| Fort Worth, TX | 2,273 | -0.8% | 5.5% |
| Frederick, MD | 1,099 | -3.3% | -14.3% |
| Fresno, CA | 609 | 31.0% | 7.6% |
| Grand Rapids, MI | 757 | -11.0% | -15.7% |
| Greensboro, NC | 756 | -7.0% | -7.4% |
| Greenville, SC | 1,004 | 3.5% | 5.6% |
| Hartford, CT | 913 | -22.4% | -9.5% |
| Houston, TX | 7,608 | 14.0% | 22.4% |
| Indianapolis, IN | 2,307 | 5.4% | 0.3% |
| Jacksonville, FL | 2,385 | 4.6% | -9.4% |
| Kansas City, MO | 2,087 | -1.8% | -6.8% |
| Knoxville, TN | 901 | -5.2% | -11.6% |
| Lake County, IL | 767 | -6.0% | -11.7% |
| Las Vegas, NV | 3,280 | -2.7% | -8.1% |
| Los Angeles, CA | 4,683 | -2.9% | -6.8% |
| Louisville, KY | 1,251 | 5.2% | -0.6% |
| McAllen, TX | 364 | -7.1% | 16.3% |
| Memphis, TN | 1,178 | 4.5% | 6.7% |
| Miami, FL | 2,818 | -1.0% | 4.6% |
| Milwaukee, WI | 1,142 | -5.2% | 0.4% |
| Minneapolis, MN | 2,849 | -9.4% | -14.0% |
| Montgomery County, PA | 1,360 | -20.7% | -8.4% |
| Nashville, TN | 2,739 | 8.3% | -3.3% |
| Nassau County, NY | 2,150 | -17.8% | -15.5% |
| New Brunswick, NJ | 2,079 | -21.5% | -15.1% |
| New Haven, CT | 692 | -16.3% | -8.3% |
| New Orleans, LA | 1,112 | 4.3% | -5.2% |
| New York, NY | 5,393 | -14.9% | 1.2% |
| Newark, NJ | 1,458 | -17.9% | -16.3% |
| North Port, FL | 1,843 | 1.7% | -16.4% |
| Oakland, CA | 1,682 | 5.9% | -10.2% |
| Oklahoma City, OK | 1,592 | -4.2% | 1.7% |
| Omaha, NE | 763 | 2.3% | 3.5% |
| Orlando, FL | 3,782 | 5.5% | -2.1% |
| Oxnard, CA | 523 | 8.3% | -11.4% |
| Philadelphia, PA | 1,764 | -14.2% | 2.0% |
| Phoenix, AZ | 7,596 | 11.8% | 0.3% |
| Pittsburgh, PA | 1,653 | -3.8% | 3.5% |
| Portland, OR | 2,551 | 4.2% | -5.8% |
| Providence, RI | 1,178 | -22.4% | -9.0% |
| Raleigh, NC | 1,827 | 8.2% | -6.6% |
| Richmond, VA | 1,154 | -11.4% | -15.4% |
| Riverside, CA | 4,492 | -1.5% | -1.9% |
| Rochester, NY | 505 | -35.8% | -26.7% |
| Sacramento, CA | 2,029 | 4.3% | 0.1% |
| Salt Lake City, UT | 1,003 | 5.2% | -13.0% |
| San Antonio, TX | 2,393 | 2.8% | 0.1% |
| San Diego, CA | 2,393 | 6.4% | -10.0% |
| San Francisco, CA | 745 | 14.3% | -10.5% |
| San Jose, CA | 953 | 14.0% | -12.2% |
| Seattle, WA | 2,682 | 17.3% | -14.6% |
| St. Louis, MO | 2,440 | -2.5% | -8.0% |
| Tacoma, WA | 935 | 4.8% | -10.2% |
| Tampa, FL | 5,334 | 7.0% | -0.1% |
| Tucson, AZ | 1,463 | 6.3% | 3.5% |
| Tulsa, OK | 1,069 | -3.6% | 9.5% |
| Honolulu, HI | 723 | -15.4% | 3.7% |
| Virginia Beach, VA | 2,095 | 4.6% | 1.3% |
| Warren, MI | 2,300 | -9.2% | -10.5% |
| Washington, D.C. | 4,693 | 7.8% | -10.2% |
| West Palm Beach, FL | 2,579 | 5.2% | -13.1% |
| Worcester, MA | 600 | -24.2% | -13.4% |
| National | 594,300 | -7.0% | -6.1% |
New Listings
| Redfin Metro | New Listings | Month-Over-Month | Year-Over-Year |
|---|---|---|---|
| Albany, NY | 725 | 16.7% | -2.3% |
| Allentown, PA | 376 | -19.7% | -40.9% |
| Anaheim, CA | 2,516 | 20.6% | -13.9% |
| Atlanta, GA | 8,258 | 5.7% | -8.9% |
| Austin, TX | 2,747 | 9.8% | 10.0% |
| Bakersfield, CA | 824 | 5.8% | 3.6% |
| Baltimore, MD | 3,196 | 11.7% | -4.9% |
| Birmingham, AL | 1,220 | 1.8% | -18.2% |
| Boston, MA | 3,403 | 27.2% | -9.0% |
| Bridgeport, CT | 1,018 | 27.7% | -12.5% |
| Buffalo, NY | 671 | 5.2% | -5.6% |
| Camden, NJ | 1,396 | 13.1% | -8.2% |
| Charleston, SC | 1,497 | 12.4% | -7.8% |
| Charlotte, NC | 3,006 | 4.2% | -22.7% |
| Chicago, IL | 8,346 | 18.3% | -4.4% |
| Cincinnati, OH | 2,073 | 1.3% | -5.3% |
| Cleveland, OH | 1,971 | 4.1% | -12.6% |
| Columbus, OH | 1,970 | -1.6% | -1.1% |
| Dallas, TX | 4,745 | 0.2% | 2.9% |
| Dayton, OH | 784 | -0.4% | -5.4% |
| Denver, CO | 3,981 | 18.2% | -7.3% |
| Detroit, MI | 1,696 | 4.4% | 14.6% |
| El Paso, TX | 799 | -8.8% | -20.3% |
| Elgin, IL | 812 | 8.7% | -9.7% |
| Fort Lauderdale, FL | 3,145 | 1.5% | -17.0% |
| Fort Worth, TX | 2,275 | -9.0% | 2.9% |
| Frederick, MD | 1,329 | 26.8% | -0.1% |
| Fresno, CA | 723 | 11.6% | -0.3% |
| Grand Rapids, MI | 837 | 9.4% | -11.0% |
| Greensboro, NC | 483 | -15.9% | -38.5% |
| Greenville, SC | 1,151 | 14.8% | -0.6% |
| Hartford, CT | 1,086 | 14.6% | -5.6% |
| Houston, TX | 8,825 | 0.3% | 17.1% |
| Indianapolis, IN | 2,402 | -1.8% | 6.4% |
| Jacksonville, FL | 2,576 | -0.3% | -12.5% |
| Kansas City, MO | 2,516 | 11.2% | 1.1% |
| Knoxville, TN | 843 | 6.6% | -20.2% |
| Lake County, IL | 931 | 21.1% | -18.3% |
| Las Vegas, NV | 3,798 | 6.0% | -2.8% |
| Los Angeles, CA | 6,236 | 8.5% | -10.8% |
| Louisville, KY | 1,350 | 7.1% | 6.6% |
| McAllen, TX | 489 | -0.6% | 3.2% |
| Memphis, TN | 1,298 | -3.9% | 17.5% |
| Miami, FL | 3,732 | 2.7% | -5.6% |
| Milwaukee, WI | 1,421 | 11.4% | 0.5% |
| Minneapolis, MN | 4,096 | 30.9% | -9.7% |
| Montgomery County, PA | 1,837 | 22.1% | 2.3% |
| Nashville, TN | 2,758 | 8.4% | -13.1% |
| Nassau County, NY | 2,439 | 12.0% | 1.2% |
| New Brunswick, NJ | 2,747 | 14.3% | -1.2% |
| New Haven, CT | 821 | 16.8% | -10.1% |
| New Orleans, LA | 1,346 | 2.0% | -5.3% |
| New York, NY | 7,610 | 12.0% | 19.1% |
| Newark, NJ | 2,061 | 27.2% | 8.4% |
| North Port, FL | 2,243 | -1.1% | -6.7% |
| Oakland, CA | 2,634 | 30.3% | -0.8% |
| Oklahoma City, OK | 1,704 | -5.7% | 8.7% |
| Omaha, NE | 937 | 23.3% | 1.3% |
| Orlando, FL | 4,270 | 5.4% | 2.9% |
| Oxnard, CA | 684 | 8.7% | -8.8% |
| Philadelphia, PA | 2,448 | 20.1% | 15.6% |
| Phoenix, AZ | 7,731 | -3.7% | -8.0% |
| Pittsburgh, PA | 1,898 | 13.7% | 3.3% |
| Portland, OR | 3,081 | 16.0% | 5.2% |
| Providence, RI | 1,332 | 5.7% | -4.1% |
| Raleigh, NC | 1,886 | 12.9% | -18.3% |
| Richmond, VA | 1,572 | 18.6% | 3.0% |
| Riverside, CA | 5,428 | 4.9% | 0.3% |
| Rochester, NY | 715 | 10.5% | 0.8% |
| Sacramento, CA | 2,526 | 23.5% | 1.9% |
| San Antonio, TX | 2,827 | 2.0% | 16.6% |
| San Diego, CA | 2,814 | 3.8% | -10.8% |
| San Francisco, CA | 1,146 | 15.6% | -12.9% |
| San Jose, CA | 1,498 | 28.9% | -8.3% |
| Seattle, WA | 3,904 | 38.5% | 3.0% |
| St. Louis, MO | 2,451 | -1.6% | 0.1% |
| Tacoma, WA | 1,350 | 39.0% | 7.3% |
| Tampa, FL | 5,562 | -2.2% | -4.8% |
| Tucson, AZ | 1,498 | 2.2% | -11.4% |
| Tulsa, OK | 1,117 | -6.1% | 13.1% |
| Honolulu, HI | 784 | -3.0% | -10.1% |
| Virginia Beach, VA | 2,432 | 17.8% | 0.2% |
| Warren, MI | 2,572 | 0.2% | -0.2% |
| Washington, D.C. | 5,821 | 32.9% | -3.4% |
| West Palm Beach, FL | 3,189 | -3.5% | -11.7% |
| Worcester, MA | 717 | 22.8% | 0.6% |
| National | 628,700 | -0.4% | -0.9% |
All Homes for Sale
| Redfin Metro | All Homes for Sale | Month-Over-Month | Year-Over-Year |
|---|---|---|---|
| Albany, NY | 1,881 | -8.4% | -21.3% |
| Allentown, PA | 936 | -18.8% | -41.5% |
| Anaheim, CA | 4,665 | 13.5% | -35.3% |
| Atlanta, GA | 17,444 | -1.9% | -17.5% |
| Austin, TX | 5,695 | -5.2% | 2.4% |
| Bakersfield, CA | 1,679 | 0.1% | -12.3% |
| Baltimore, MD | 6,898 | -2.5% | -10.5% |
| Birmingham, AL | 3,189 | -2.8% | -32.3% |
| Boston, MA | 6,469 | 14.0% | -25.3% |
| Bridgeport, CT | 2,854 | 0.4% | -35.4% |
| Buffalo, NY | 1,367 | -5.3% | -14.0% |
| Camden, NJ | 3,161 | -0.7% | -16.9% |
| Charleston, SC | 3,849 | 3.2% | -26.5% |
| Charlotte, NC | 7,256 | -6.6% | -31.3% |
| Chicago, IL | 24,754 | 19.0% | 5.2% |
| Cincinnati, OH | 5,793 | -2.1% | -12.3% |
| Cleveland, OH | 5,005 | -7.9% | -18.8% |
| Columbus, OH | 5,016 | -1.4% | -7.0% |
| Dallas, TX | 9,343 | -6.9% | -24.7% |
| Dayton, OH | 1,791 | -9.3% | -14.4% |
| Denver, CO | 5,411 | 4.8% | -22.0% |
| Detroit, MI | 4,457 | 2.3% | 8.4% |
| El Paso, TX | 1,942 | -6.3% | -29.1% |
| Elgin, IL | 2,221 | 25.2% | 21.9% |
| Fort Lauderdale, FL | 9,276 | -2.3% | -37.9% |
| Fort Worth, TX | 4,807 | -9.3% | -16.6% |
| Frederick, MD | 2,402 | 2.9% | -18.2% |
| Fresno, CA | 1,274 | 0.2% | -6.9% |
| Grand Rapids, MI | 1,413 | -4.3% | -24.2% |
| Greensboro, NC | 1,347 | -16.8% | -42.6% |
| Greenville, SC | 2,881 | -1.3% | -25.8% |
| Hartford, CT | 2,705 | -6.6% | -29.6% |
| Houston, TX | 21,571 | -4.9% | -6.8% |
| Indianapolis, IN | 4,340 | -10.0% | -11.2% |
| Jacksonville, FL | 5,695 | -6.5% | -23.7% |
| Kansas City, MO | 5,209 | -1.6% | -16.2% |
| Knoxville, TN | 2,466 | -5.0% | -31.6% |
| Lake County, IL | 2,640 | 18.0% | -3.6% |
| Las Vegas, NV | 8,027 | -1.4% | -18.4% |
| Los Angeles, CA | 14,459 | 3.9% | -25.5% |
| Louisville, KY | 2,917 | -6.1% | -16.4% |
| McAllen, TX | 1,623 | -3.2% | -17.4% |
| Memphis, TN | 3,010 | -2.6% | -13.0% |
| Miami, FL | 12,822 | -4.5% | -26.7% |
| Milwaukee, WI | 4,097 | -2.1% | -5.6% |
| Minneapolis, MN | 8,245 | 7.7% | -11.2% |
| Montgomery County, PA | 3,558 | 1.7% | -18.2% |
| Nashville, TN | 5,982 | -0.1% | -26.4% |
| Nassau County, NY | 6,474 | 4.0% | -25.5% |
| New Brunswick, NJ | 7,148 | 1.6% | -8.4% |
| New Haven, CT | 2,192 | -7.0% | -26.1% |
| New Orleans, LA | 3,086 | -5.0% | -25.2% |
| New York, NY | 28,390 | 0.5% | -10.3% |
| Newark, NJ | 5,243 | 7.9% | -17.3% |
| North Port, FL | 3,576 | -4.8% | -33.2% |
| Oakland, CA | 3,950 | 29.3% | -7.0% |
| Oklahoma City, OK | 3,496 | -13.3% | -8.5% |
| Omaha, NE | 1,473 | 4.2% | -17.5% |
| Orlando, FL | 7,463 | -4.0% | -27.4% |
| Oxnard, CA | 1,439 | 7.5% | -17.6% |
| Philadelphia, PA | 6,821 | 0.1% | -1.9% |
| Phoenix, AZ | 16,272 | -3.8% | -9.9% |
| Pittsburgh, PA | 7,196 | -2.3% | -2.5% |
| Portland, OR | 4,910 | 4.1% | -8.7% |
| Providence, RI | 2,986 | -5.5% | -23.9% |
| Raleigh, NC | 3,814 | -4.6% | -36.3% |
| Richmond, VA | 2,602 | 7.2% | -23.0% |
| Riverside, CA | 11,904 | 0.6% | -10.9% |
| Rochester, NY | 1,280 | 0.9% | -18.1% |
| Sacramento, CA | 4,120 | 8.4% | -2.4% |
| San Antonio, TX | 6,624 | -7.1% | -11.0% |
| San Diego, CA | 4,538 | 6.0% | -22.3% |
| San Francisco, CA | 2,265 | 14.2% | -25.6% |
| San Jose, CA | 2,145 | 31.3% | -30.4% |
| Seattle, WA | 4,948 | 28.7% | -18.6% |
| St. Louis, MO | 5,938 | -7.4% | -15.4% |
| Tacoma, WA | 1,828 | 18.2% | -1.0% |
| Tampa, FL | 9,288 | -8.8% | -25.2% |
| Tucson, AZ | 3,949 | -3.9% | -7.7% |
| Tulsa, OK | 2,177 | -10.8% | -11.9% |
| Honolulu, HI | 2,737 | -4.6% | -21.0% |
| Virginia Beach, VA | 4,641 | 1.8% | -18.0% |
| Warren, MI | 5,448 | -0.8% | -6.9% |
| Washington, D.C. | 11,651 | 5.0% | -14.4% |
| West Palm Beach, FL | 8,507 | -1.6% | -37.0% |
| Worcester, MA | 1,488 | 0.5% | -13.1% |
| National | 1,340,300 | -1.5% | -13.8% |
Median Off-Market Redfin Estimate
| Redfin Metro | Estimate | Month-Over-Month | Year-Over-Year |
|---|---|---|---|
| Albany, NY | $224,500 | -1.4% | 5.1% |
| Allentown, PA | $274,600 | 1.1% | 18.6% |
| Anaheim, CA | $983,500 | 1.7% | 25.3% |
| Atlanta, GA | $328,400 | 1.6% | 28.9% |
| Austin, TX | $472,100 | 1.0% | 42.2% |
| Bakersfield, CA | $264,300 | 1.4% | 23.6% |
| Baltimore, MD | $335,500 | 0.5% | 14.8% |
| Baton Rouge, LA | $149,000 | 0.2% | 8.1% |
| Birmingham, AL | $169,900 | 1.0% | 16.1% |
| Boston, MA | $626,300 | 0.7% | 11.7% |
| Bridgeport, CT | $470,300 | 0.4% | 13.6% |
| Buffalo, NY | $190,600 | 1.1% | 16.4% |
| Camden, NJ | $280,200 | 0.7% | 22.4% |
| Charleston, SC | $316,400 | 1.7% | 23.5% |
| Charlotte, NC | $305,100 | 1.5% | 28.8% |
| Chicago, IL | $285,500 | 0.5% | 4.6% |
| Cincinnati, OH | $214,100 | 0.7% | 18.8% |
| Cleveland, OH | $177,500 | 0.9% | 15.7% |
| Columbus, OH | $253,200 | 0.8% | 17.0% |
| Dallas, TX | $356,800 | 1.6% | 28.7% |
| Dayton, OH | $161,800 | 0.6% | 18.9% |
| Denver, CO | $543,800 | 1.2% | 22.9% |
| Detroit, MI | $130,200 | 1.2% | 15.0% |
| Elgin, IL | $268,100 | 0.5% | 9.9% |
| Fort Lauderdale, FL | $353,400 | 1.5% | 20.4% |
| Fort Worth, TX | $302,000 | 1.4% | 27.3% |
| Frederick, MD | $507,000 | 0.6% | 14.8% |
| Fresno, CA | $357,700 | 0.9% | 25.0% |
| Grand Rapids, MI | $235,200 | 0.8% | 22.7% |
| Greensboro, NC | $184,600 | 0.9% | 20.4% |
| Greenville, SC | $214,300 | 1.0% | 22.5% |
| Hartford, CT | $273,300 | 0.4% | 15.7% |
| Houston, TX | $262,100 | 1.0% | 22.4% |
| Indianapolis, IN | $220,400 | 1.0% | 21.6% |
| Jacksonville, FL | $296,500 | 1.8% | 28.4% |
| Kansas City, MO | $240,400 | 0.7% | 21.1% |
| Knoxville, TN | $248,100 | 0.9% | 26.3% |
| Lake County, IL | $253,300 | 0.4% | 9.8% |
| Las Vegas, NV | $388,300 | 2.0% | 28.2% |
| Los Angeles, CA | $824,700 | 0.8% | 18.2% |
| Louisville, KY | $203,100 | 0.6% | 6.5% |
| Memphis, TN | $193,000 | 1.1% | 17.1% |
| Miami, FL | $408,500 | 1.2% | 21.4% |
| Milwaukee, WI | $255,500 | 0.3% | 15.2% |
| Minneapolis, MN | $336,300 | 0.7% | 15.0% |
| Montgomery County, PA | $410,000 | 0.6% | 17.1% |
| Nashville, TN | $384,400 | 1.8% | 28.9% |
| Nassau County, NY | $600,000 | 0.5% | 13.2% |
| New Brunswick, NJ | $452,200 | 0.9% | 19.4% |
| New Haven, CT | $281,300 | 0.5% | 17.8% |
| New Orleans, LA | $201,200 | 0.5% | 9.8% |
| Newark, NJ | $451,500 | 0.3% | 11.4% |
| North Port, FL | $353,000 | 3.4% | 37.9% |
| Oakland, CA | $1,023,000 | 1.0% | 21.4% |
| Oklahoma City, OK | $184,500 | 0.7% | 17.1% |
| Omaha, NE | $238,900 | 0.7% | 16.3% |
| Orlando, FL | $322,400 | 1.8% | 27.7% |
| Oxnard, CA | $790,100 | 0.8% | 22.2% |
| Philadelphia, PA | $232,700 | 0.3% | 10.8% |
| Phoenix, AZ | $424,700 | 1.7% | 38.4% |
| Pittsburgh, PA | $160,000 | 0.2% | 8.2% |
| Portland, OR | $516,300 | 0.9% | 20.3% |
| Providence, RI | $382,300 | 0.8% | 17.4% |
| Raleigh, NC | $364,700 | 2.0% | 31.4% |
| Richmond, VA | $291,700 | 1.1% | 14.0% |
| Riverside, CA | $481,400 | 1.0% | 30.2% |
| Rochester, NY | $178,700 | 1.0% | 14.9% |
| Sacramento, CA | $563,000 | 0.5% | 25.0% |
| Salt Lake City, UT | $515,800 | 1.3% | 31.7% |
| San Antonio, TX | $244,000 | 1.1% | 22.6% |
| San Diego, CA | $837,600 | 1.3% | 26.7% |
| San Francisco, CA | $1,549,800 | 0.3% | 14.0% |
| San Jose, CA | $1,520,100 | 1.6% | 24.1% |
| Seattle, WA | $756,200 | 1.5% | 23.0% |
| St. Louis, MO | $184,500 | 0.4% | 8.6% |
| Tacoma, WA | $508,600 | 0.7% | 23.2% |
| Tampa, FL | $311,300 | 2.4% | 28.8% |
| Tucson, AZ | $284,800 | 1.3% | 25.0% |
| Tulsa, OK | $162,000 | 0.6% | 12.9% |
| Honolulu, HI | $865,000 | 1.0% | 18.4% |
| Virginia Beach, VA | $287,000 | 0.8% | 14.1% |
| Warren, MI | $259,400 | 0.4% | 13.9% |
| Washington, D.C. | $489,100 | 0.6% | 14.0% |
| West Palm Beach, FL | $384,000 | 1.9% | 29.4% |
| Worcester, MA | $360,200 | 0.5% | 17.4% |
| National | $406,500 | 3.7% | 20.7% |


