
The mother of all inventory crunches intensifies as a 12% jump in new listings was dwarfed by a 36% gain in pending sales.
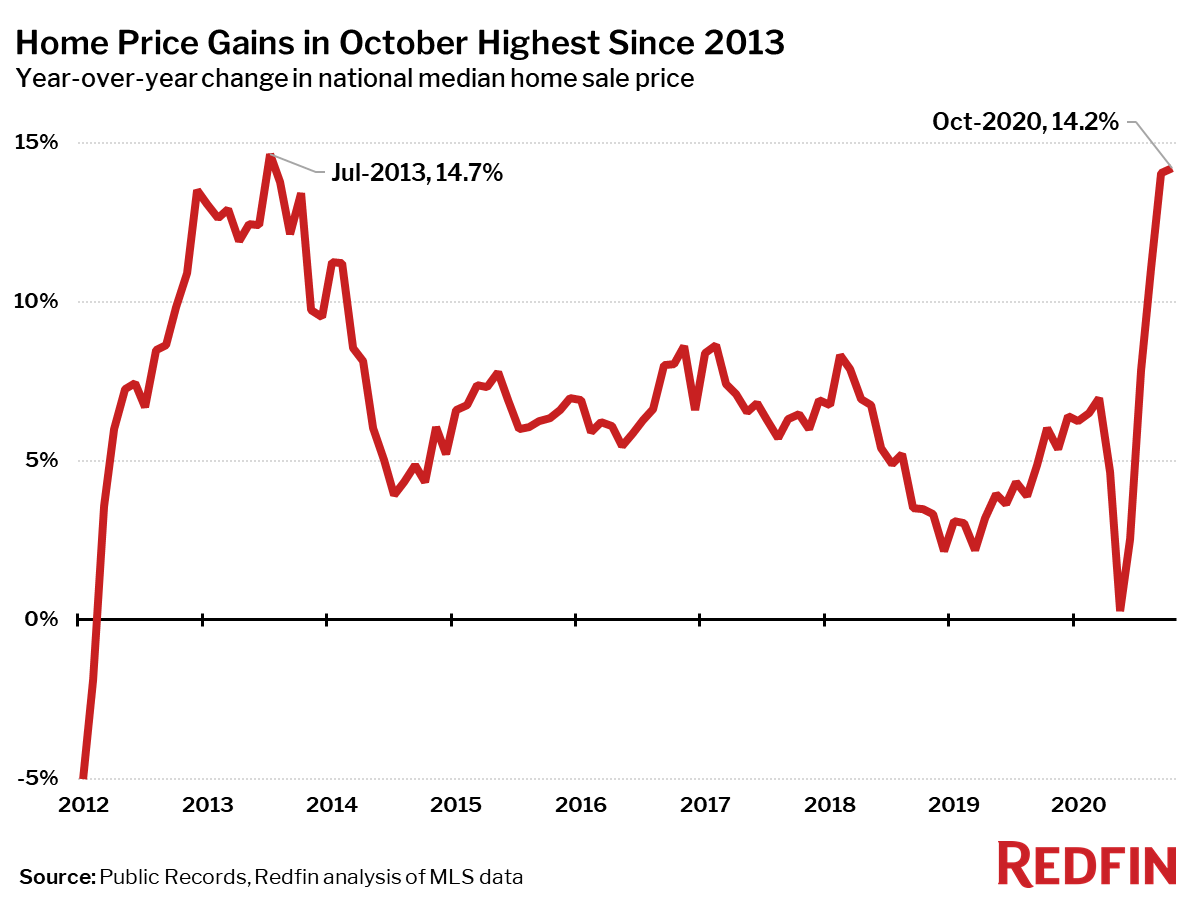
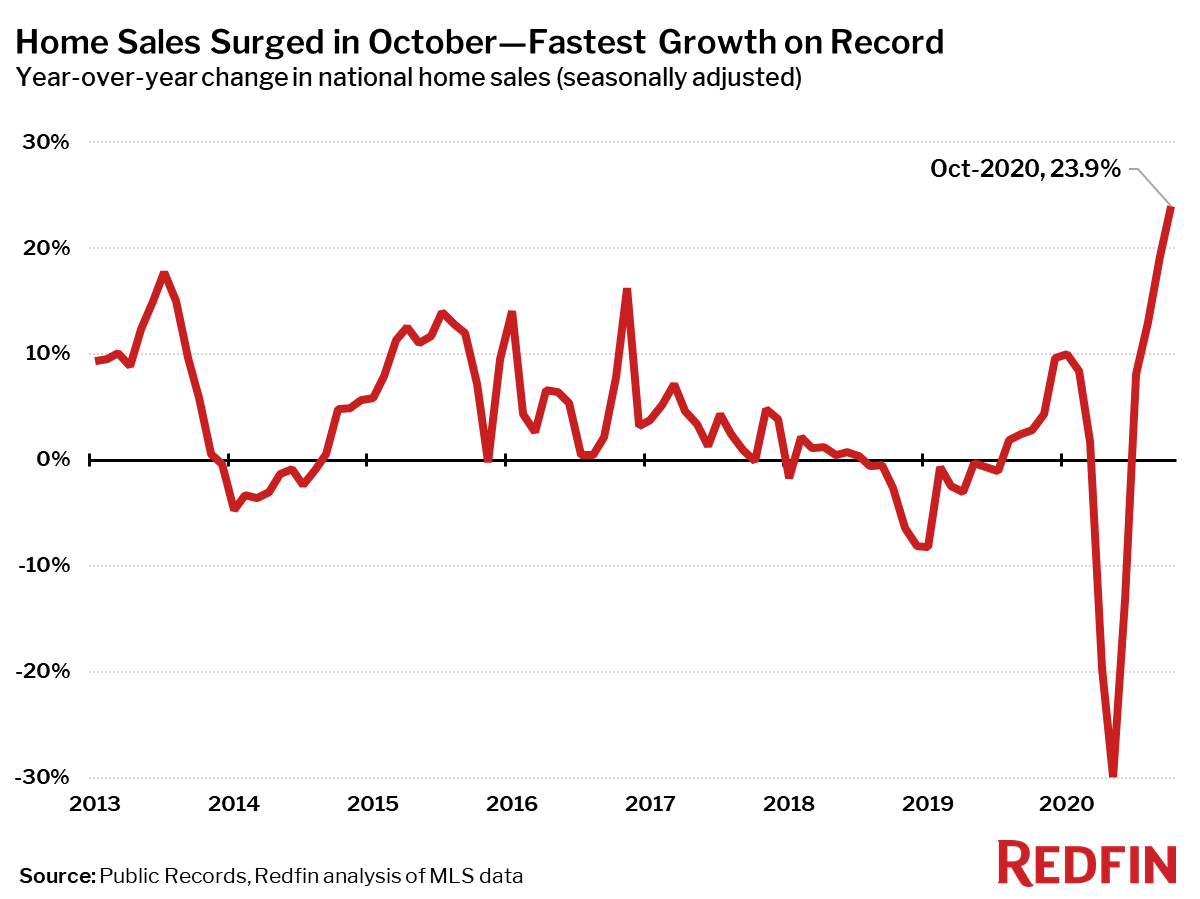
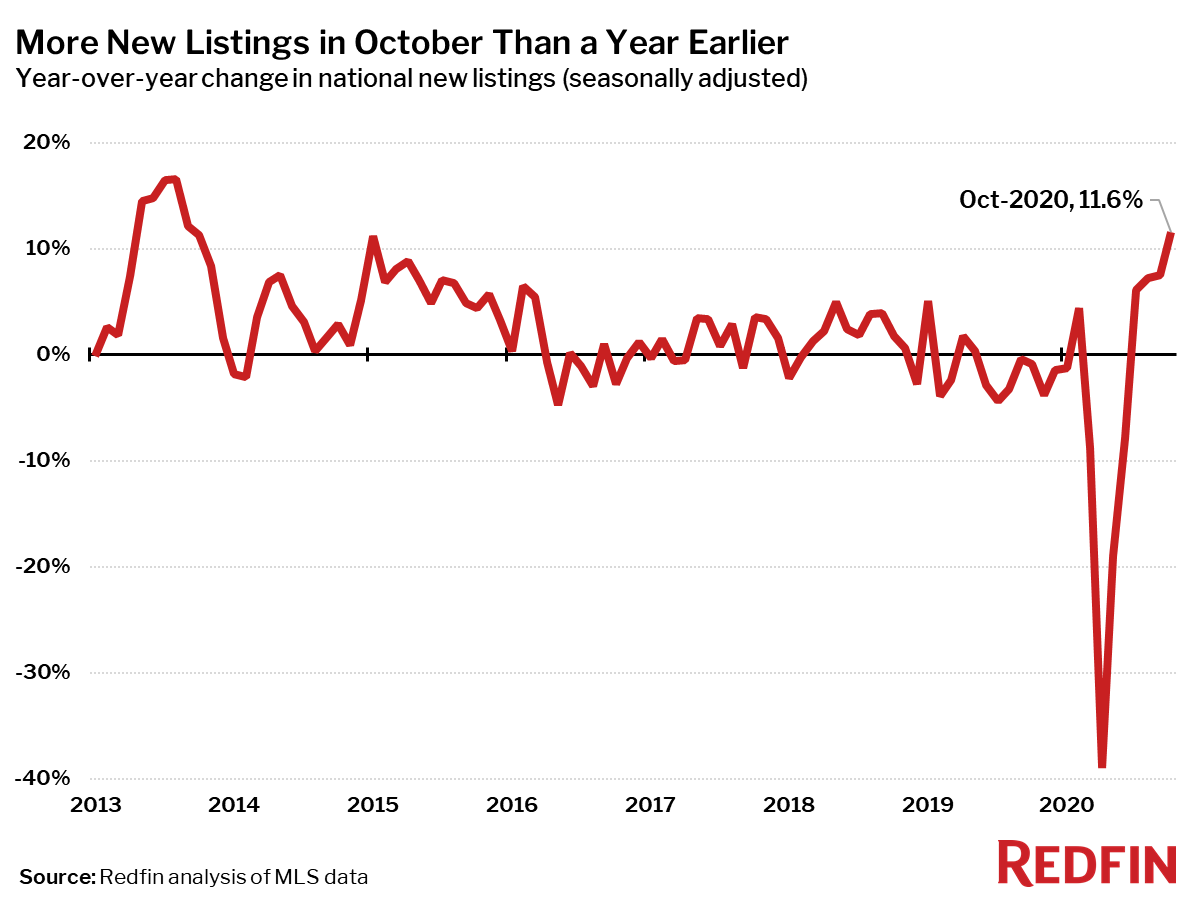
The national median home price rose 14.2% year over year to $335,900 in October—the second-largest annual increase on record as far back as our data goes (2012), bested only by a 14.7% gain in July 2013. These near-record gains are fueled by an extreme imbalance between homebuying demand and the supply of homes for sale. Home sales surged 24% from a year earlier—the largest gain on record—while new listings were up just 12%.
“October very well may have been the hottest the housing market gets this year,” said Redfin chief economist Daryl Fairweather. “Buyers who stepped away from the market at the beginning of the pandemic had been making up for lost time, which sent prices skyrocketing. But given that we are entering a winter wave of the pandemic, housing demand will likely lose a bit of steam until 2021, cooling the market from red-hot to just hot. If you are a seller, it’s probably a good idea to wait until the new year to list your home, but if you are a buyer, right now is a short window of opportunity where competition likely won’t be as intense as it was in October.”
“The market has definitely slowed in just the last couple of weeks, said Atlanta Redfin real estate agent Ronisha Carson. “Affordable homes are still seeing multiple offers, but more expensive listings are receiving less interest from buyers. Even though homebuying activity has slowed down, I have had three sellers reach out to me just this week to get on the market. Last year we saw a spike in demand in January, and I think we will see that again in 2021.”
Median prices increased in all but one of the 85 largest metro areas Redfin tracks. The only metro area where prices fell from a year earlier was Honolulu (-0.8%). The largest price increases were in Bridgeport, CT (+39%), Memphis, TN (+30%) and Newark, NJ (+24%).
It’s likely that the big price gains in Bridgeport and Newark are due to the rush of people moving out of New York City in search of more space now that remote work has become more commonplace.
| Market Summary | October 2020 | Month-Over-Month | Year-Over-Year |
|---|---|---|---|
| Median sale price | $335,900 | 0.9% | 14.2% |
| Homes sold, seasonally-adjusted | 657,900 | 3.8% | 23.9% |
| Pending sales, seasonally-adjusted | 617,700 | 4.2% | 36.1% |
| New listings, seasonally-adjusted | 691,200 | 2.7% | 11.6% |
| All Homes for sale, seasonally-adjusted | 1,658,700 | -1.4% | -22.1% |
| Median days on market | 28 | -1 | -15 |
| Months of supply | 1.5 | -0.1 | -1.4 |
| Sold above list | 34.8% | 0.7 pts† | 12.7 pts† |
| Median Off-Market Redfin Estimate | $325,800 | 1.5% | 6.2% |
| Average Sale-to-list | 99.5% | 0.1 pts† | 1.3 pts† |
Home sales were up 24% in October from a year earlier on a seasonally-adjusted basis, the largest increase on record (this Redfin data series goes back through 2012).
The number of homes sold in October was up from a year earlier in all 85 of the largest metro areas. The largest gains in sales were in Bridgeport, CT (+71%), Elgin, IL (+54%) and New Haven, CT (+54%). The smallest increase in the number of homes sold was in Honolulu (+4%).
Active listings—the count of all homes that were for sale at any time during the month—fell 22% year over year to their lowest level on record in October, the 15th-straight month of declines.

Only three of the 85 largest metros tracked by Redfin posted a year-over-year increase in the count of seasonally-adjusted active listings of homes for sale: San Francisco (+48%), New York City (+25%) and San Jose, CA (+4%). The number of homes for sale are building up in these markets thanks to big gains in new listings (all over 40% year over year) coupled with more mild increases in home sales.
Compared to a year ago, the biggest declines in active housing supply in October were in Allentown, PA (-50%), Kansas City, MO (-49%) and Salt Lake City (-49%).
The number of new listings of homes for sale increased 12% in October from a year earlier, The largest year-over-year increase since September 2013. However, the increase in new listings was dwarfed by the increase in pending sales, which were up 36% from October 2019.
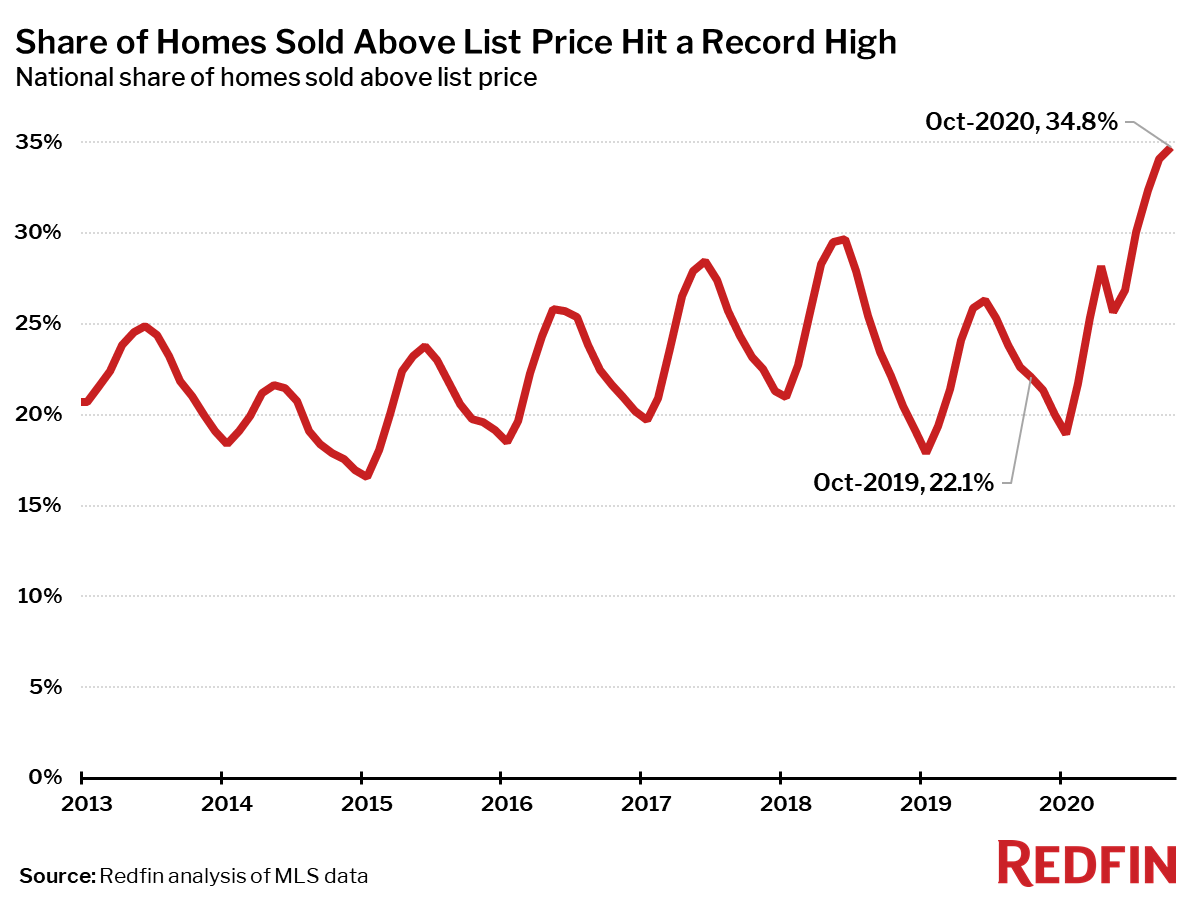
Measures of competition such as time on market and the share of homes sold above list price hit new records in October as they once again bucked the usual seasonal trend. This ongoing market dynamic is the result of a severe imbalance between the number of homebuyers and sellers in the market.
The typical home that sold in October went under contract in 28 days—16 days less than a year earlier, and a new all-time low.

Typically by this time of year, the market is well into a seasonal pattern where homes spend more time on the market and the share of homes that sell above list price declines. This year, seasonality has been out the window as the market stays hot despite the ongoing pandemic and recession.
In October 35% of homes sold above list price—the highest level in our data, which goes back through 2012—up from 22% a year earlier.
Other October Highlights
Competition
- Tacoma, WA was the fastest market, with half of all homes pending sale in just 6 days, down from 18 days a year earlier. Indianapolis and Grand Rapids, MI were the next fastest markets with 7 and 7 median days on market, followed by Seattle (7) and Denver (8).
- The most competitive market in October was Oakland, CA where 70.0% of homes sold above list price, followed by 61.0% in San Jose, CA, 60.4% in Rochester, NY, 58.2% in Worcester, MA, and 56.8% in Tacoma, WA.
Prices
- Bridgeport, CT had the nation’s highest price growth, rising 39.4% since last year to $490,000. Memphis, TN had the second highest growth at 30.1% year-over-year price growth, followed by Newark, NJ (23.5%), Dayton, OH (20.8%), and Camden, NJ (20.5%).
- Only one metro saw price declines in October: Honolulu, HI (-0.8%).
Sales
- Bridgeport, CT led the nation in year-over-year sales growth, up 71.3%, followed by Elgin, IL, up 54.0%. New Haven, CT rounded out the top three with sales up 53.9% from a year ago.
- None of the largest metro areas saw year-over-year declines in home sales in October.
Inventory
- San Francisco had the highest increase in the number of homes for sale, up 48.4% year over year, followed by New York (25.4%) and San Jose, CA (3.7%).
- Allentown, PA had the largest decrease in overall active listings, falling 50.2% since last October. Kansas City, MO (-49.4%), Salt Lake City (-49.1%), and Baton Rouge, LA (-46.0%) also saw far fewer homes available on the market than a year ago.
Redfin Estimate
- Miami (89.2%) had the largest share of homes predicted to sell for below list price, according to Redfin Estimate data, followed by Fort Lauderdale, FL (85.2%) and West Palm Beach, FL (84.8%).
- Oakland, CA (90.9%) had the largest share of homes predicted to sell at or above list price, followed by San Jose, CA (88.8%) and San Francisco (85.7%).
Below are market-by-market breakdowns for prices, inventory, new listings and sales for markets with populations of 750,000 or more. For downloadable data on all of the markets Redfin tracks, visit the Redfin Data Center.
Median Sale Price
| Redfin Metro | Median Sale Price | Month-Over-Month | Year-Over-Year |
|---|---|---|---|
| Albany, NY | $245,000 | -1.6% | 13.6% |
| Allentown, PA | $245,000 | 2.7% | 15.6% |
| Anaheim, CA | $795,000 | 1.9% | 12.0% |
| Atlanta, GA | $285,000 | 1.8% | 16.3% |
| Austin, TX | $368,000 | 3.7% | 13.2% |
| Bakersfield, CA | $282,300 | 3.7% | 13.0% |
| Baltimore, MD | $320,000 | 0.0% | 14.3% |
| Baton Rouge, LA | $233,200 | 3.7% | 11.1% |
| Birmingham, AL | $237,700 | -3.0% | 16.7% |
| Boston, MA | $550,000 | -1.8% | 13.4% |
| Bridgeport, CT | $490,000 | -1.1% | 39.4% |
| Buffalo, NY | $186,000 | -1.9% | 14.1% |
| Camden, NJ | $235,000 | 0.0% | 20.5% |
| Charleston, SC | $325,000 | 3.2% | 16.1% |
| Charlotte, NC | $297,000 | 0.6% | 14.2% |
| Chicago, IL | $275,000 | -0.9% | 14.4% |
| Cincinnati, OH | $216,000 | -0.1% | 19.2% |
| Cleveland, OH | $177,000 | 1.1% | 12.7% |
| Columbus, OH | $250,000 | 0.8% | 16.3% |
| Dallas, TX | $324,900 | 1.5% | 12.4% |
| Dayton, OH | $169,000 | -0.5% | 20.8% |
| Denver, CO | $470,000 | 3.3% | 12.2% |
| Detroit, MI | $160,000 | -3.0% | 14.3% |
| El Paso, TX | $183,400 | 0.5% | 12.7% |
| Elgin, IL | $256,600 | 2.6% | 11.6% |
| Fort Lauderdale, FL | $305,000 | -1.6% | 11.5% |
| Fort Worth, TX | $273,000 | 2.6% | 9.6% |
| Frederick, MD | $449,900 | 2.2% | 9.7% |
| Fresno, CA | $328,000 | 2.5% | 17.1% |
| Grand Rapids, MI | $237,800 | -3.0% | 14.6% |
| Greensboro, NC | $207,000 | 3.7% | 18.3% |
| Greenville, SC | $249,900 | 5.9% | 14.6% |
| Hartford, CT | $260,000 | 2.7% | 16.3% |
| Honolulu, HI | $592,500 | -7.5% | -0.8% |
| Houston, TX | $266,100 | 1.2% | 10.9% |
| Indianapolis, IN | $220,000 | -1.8% | 15.8% |
| Jacksonville, FL | $264,000 | 1.9% | 10.0% |
| Kansas City, MO | $250,000 | -3.5% | 15.2% |
| Knoxville, TN | $255,000 | 3.0% | 19.6% |
| Lake County, IL | $275,000 | 0.0% | 19.6% |
| Las Vegas, NV | $317,000 | 0.3% | 9.3% |
| Los Angeles, CA | $735,000 | 0.7% | 14.0% |
| Louisville, KY | $227,200 | -0.4% | 15.9% |
| McAllen, TX | $180,100 | -0.3% | 9.2% |
| Memphis, TN | $236,800 | -2.2% | 30.1% |
| Miami, FL | $350,000 | -1.4% | 12.9% |
| Milwaukee, WI | $245,000 | 0.0% | 11.4% |
| Minneapolis, MN | $315,000 | 1.6% | 12.5% |
| Montgomery County, PA | $365,000 | 0.8% | 15.9% |
| Nashville, TN | $336,100 | 2.3% | 12.0% |
| Nassau County, NY | $530,000 | 1.0% | 15.2% |
| New Brunswick, NJ | $383,000 | -0.6% | 16.4% |
| New Haven, CT | $255,000 | -1.9% | 18.6% |
| New Orleans, LA | $255,000 | 3.6% | 13.5% |
| New York, NY | $550,000 | 0.0% | 10.0% |
| Newark, NJ | $432,200 | -0.7% | 23.5% |
| North Port, FL | $325,000 | 8.3% | 20.4% |
| Oakland, CA | $821,000 | -1.7% | 9.8% |
| Oklahoma City, OK | $214,900 | 3.6% | 18.1% |
| Omaha, NE | $232,000 | 1.1% | 7.9% |
| Orlando, FL | $284,000 | 1.4% | 10.5% |
| Oxnard, CA | $691,000 | -1.1% | 12.4% |
| Philadelphia, PA | $242,000 | -1.2% | 19.7% |
| Phoenix, AZ | $339,000 | 2.1% | 17.3% |
| Pittsburgh, PA | $200,000 | -1.0% | 17.6% |
| Portland, OR | $450,000 | 0.4% | 10.6% |
| Providence, RI | $335,000 | -0.6% | 15.5% |
| Raleigh, NC | $315,000 | 0.0% | 6.8% |
| Richmond, VA | $295,500 | 1.9% | 13.7% |
| Riverside, CA | $439,000 | -0.2% | 14.0% |
| Rochester, NY | $176,900 | 1.1% | 17.2% |
| Sacramento, CA | $480,000 | 1.9% | 17.1% |
| Salt Lake City, UT | $385,000 | 0.5% | 12.8% |
| San Antonio, TX | $260,000 | 0.0% | 11.6% |
| San Diego, CA | $660,000 | -0.3% | 11.9% |
| San Francisco, CA | $1,425,000 | -1.7% | 0.0% |
| San Jose, CA | $1,238,000 | 3.2% | 15.7% |
| Seattle, WA | $635,000 | -0.8% | 13.4% |
| St. Louis, MO | $212,200 | -1.3% | 14.1% |
| Tacoma, WA | $426,500 | -2.0% | 15.6% |
| Tampa, FL | $269,900 | 0.0% | 14.9% |
| Tucson, AZ | $265,000 | 1.9% | 13.4% |
| Tulsa, OK | $208,500 | -0.7% | 19.1% |
| Virginia Beach, VA | $265,000 | -1.8% | 12.8% |
| Warren, MI | $245,000 | -1.9% | 12.4% |
| Washington, D.C. | $457,700 | 0.6% | 11.6% |
| West Palm Beach, FL | $334,000 | 4.7% | 19.3% |
| Worcester, MA | $324,900 | -1.5% | 16.1% |
| National | $335,900 | 0.9% | 14.2% |
Homes Sold
| Redfin Metro | Homes Sold | Month-Over-Month | Year-Over-Year |
|---|---|---|---|
| Albany, NY | 1,080 | -3.6% | 13.7% |
| Allentown, PA | 1,142 | -0.1% | 24.0% |
| Anaheim, CA | 3,403 | 1.2% | 30.9% |
| Atlanta, GA | 10,453 | -2.4% | 15.9% |
| Austin, TX | 3,528 | -6.9% | 20.5% |
| Bakersfield, CA | 884 | -4.2% | 10.6% |
| Baltimore, MD | 4,597 | 3.4% | 31.6% |
| Baton Rouge, LA | 1,108 | -5.0% | 27.2% |
| Birmingham, AL | 1,602 | -2.9% | 22.7% |
| Boston, MA | 5,136 | -0.4% | 21.2% |
| Bridgeport, CT | 1,807 | -0.8% | 71.3% |
| Buffalo, NY | 1,422 | 20.8% | 15.9% |
| Camden, NJ | 2,140 | 7.2% | 26.6% |
| Charleston, SC | 1,893 | 1.5% | 50.0% |
| Charlotte, NC | 4,637 | -3.0% | 10.9% |
| Chicago, IL | 10,476 | 0.4% | 33.2% |
| Cincinnati, OH | 3,211 | -0.8% | 13.6% |
| Cleveland, OH | 3,232 | 8.8% | 21.8% |
| Columbus, OH | 3,120 | -3.1% | 18.2% |
| Dallas, TX | 6,503 | -4.3% | 21.0% |
| Dayton, OH | 1,193 | -5.2% | 9.7% |
| Denver, CO | 6,189 | 0.8% | 28.0% |
| Detroit, MI | 2,254 | 6.3% | 13.4% |
| El Paso, TX | 952 | -1.4% | 23.3% |
| Elgin, IL | 1,304 | -4.7% | 54.0% |
| Fort Lauderdale, FL | 3,314 | 5.6% | 16.4% |
| Fort Worth, TX | 3,243 | -3.7% | 15.2% |
| Frederick, MD | 1,884 | 0.6% | 28.4% |
| Fresno, CA | 873 | 7.8% | 4.9% |
| Grand Rapids, MI | 1,658 | -3.5% | 13.3% |
| Greensboro, NC | 1,025 | 2.1% | 8.1% |
| Greenville, SC | 1,336 | -3.4% | 16.9% |
| Hartford, CT | 1,951 | 6.7% | 42.3% |
| Honolulu, HI | 840 | 1.2% | 3.7% |
| Houston, TX | 9,272 | -0.3% | 24.7% |
| Indianapolis, IN | 3,613 | -1.4% | 16.2% |
| Jacksonville, FL | 2,896 | -4.2% | 22.2% |
| Kansas City, MO | 3,679 | -2.6% | 17.2% |
| Knoxville, TN | 1,412 | -1.7% | 14.4% |
| Lake County, IL | 1,566 | -1.3% | 44.2% |
| Las Vegas, NV | 3,965 | 0.0% | 9.3% |
| Los Angeles, CA | 7,018 | 4.0% | 12.1% |
| Louisville, KY | 1,526 | 5.0% | 8.3% |
| McAllen, TX | 333 | -9.5% | 6.4% |
| Memphis, TN | 1,214 | 1.3% | 5.3% |
| Miami, FL | 2,852 | 4.0% | 8.6% |
| Milwaukee, WI | 2,308 | -1.2% | 23.6% |
| Minneapolis, MN | 7,172 | 5.3% | 28.5% |
| Montgomery County, PA | 2,855 | -1.0% | 27.6% |
| Nashville, TN | 4,036 | -4.8% | 11.9% |
| Nassau County, NY | 3,494 | 10.0% | 19.6% |
| New Brunswick, NJ | 4,624 | 8.3% | 41.1% |
| New Haven, CT | 1,397 | 9.3% | 53.9% |
| New Orleans, LA | 1,464 | -6.5% | 12.1% |
| New York, NY | 5,756 | 16.2% | 17.8% |
| Newark, NJ | 2,911 | 0.2% | 29.2% |
| North Port, FL | 2,400 | 3.4% | 34.2% |
| Oakland, CA | 2,820 | -1.3% | 14.2% |
| Oklahoma City, OK | 2,195 | -7.9% | 16.1% |
| Omaha, NE | 1,404 | 0.6% | 17.8% |
| Orlando, FL | 4,341 | 3.4% | 17.0% |
| Oxnard, CA | 922 | -3.2% | 12.2% |
| Philadelphia, PA | 2,622 | 0.3% | 25.9% |
| Phoenix, AZ | 9,319 | 4.6% | 23.4% |
| Pittsburgh, PA | 2,753 | -2.8% | 31.0% |
| Portland, OR | 4,201 | -1.8% | 23.8% |
| Providence, RI | 2,337 | 3.6% | 19.5% |
| Raleigh, NC | 2,744 | 3.0% | 16.5% |
| Richmond, VA | 2,011 | 7.9% | 24.1% |
| Riverside, CA | 6,068 | 3.2% | 20.3% |
| Rochester, NY | 1,280 | -3.4% | 10.0% |
| Sacramento, CA | 3,445 | -3.6% | 20.6% |
| Salt Lake City, UT | 1,872 | -1.1% | 10.2% |
| San Antonio, TX | 3,158 | -7.7% | 11.2% |
| San Diego, CA | 3,739 | -3.2% | 20.0% |
| San Francisco, CA | 1,267 | 11.3% | 18.3% |
| San Jose, CA | 1,604 | 6.9% | 26.8% |
| Seattle, WA | 5,546 | 4.6% | 36.6% |
| St. Louis, MO | 4,288 | -1.0% | 23.2% |
| Tacoma, WA | 1,647 | 1.4% | 19.3% |
| Tampa, FL | 5,963 | 2.5% | 17.7% |
| Tucson, AZ | 1,728 | 6.5% | 20.2% |
| Tulsa, OK | 1,553 | 2.4% | 27.6% |
| Virginia Beach, VA | 2,737 | -3.4% | 19.6% |
| Warren, MI | 4,431 | -5.4% | 18.5% |
| Washington, D.C. | 7,677 | 0.7% | 26.3% |
| West Palm Beach, FL | 3,223 | 4.6% | 24.8% |
| Worcester, MA | 1,331 | 12.5% | 8.0% |
| National | 657,900 | 3.8% | 23.9% |
New Listings
| Redfin Metro | New Listings | Month-Over-Month | Year-Over-Year |
|---|---|---|---|
| Albany, NY | 1,212 | -9.3% | 18.6% |
| Allentown, PA | 594 | -36.9% | -41.5% |
| Anaheim, CA | 3,363 | -5.0% | 28.9% |
| Atlanta, GA | 10,301 | -1.0% | -1.2% |
| Austin, TX | 3,569 | 6.8% | 12.6% |
| Bakersfield, CA | 1,027 | -1.2% | 16.0% |
| Baltimore, MD | 4,957 | 1.7% | 22.0% |
| Baton Rouge, LA | 589 | -29.6% | -39.1% |
| Birmingham, AL | 1,474 | -6.6% | 6.7% |
| Boston, MA | 6,130 | -9.6% | 17.2% |
| Bridgeport, CT | 1,721 | -10.4% | 39.9% |
| Buffalo, NY | 1,178 | -17.2% | 0.0% |
| Camden, NJ | 2,254 | 3.3% | 19.1% |
| Charleston, SC | 1,704 | -2.6% | 7.1% |
| Charlotte, NC | 3,502 | -15.4% | -21.0% |
| Chicago, IL | 10,613 | -13.4% | 14.4% |
| Cincinnati, OH | 3,390 | 1.8% | 17.3% |
| Cleveland, OH | 3,062 | -8.5% | 5.9% |
| Columbus, OH | 3,138 | -3.2% | 4.9% |
| Dallas, TX | 6,486 | -1.4% | 0.4% |
| Dayton, OH | 1,283 | -3.8% | 9.3% |
| Denver, CO | 5,602 | -3.8% | 19.7% |
| Detroit, MI | 2,278 | -8.3% | -5.4% |
| El Paso, TX | 920 | -4.2% | -2.3% |
| Elgin, IL | 1,145 | -7.3% | 11.8% |
| Fort Lauderdale, FL | 3,789 | 3.2% | -2.5% |
| Fort Worth, TX | 3,070 | -4.5% | -4.5% |
| Frederick, MD | 2,198 | 10.3% | 29.1% |
| Fresno, CA | 834 | -11.1% | -0.5% |
| Grand Rapids, MI | 1,641 | 3.3% | 0.9% |
| Greensboro, NC | 628 | -19.0% | -30.3% |
| Greenville, SC | 1,283 | -0.8% | 8.2% |
| Hartford, CT | 2,042 | -2.5% | 31.8% |
| Honolulu, HI | 789 | 1.0% | -16.8% |
| Houston, TX | 10,157 | 5.5% | 13.6% |
| Indianapolis, IN | 3,295 | -7.8% | 2.4% |
| Jacksonville, FL | 3,000 | 6.9% | 0.9% |
| Kansas City, MO | 2,067 | -30.1% | -37.4% |
| Knoxville, TN | 1,345 | 7.2% | 4.0% |
| Lake County, IL | 1,310 | -10.5% | 10.6% |
| Las Vegas, NV | 4,185 | -8.7% | 6.9% |
| Los Angeles, CA | 8,601 | 0.9% | 25.1% |
| Louisville, KY | 1,715 | 6.1% | 11.4% |
| McAllen, TX | 496 | 10.0% | 14.3% |
| Memphis, TN | 1,247 | -0.8% | -3.9% |
| Miami, FL | 3,801 | 0.4% | -10.0% |
| Milwaukee, WI | 2,086 | -12.4% | 13.6% |
| Minneapolis, MN | 6,279 | -14.2% | 18.2% |
| Montgomery County, PA | 2,997 | 3.5% | 22.2% |
| Nashville, TN | 3,831 | -3.9% | -7.7% |
| Nassau County, NY | 3,776 | -9.8% | 20.6% |
| New Brunswick, NJ | 4,253 | -13.2% | 20.9% |
| New Haven, CT | 1,352 | -10.8% | 31.6% |
| New Orleans, LA | 1,507 | 2.1% | 2.6% |
| New York, NY | 9,717 | -11.3% | 40.6% |
| Newark, NJ | 3,137 | -7.5% | 25.6% |
| North Port, FL | 2,499 | 7.1% | 5.0% |
| Oakland, CA | 3,391 | 6.3% | 41.4% |
| Oklahoma City, OK | 2,084 | -6.9% | 0.6% |
| Omaha, NE | 1,272 | -6.0% | 1.6% |
| Orlando, FL | 4,653 | 0.7% | 0.5% |
| Oxnard, CA | 914 | -25.7% | 19.9% |
| Philadelphia, PA | 3,324 | -0.4% | 14.4% |
| Phoenix, AZ | 9,893 | 2.0% | 10.8% |
| Pittsburgh, PA | 2,404 | -13.2% | -0.8% |
| Portland, OR | 3,976 | 5.2% | 29.8% |
| Providence, RI | 2,563 | -3.0% | 14.6% |
| Raleigh, NC | 2,675 | 2.3% | 8.3% |
| Richmond, VA | 1,903 | -6.1% | -1.7% |
| Riverside, CA | 6,316 | -0.5% | 10.7% |
| Rochester, NY | 1,244 | -8.9% | 9.3% |
| Sacramento, CA | 3,592 | 2.5% | 32.8% |
| Salt Lake City, UT | 887 | -39.6% | -45.9% |
| San Antonio, TX | 3,281 | 0.8% | -5.8% |
| San Diego, CA | 3,832 | 3.3% | 15.5% |
| San Francisco, CA | 1,777 | -6.7% | 40.5% |
| San Jose, CA | 1,881 | 6.8% | 48.6% |
| Seattle, WA | 5,134 | -9.0% | 37.8% |
| St. Louis, MO | 2,713 | -28.8% | -28.9% |
| Tacoma, WA | 1,557 | 2.3% | 29.4% |
| Tampa, FL | 6,425 | 9.8% | 6.6% |
| Tucson, AZ | 1,843 | 0.9% | 9.1% |
| Tulsa, OK | 1,472 | -4.4% | 10.7% |
| Virginia Beach, VA | 2,952 | 5.8% | 23.2% |
| Warren, MI | 4,243 | -6.0% | 0.6% |
| Washington, D.C. | 8,678 | 2.5% | 35.7% |
| West Palm Beach, FL | 3,742 | 2.9% | -2.8% |
| Worcester, MA | 1,382 | -5.2% | 16.4% |
| National | 691,200 | 2.7% | 11.6% |
All Homes for Sale
| Redfin Metro | All Homes for Sale | Month-Over-Month | Year-Over-Year |
|---|---|---|---|
| Albany, NY | 3,294 | -3.1% | -26.3% |
| Allentown, PA | 1,700 | -20.1% | -50.2% |
| Anaheim, CA | 9,668 | -4.8% | -12.5% |
| Atlanta, GA | 27,015 | -4.5% | -29.0% |
| Austin, TX | 9,497 | 4.1% | -13.0% |
| Bakersfield, CA | 2,369 | -1.5% | -17.6% |
| Baltimore, MD | 11,370 | -0.1% | -26.3% |
| Baton Rouge, LA | 2,660 | -15.1% | -46.0% |
| Birmingham, AL | 4,930 | -4.3% | -18.9% |
| Boston, MA | 15,148 | 2.3% | -9.1% |
| Bridgeport, CT | 6,776 | -5.8% | -9.0% |
| Buffalo, NY | 2,557 | -12.7% | -31.4% |
| Camden, NJ | 5,370 | 0.0% | -31.0% |
| Charleston, SC | 6,436 | -4.6% | -12.6% |
| Charlotte, NC | 11,520 | -9.4% | -30.0% |
| Chicago, IL | 34,615 | -3.0% | -18.0% |
| Cincinnati, OH | 9,531 | -0.4% | -11.0% |
| Cleveland, OH | 8,250 | -5.3% | -28.4% |
| Columbus, OH | 8,356 | -2.8% | -14.3% |
| Dallas, TX | 18,199 | -6.5% | -28.8% |
| Dayton, OH | 3,108 | -0.2% | -15.7% |
| Denver, CO | 10,749 | -5.4% | -22.0% |
| Detroit, MI | 6,124 | -4.3% | -27.9% |
| El Paso, TX | 2,889 | -5.2% | -23.6% |
| Elgin, IL | 2,805 | -4.9% | -36.3% |
| Fort Lauderdale, FL | 15,457 | -1.7% | -8.8% |
| Fort Worth, TX | 8,169 | -9.0% | -25.6% |
| Frederick, MD | 4,598 | 3.0% | -17.7% |
| Fresno, CA | 1,721 | -6.0% | -35.8% |
| Grand Rapids, MI | 3,142 | -0.7% | -30.5% |
| Greensboro, NC | 2,108 | -14.6% | -38.3% |
| Greenville, SC | 4,517 | -3.6% | -17.2% |
| Hartford, CT | 6,154 | -3.4% | -18.2% |
| Honolulu, HI | 3,575 | -5.3% | -24.4% |
| Houston, TX | 29,673 | -1.6% | -20.1% |
| Indianapolis, IN | 6,750 | -6.0% | -28.8% |
| Jacksonville, FL | 8,140 | -3.7% | -24.1% |
| Kansas City, MO | 5,327 | -19.9% | -49.4% |
| Knoxville, TN | 4,327 | 0.2% | -15.2% |
| Lake County, IL | 4,175 | -5.4% | -30.4% |
| Las Vegas, NV | 13,134 | -3.2% | -14.2% |
| Los Angeles, CA | 24,861 | 0.2% | -4.0% |
| Louisville, KY | 3,832 | 3.1% | -23.7% |
| McAllen, TX | 1,554 | 1.0% | -32.2% |
| Memphis, TN | 3,321 | -1.1% | -24.4% |
| Miami, FL | 18,414 | -3.1% | -14.4% |
| Milwaukee, WI | 6,971 | -5.5% | -5.0% |
| Minneapolis, MN | 15,074 | -5.4% | -13.4% |
| Montgomery County, PA | 7,196 | -0.4% | -19.6% |
| Nashville, TN | 11,086 | -6.7% | -26.9% |
| Nassau County, NY | 12,094 | -5.6% | -18.3% |
| New Brunswick, NJ | 12,555 | -5.5% | -22.5% |
| New Haven, CT | 4,534 | -5.3% | -10.5% |
| New Orleans, LA | 4,458 | -2.5% | -26.9% |
| New York, NY | 46,325 | 2.7% | 25.4% |
| Newark, NJ | 10,086 | 0.3% | -12.7% |
| North Port, FL | 6,713 | -2.3% | -19.8% |
| Oakland, CA | 6,152 | 3.9% | -5.7% |
| Oklahoma City, OK | 5,229 | -5.7% | -25.8% |
| Omaha, NE | 2,411 | -5.6% | -28.6% |
| Orlando, FL | 12,467 | -1.8% | -13.5% |
| Oxnard, CA | 2,531 | -14.9% | -15.2% |
| Philadelphia, PA | 9,935 | 1.6% | -1.6% |
| Phoenix, AZ | 22,750 | 0.7% | -9.4% |
| Pittsburgh, PA | 10,008 | -6.4% | -13.0% |
| Portland, OR | 8,259 | -2.6% | -22.5% |
| Providence, RI | 6,445 | 0.0% | -23.3% |
| Raleigh, NC | 7,536 | -3.2% | -19.8% |
| Richmond, VA | 3,822 | -4.3% | -31.1% |
| Riverside, CA | 15,932 | -2.4% | -27.6% |
| Rochester, NY | 2,519 | -8.8% | -25.7% |
| Sacramento, CA | 6,771 | -0.9% | -22.7% |
| Salt Lake City, UT | 2,410 | -28.6% | -49.1% |
| San Antonio, TX | 9,287 | -4.7% | -29.9% |
| San Diego, CA | 7,970 | -3.6% | -22.1% |
| San Francisco, CA | 5,068 | 4.9% | 48.4% |
| San Jose, CA | 4,053 | 2.5% | 3.7% |
| Seattle, WA | 10,036 | -7.0% | -9.9% |
| St. Louis, MO | 8,534 | -16.3% | -37.3% |
| Tacoma, WA | 2,637 | -4.1% | -19.0% |
| Tampa, FL | 14,010 | 2.1% | -25.9% |
| Tucson, AZ | 5,031 | 0.1% | -9.3% |
| Tulsa, OK | 3,451 | -5.0% | -24.6% |
| Virginia Beach, VA | 6,626 | -1.4% | -26.2% |
| Warren, MI | 10,439 | -5.6% | -27.1% |
| Washington, D.C. | 19,324 | 2.6% | -6.3% |
| West Palm Beach, FL | 14,889 | -2.1% | -5.4% |
| Worcester, MA | 3,089 | -0.9% | -27.2% |
| National | 1,658,700 | -1.4% | -22.1% |
Median Off-Market Redfin Estimate
| Redfin Metro | Estimate | Month-Over-Month | Year-Over-Year |
|---|---|---|---|
| Albany, NY | $207,000 | 1.2% | -6.8% |
| Allentown, PA | $222,800 | 1.2% | -1.0% |
| Anaheim, CA | $759,200 | 0.9% | 3.6% |
| Atlanta, GA | $243,500 | 1.1% | 4.0% |
| Austin, TX | $314,400 | 1.1% | -2.3% |
| Bakersfield, CA | $209,100 | 1.9% | -8.6% |
| Baltimore, MD | $283,200 | 1.1% | 5.8% |
| Baton Rouge, LA | $133,600 | 0.9% | -23.2% |
| Birmingham, AL | $141,400 | 1.0% | -8.8% |
| Boston, MA | $548,500 | 0.9% | 9.5% |
| Bridgeport, CT | $400,600 | 1.3% | -36.1% |
| Buffalo, NY | $159,700 | 1.3% | -4.7% |
| Camden, NJ | $218,400 | 1.4% | 5.9% |
| Charlotte, NC | $222,500 | 1.3% | 3.9% |
| Chicago, IL | $270,000 | 0.7% | 6.6% |
| Cincinnati, OH | $174,200 | 1.1% | -3.6% |
| Cleveland, OH | $149,300 | 1.1% | -0.4% |
| Columbus, OH | $210,400 | 1.3% | 2.9% |
| Dallas, TX | $266,900 | 0.9% | -0.9% |
| Dayton, OH | $131,700 | 0.9% | 4.1% |
| Denver, CO | $430,700 | 0.3% | 2.6% |
| Detroit, MI | $108,600 | 0.8% | -4.0% |
| Elgin, IL | $238,600 | 0.9% | 2.1% |
| Fort Lauderdale, FL | $283,400 | 0.7% | 3.7% |
| Fort Worth, TX | $229,700 | 0.9% | 0.8% |
| Frederick, MD | $429,100 | 0.8% | 4.9% |
| Fresno, CA | $275,500 | 1.4% | 4.0% |
| Grand Rapids, MI | $182,300 | 1.3% | 5.0% |
| Greensboro, NC | $145,800 | 1.4% | -3.3% |
| Greenville, SC | $168,400 | 1.2% | -13.7% |
| Hartford, CT | $230,300 | 0.9% | -31.3% |
| Honolulu, HI | $708,100 | 0.5% | 1.3% |
| Houston, TX | $206,700 | 0.8% | -4.3% |
| Indianapolis, IN | $175,000 | 1.5% | 1.9% |
| Jacksonville, FL | $221,200 | 0.9% | -4.7% |
| Kansas City, MO | $192,200 | 1.0% | -0.8% |
| Knoxville, TN | $189,000 | 1.4% | 2.7% |
| Lake County, IL | $226,400 | 0.7% | -1.7% |
| Las Vegas, NV | $293,900 | 0.7% | 3.9% |
| Los Angeles, CA | $672,100 | 1.0% | 4.9% |
| Louisville, KY | $185,300 | 0.8% | 4.0% |
| Memphis, TN | $158,000 | 1.9% | 6.3% |
| Miami, FL | $325,000 | 0.8% | 4.3% |
| Milwaukee, WI | $218,800 | 0.9% | 9.1% |
| Minneapolis, MN | $286,000 | 0.9% | 3.6% |
| Montgomery County, PA | $339,200 | 1.1% | 3.8% |
| Nashville, TN | $289,700 | 0.9% | 5.1% |
| Nassau County, NY | $506,600 | 1.2% | 5.1% |
| New Brunswick, NJ | $361,500 | 1.4% | 4.7% |
| New Haven, CT | $230,700 | 1.3% | -49.8% |
| New Orleans, LA | $178,100 | 0.9% | -6.5% |
| Newark, NJ | $383,800 | 1.5% | -0.3% |
| North Port, FL | $245,700 | 1.0% | -9.0% |
| Oakland, CA | $812,800 | 1.4% | 5.4% |
| Oklahoma City, OK | $153,400 | 1.2% | -1.6% |
| Omaha, NE | $200,800 | 1.7% | 8.4% |
| Orlando, FL | $243,800 | 0.6% | -0.5% |
| Oxnard, CA | $621,900 | 0.7% | 2.0% |
| Philadelphia, PA | $203,200 | 1.4% | 4.6% |
| Phoenix, AZ | $289,600 | 1.6% | 2.0% |
| Pittsburgh, PA | $143,300 | 1.9% | -10.6% |
| Portland, OR | $416,500 | 0.8% | 2.5% |
| Providence, RI | $311,900 | 1.4% | 2.2% |
| Raleigh, NC | $269,200 | 0.8% | -4.0% |
| Richmond, VA | $248,400 | 1.0% | 4.9% |
| Riverside, CA | $350,500 | 1.5% | -7.1% |
| Rochester, NY | $152,500 | 1.1% | -1.3% |
| Sacramento, CA | $433,500 | 1.2% | 2.9% |
| Salt Lake City, UT | $375,900 | 1.1% | 8.7% |
| San Antonio, TX | $193,700 | 1.7% | -7.7% |
| San Diego, CA | $639,000 | 1.3% | 5.5% |
| San Francisco, CA | $1,370,500 | -0.5% | 2.3% |
| San Jose, CA | $1,190,100 | 0.9% | 3.7% |
| Seattle, WA | $593,900 | 0.9% | 3.1% |
| St. Louis, MO | $166,000 | 0.8% | -2.2% |
| Tacoma, WA | $391,100 | 1.4% | 4.7% |
| Tampa, FL | $231,900 | 1.0% | 0.1% |
| Tucson, AZ | $216,700 | 1.4% | -4.0% |
| Tulsa, OK | $139,300 | 1.1% | -3.7% |
| Virginia Beach, VA | $243,700 | 1.0% | 5.3% |
| Warren, MI | $222,100 | 1.1% | 4.0% |
| Washington, D.C. | $417,000 | 1.0% | 3.8% |
| West Palm Beach, FL | $286,100 | 0.8% | 2.9% |
| Worcester, MA | $296,100 | 1.1% | -0.6% |
| National | $325,800 | 1.5% | 6.2% |


