Rent growth is easing as landlords respond to a tightening in tenant budgets brought on by inflation.
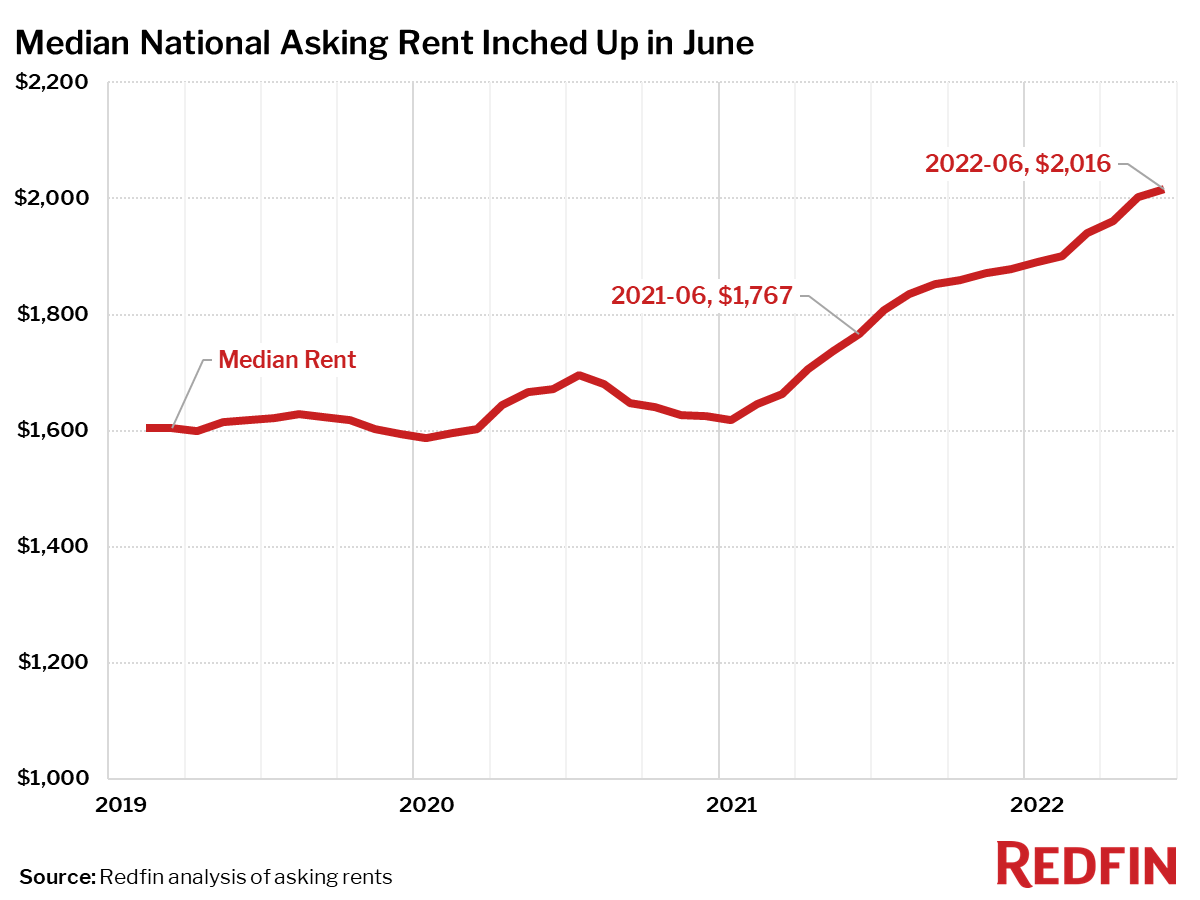
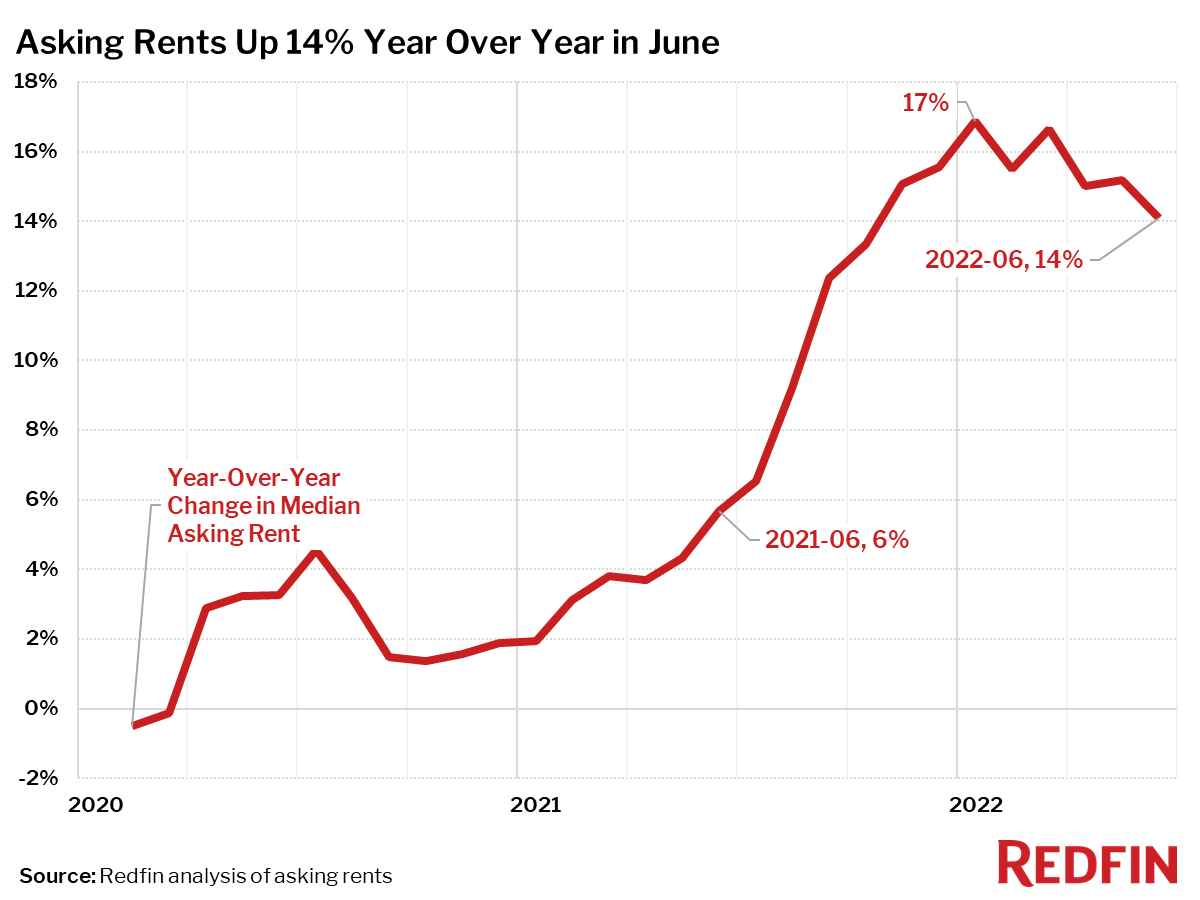
Rent increases tapered off in June, with the national median asking rent rising 14% from a year earlier—the smallest annual increase since October. Asking rents were up 0.7% from May, the smallest month-over-month gain since the start of the year.
“Rent growth is likely slowing because landlords are seeing demand start to ease as renters get pinched by inflation. With the cost of gas, food and other products soaring, renters have less money to spend on housing,” said Redfin chief economist Daryl Fairweather. ”This slowdown in rent increases is likely to continue, however rents are still climbing at unprecedented rates in strong job markets like New York and Seattle and in areas like San Antonio and Austin that soared in popularity during the pandemic.”
| Rental Market Summary | June 2022 | Month-Over-Month | Year-Over-Year |
|---|---|---|---|
| Average Monthly Rent | $2,016 | 0.7% | 14.1% |
Rents Up Over 30% in Cincinnati, Seattle, Austin and Nashville
Asking rents rose 39% year over year in Cincinnati, the largest jump among the 50 most populous U.S. metropolitan areas. Next came Seattle, Austin, TX and Nashville, TN, which also saw increases of over 30%.
Miami, Fort Lauderdale, and West Palm Beach fell out of the top 10 in June as rental increases in the Florida metro areas began to moderate.
Top 10 Metro Areas With Fastest-Rising Rents Year Over Year
- Cincinnati, OH (39%)
- Seattle, WA (33%)
- Austin, TX (32%)
- Nashville, TN (31%)
- New York, NY (27%)
- Nassau County, NY (27%)
- New Brunswick, NJ (27%)
- Newark, NJ (27%)
- Portland, OR (24%)
- San Antonio, TX (23%)
Just three of the 50 most populous metro areas saw rents fall in June from a year earlier. Rents declined 12% in Milwaukee, 7% in Minneapolis and less than 1% in Kansas City, MO. The same three metro areas saw rents decline in April and May as well.
“To combat soaring rents, more cities should follow Minneapolis’ lead,” Fairweather explained. “Minneapolis eliminated single-family zoning in 2018, and last year got rid of a rule that required residential developers to include parking spaces. Now builders can replace parking spots with more housing units, which increases supply and therefore releases some upward pressure on rents.”
Metro Areas Where Rents Declined Year Over Year
- Milwaukee, WI (-12%)
- Minneapolis, MN (-7%)
- Kansas City, MO (-0.5%)
Median Asking Rents, June 2022
| U.S. Metro Area | Median Asking Rent | Year-Over-Year Change in Median Asking Rent |
|---|---|---|
| Anaheim, CA | $3,438 | 7.8% |
| Atlanta, GA | $2,141 | 13.9% |
| Austin, TX | $2,505 | 32.1% |
| Baltimore, MD | $2,121 | 4.9% |
| Boston, MA | $4,031 | 17.2% |
| Charlotte, NC | $1,854 | 7.0% |
| Chicago, IL | $2,509 | 8.4% |
| Cincinnati, OH | $1,815 | 38.8% |
| Cleveland, OH | $1,486 | 9.2% |
| Columbus, OH | $1,689 | 11.6% |
| Dallas, TX | $2,227 | 21.2% |
| Denver, CO | $2,701 | 12.8% |
| Detroit, MI | $1,658 | 12.5% |
| Fort Lauderdale, FL | $3,111 | 22.9% |
| Fort Worth, TX | $2,227 | 21.2% |
| Houston, TX | $1,777 | 9.2% |
| Indianapolis, IN | $1,499 | 20.6% |
| Jacksonville, FL | $1,675 | 10.6% |
| Kansas City, MO | $1,434 | -0.5% |
| Las Vegas, NV | $1,867 | 12.8% |
| Los Angeles, CA | $3,438 | 7.8% |
| Miami, FL | $3,111 | 22.9% |
| Milwaukee, WI | $1,650 | -11.5% |
| Minneapolis, MN | $1,736 | -6.5% |
| Montgomery County, PA | $2,424 | 13.5% |
| Nashville, TN | $2,176 | 30.5% |
| Nassau County, NY | $4,157 | 26.5% |
| New Brunswick, NJ | $4,157 | 26.5% |
| New York, NY | $4,157 | 26.5% |
| Newark, NJ | $4,157 | 26.5% |
| Oakland, CA | $3,812 | 13.9% |
| Orlando, FL | $2,179 | 19.1% |
| Philadelphia, PA | $2,424 | 13.5% |
| Phoenix, AZ | $2,162 | 14.2% |
| Pittsburgh, PA | $1,958 | 20.0% |
| Portland, OR | $2,632 | 24.4% |
| Providence, RI | $2,387 | 5.7% |
| Riverside, CA | $2,720 | 9.8% |
| Sacramento, CA | $2,771 | 17.8% |
| San Antonio, TX | $1,501 | 23.4% |
| San Diego, CA | $3,439 | 17.9% |
| San Francisco, CA | $3,812 | 13.9% |
| San Jose, CA | $3,663 | 15.2% |
| Seattle, WA | $3,293 | 32.5% |
| St. Louis, MO | $1,553 | 5.5% |
| Tampa, FL | $2,203 | 18.5% |
| Virginia Beach, VA | $1,696 | 11.5% |
| Warren, MI | $1,658 | 12.5% |
| Washington, DC | $2,741 | 11.3% |
| West Palm Beach, FL | $3,111 | 22.9% |
| National | $2,016 | 14.1% |
Methodology
Redfin analyzed rent prices from Rent across the 50 largest U.S. metro areas. This analysis uses data from more than 20,000 apartment buildings across the country.
It is important to note that the prices in this report reflect the current costs of new leases during each time period. In other words, the amount shown as the median rent is not the median of what all renters are paying, but the median cost of apartments that were available for new renters during the report month. Currently, Redfin’s data from Rent includes only median rent at the metro level. Future reports will compare median rent prices at a more granular geographic level.