
The hottest March on record ended with early signs of a cooldown as more buyers were edged out by soaring mortgage rates, sky-high prices and few new listings.
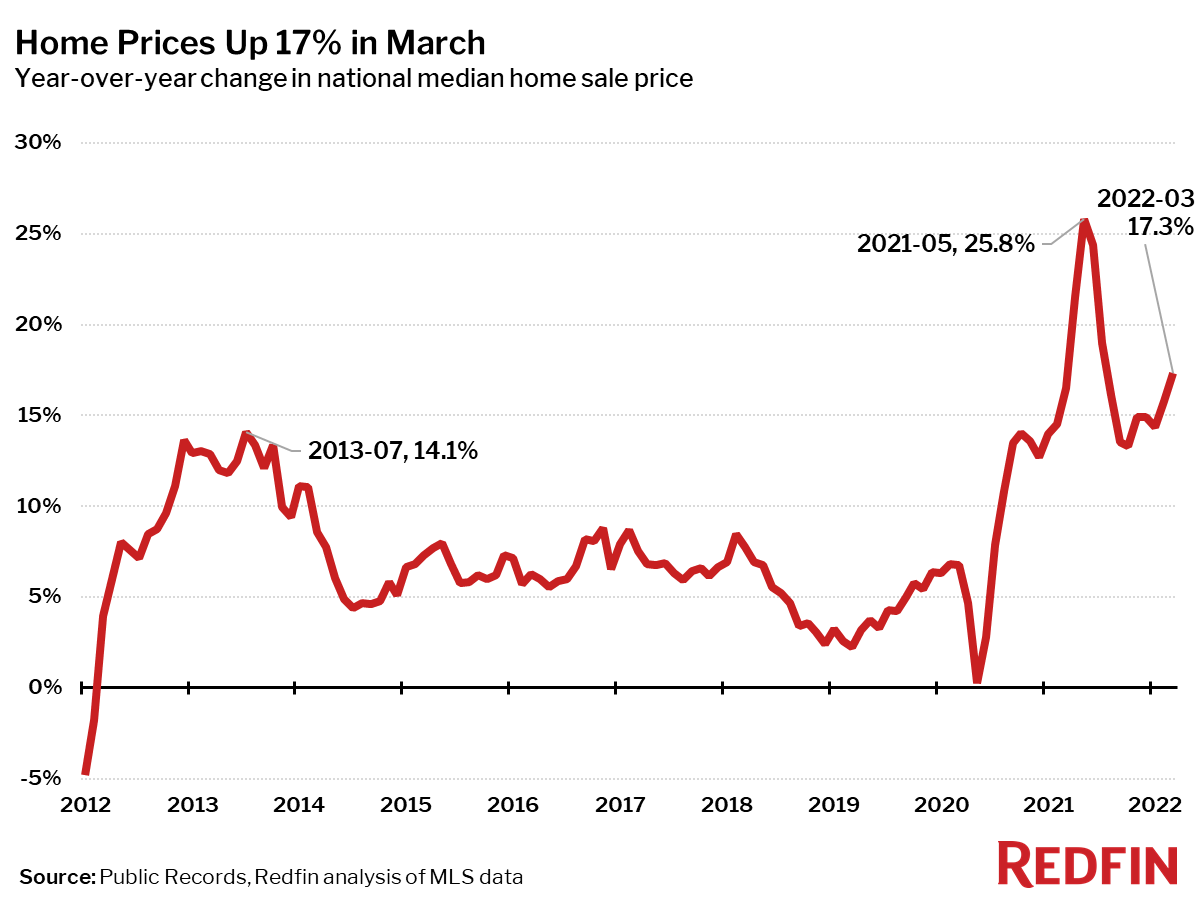
It was the hottest March ever for the housing market, with homes selling at their fastest pace and for more above list price than any other March on record. The median home-sale price rose 6.2% in March, the fastest month-over-month gain at this time of year since 2013, to an all-time high of $412,700. Seasonally adjusted home sales fell 4% as soaring mortgage rates and prices sidelined more buyers, whose options were severely limited due to a decline in homes being listed.
“Although pricey coastal markets began showing early signs of a slowdown in late March, nationwide sales data for the full month reflects the hottest March market on record, since homes that sold last month mostly went under contract in February,” said Redfin chief economist Daryl Fairweather. “We expect the combination of surging mortgage rates and record-high home prices to cause more homebuyers to drop out of the market. Unfortunately, homeowners are turning their back on the market too. Instead of being motivated to list before prices weaken, potential home sellers may be choosing to wait-out the impending market cooldown.”
| Market Summary | March 2022 | Month-Over-Month | Year-Over-Year |
|---|---|---|---|
| Median sale price | $412,700 | 6.2% | 17.3% |
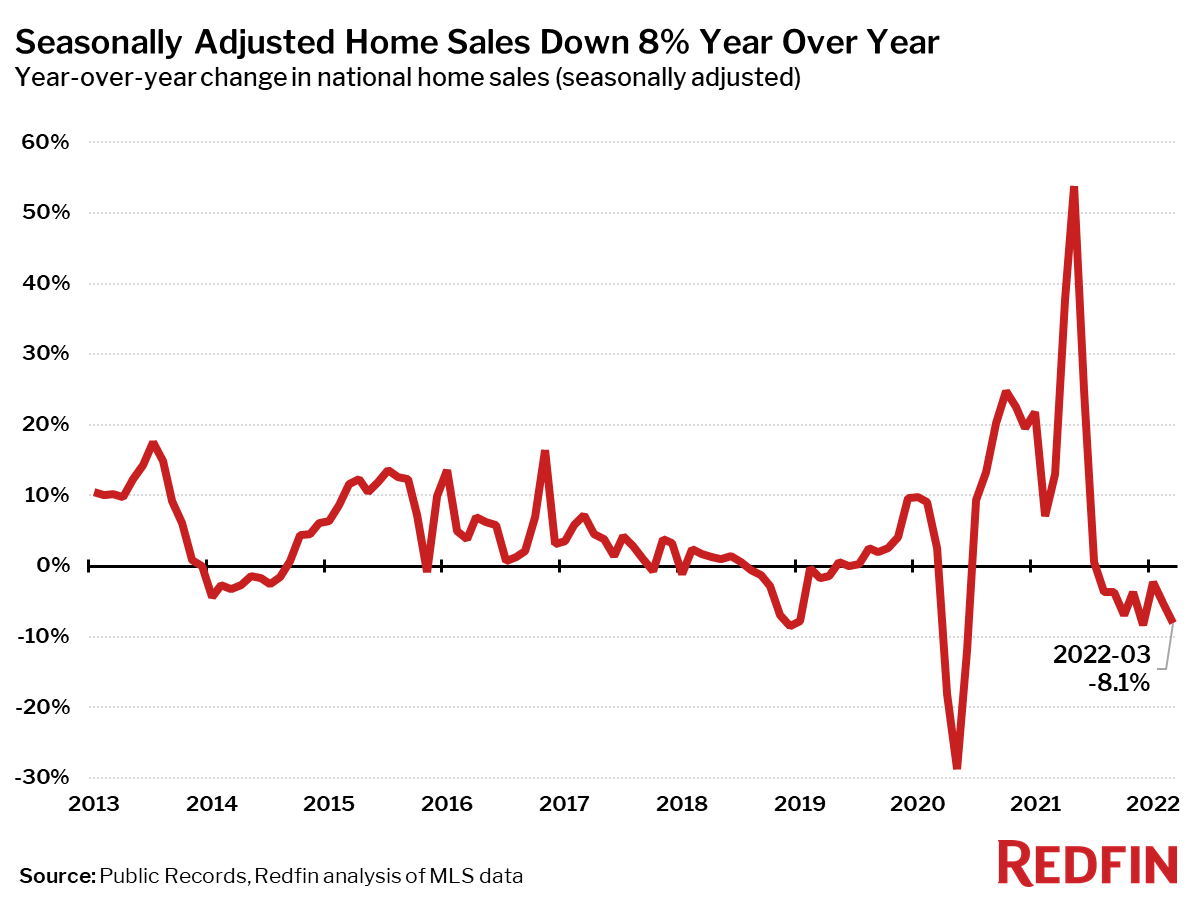
| Homes sold, seasonally-adjusted | 574,200 | -3.7% | -8.1% |
| Pending sales, seasonally-adjusted | 534,600 | -3.6% | -6.1% |
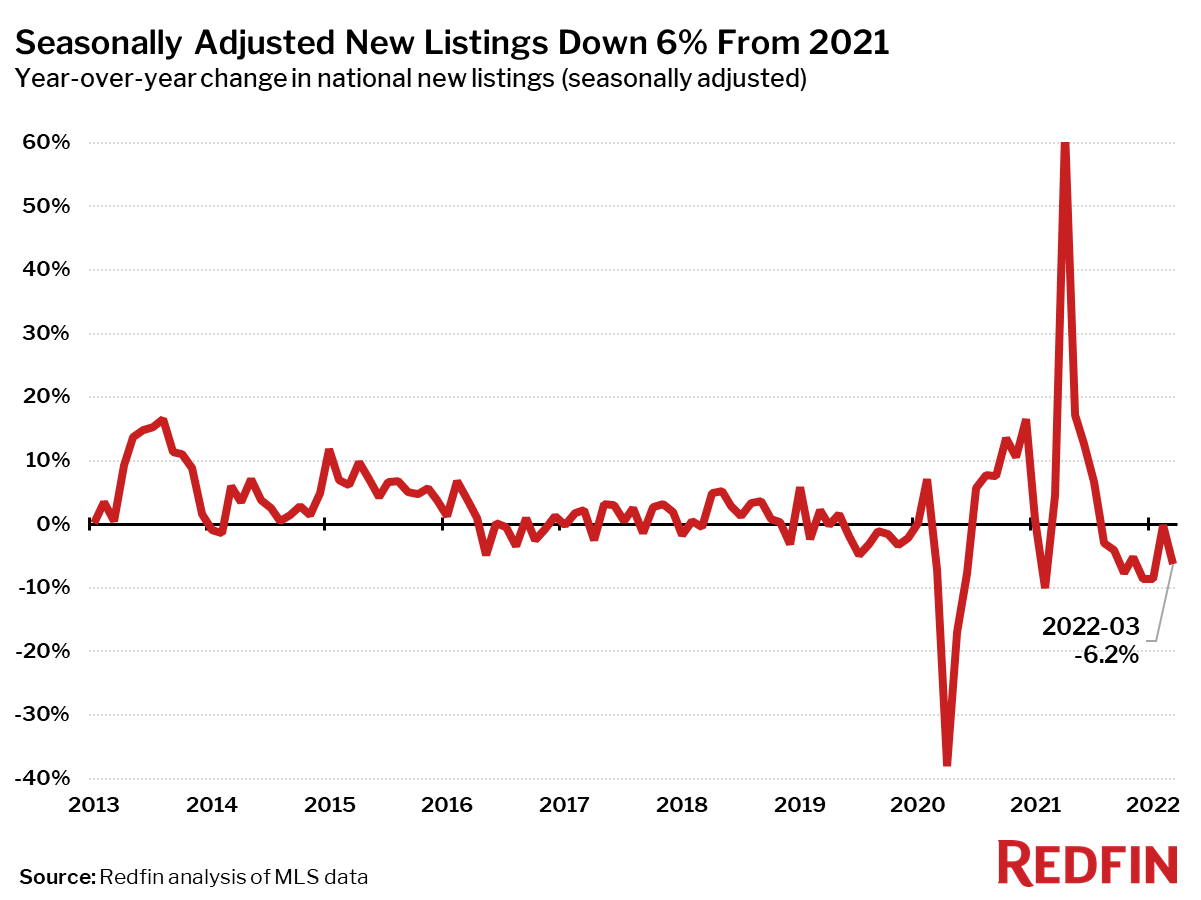
| New listings, seasonally-adjusted | 594,700 | -1.1% | -6.2% |
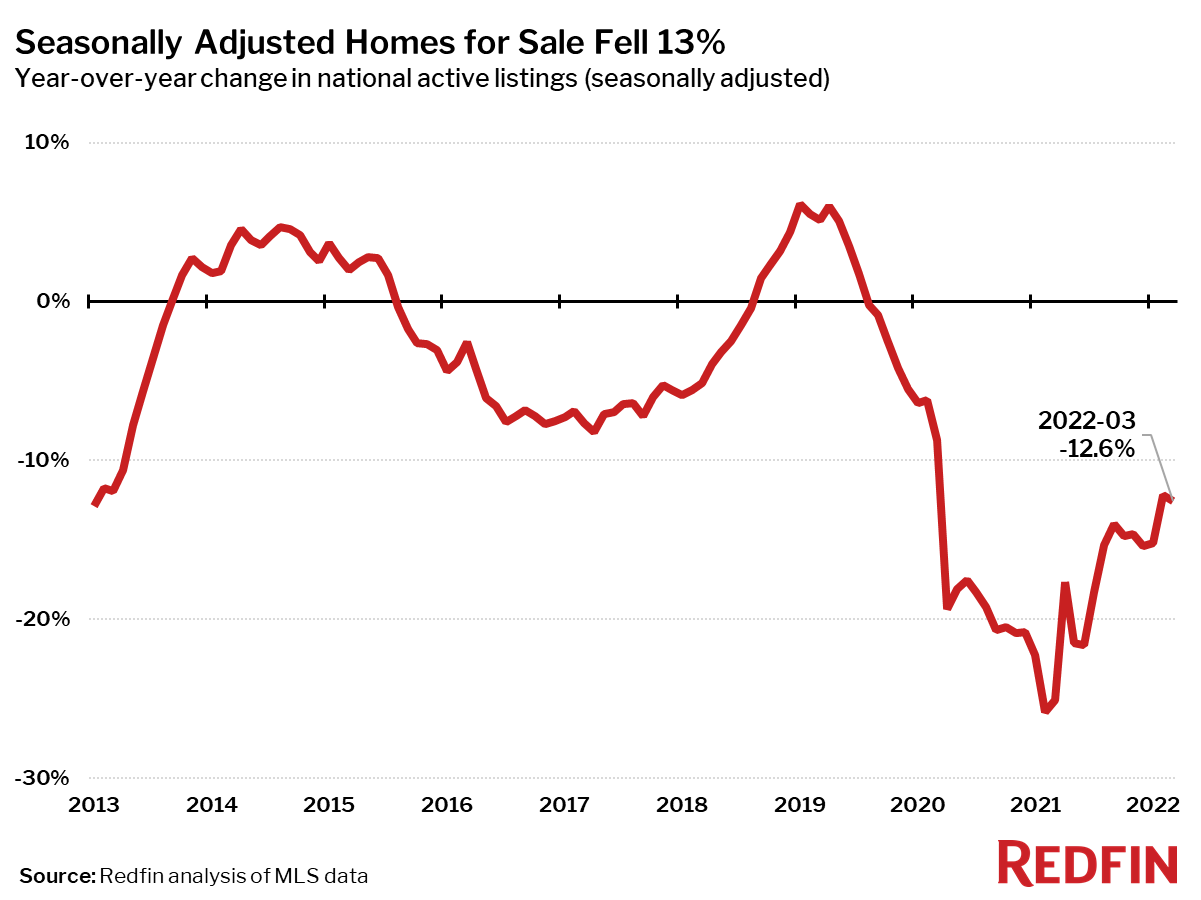
| All Homes for sale, seasonally-adjusted | 1,336,900 | -1.9% | -12.6% |
| Median days on market | 20 | -5 | -6 |
| Months of supply | 1.1 | -0.3 | -0.1 |
| Sold above list | 54.3% | 7.0 pts† | 12.3 pts† |
| Median Off-Market Redfin Estimate | $408,900 | 0.6% | 21.7% |
| Average Sale-to-list | 102.4% | 1.2 pts† | 1.9 pts† |
| Average 30-year fixed mortgage rate | 4.17% | +0.41 pts† | +1.09 pts† |
“Everyone is watching mortgage rates right now. Buyers using traditional financing are worried about being priced out, but all-cash buyers are rubbing their hands together, thinking that high rates will dry up the competition and they will be able to swoop in and bid unopposed,” said Redfin Austin real estate agent Chris Lefforge. “However, the biggest effect I’m seeing right now has been on investors. With prices rising so fast, the return on investment is falling fast. Higher monthly payments are starting to push Austin-area investors into other less expensive markets or out of the market altogether.”
Median sale prices increased from a year earlier in all of the 88 largest metro areas Redfin tracks. The largest price increases were in Tampa, FL (+29%), Phoenix, AZ (+27%) and McAllen, TX (+27%).
Seasonally-adjusted home sales in March were down 4% from a month earlier and down 8% from a year earlier. Home sales fell from the prior year in 79 of the 88 largest metro areas Redfin tracks. The biggest sales declines were in North Port, FL (-30%), West Palm Beach, FL (-24%) and Lake County, IL (-21%). The largest gains were in Fresno, CA (+6%), Philadelphia (+6%) and Oxnard, CA (+3%).
Seasonally adjusted active listings—the count of all homes that were for sale at any time during the month—fell 13% year over year to an all-time low in March.
82 of the 88 largest metros tracked by Redfin posted year-over-year decreases in the number of seasonally adjusted active listings of homes for sale. The biggest year-over-year declines in active housing supply in March were in Allentown, PA (-47%), Greensboro, NC (-41%) and Fort Lauderdale, FL (-37%). The only metro areas where the number of homes for sale increased were Elgin, IL (+29%), Chicago, IL (+13%), Detroit, MI (+13%) and Lake County, IL (+5%).
New listings fell from a year ago in 69 of the 88 largest metro areas. The largest declines were in Allentown, PA (-56%), Greensboro, NC (-39%) and Honolulu (-25%). New listings rose the most in McAllen, TX (+17%), Rochester, NY (+7%) and Detroit, MI (+7%).
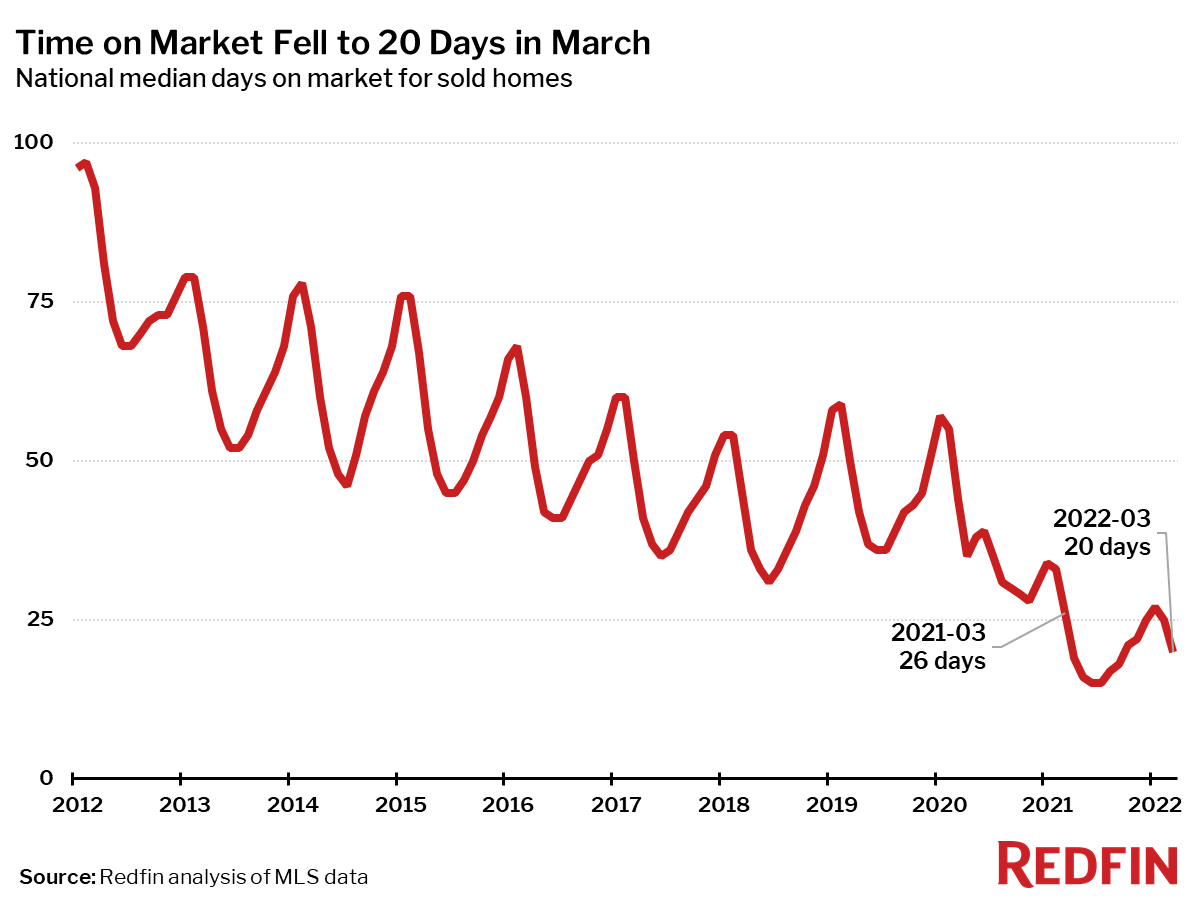
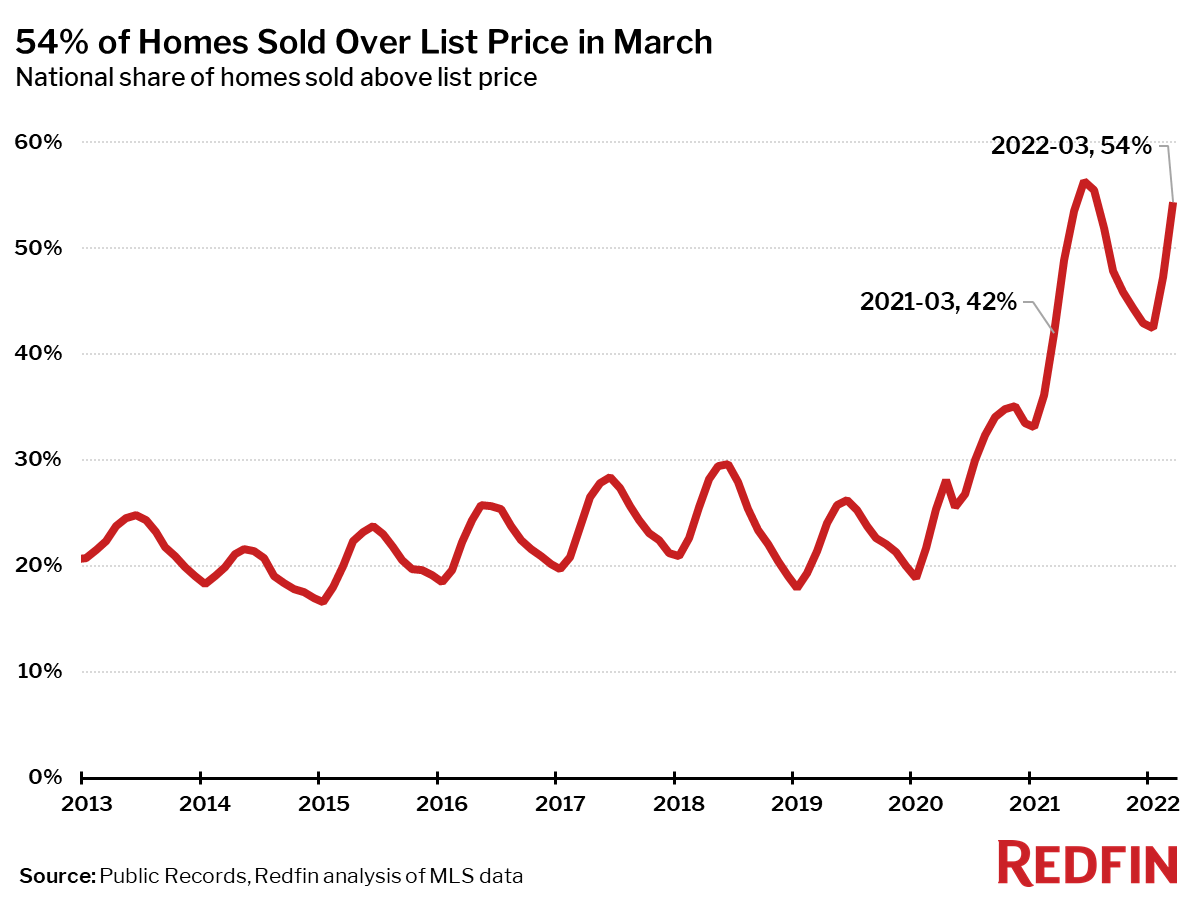
Home sales that closed in March (which mostly went under contract in February) spent less time on the market and sold for further above list price than a year ago.
The typical home that sold in March went under contract in 20 days—six days faster than a year earlier–and the shortest time on market ever for March.
Fifty-four percent of homes sold above list price, up 12 percentage points from a year earlier, and the highest March level on record.
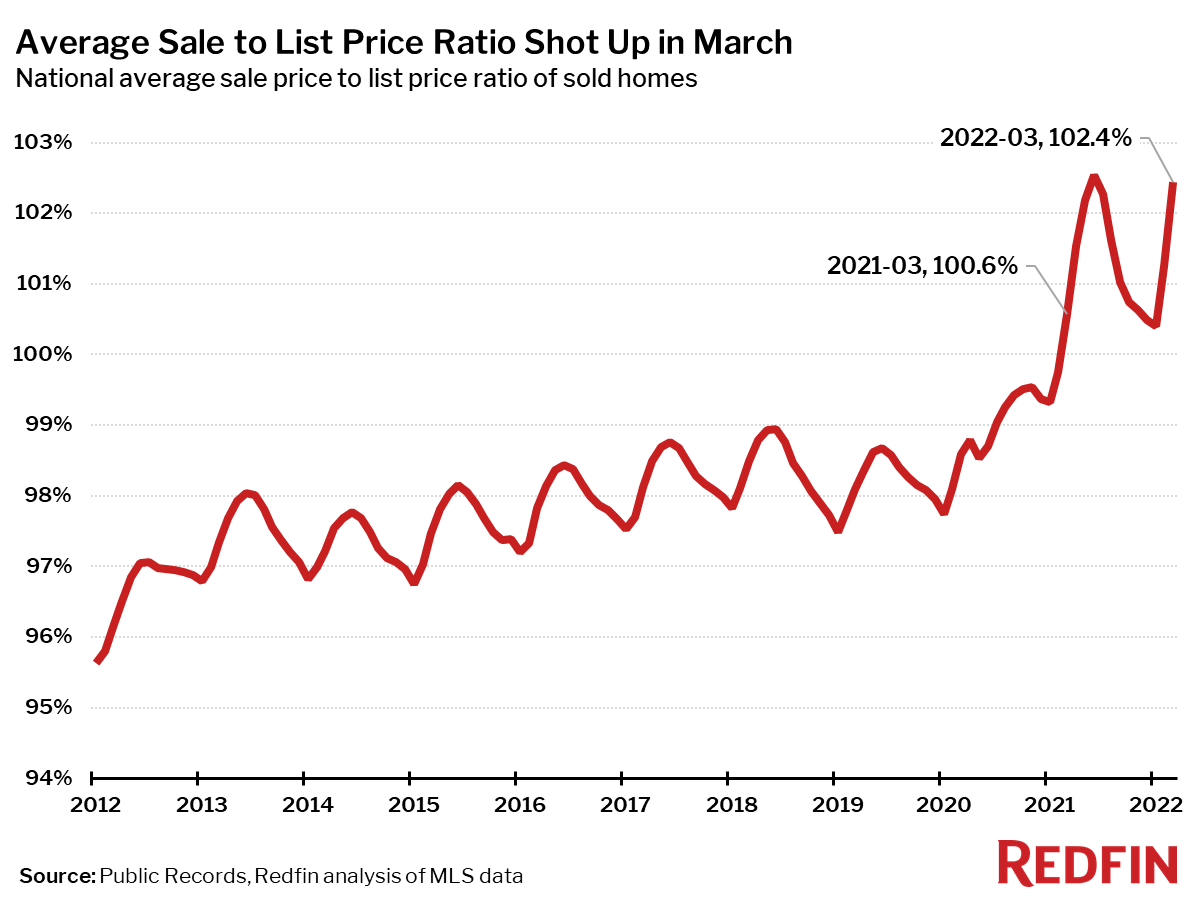
The average sale-to-list price ratio in March was 102.4%, up from 100.6% a year earlier, another record-high for this time of year.
Other March Highlights
Competition
- Denver, Indianapolis, Tacoma, WA and Seattle were the fastest markets, with half of all homes pending sale in just 5 days, followed by North Port, FL at 6 days.
- The most competitive market in March was San Jose, CA where 89.5% of homes sold above list price, followed by 86.7% in Oakland, CA, 76.6% in San Francisco, 75.7% in Denver, and 73.2% in Seattle.
Prices
- Tampa, FL had the nation’s highest price growth, rising 29.2% since last year to $363,750. Phoenix had the second highest growth at 27.4% year-over-year price growth, followed by McAllen, TX (27.3%), Raleigh, NC (27.2%), and Las Vegas (27.2%).
- No metro areas saw price declines in March.
Sales
- Fresno, CA led the nation in year-over-year sales growth, up 6.1%, followed by Philadelphia, up 5.8%. Oxnard, CA rounded out the top three with sales up 3.3% from a year ago.
- North Port, FL saw the largest decline in sales since last year, falling 29.6%. Home sales in West Palm Beach, FL and Lake County, IL declined by 24.3% and 21.0%, respectively.
Inventory
- Elgin, IL had the highest increase in the number of homes for sale, up 29.5% year over year.
- Allentown, PA had the largest decrease in overall active listings, falling 47.5% since last March. Greensboro, NC (-40.9%), Fort Lauderdale, FL (-37.2%), and Bridgeport, CT (-34.5%) also saw far fewer homes available on the market than a year ago.
Redfin Estimate
- Miami (45.7%) had the largest share of homes predicted to sell for below list price, according to Redfin Estimate data, followed by Baton Rouge, LA (41.1%) and Fort Lauderdale, FL (35.0%).
- Oakland, CA (93.3%) had the largest share of homes predicted to sell at or above list price, followed by Seattle (93.3%) and San Jose, CA (92.5%).
Below are market-by-market breakdowns for prices, inventory, new listings and sales for markets with populations of 750,000 or more. For downloadable data on all of the markets Redfin tracks, visit the Redfin Data Center. Refer to our metrics definition page for explanations of all the metrics used in this report.
Median Sale Price
| Redfin Metro | Median Sale Price | Month-Over-Month | Year-Over-Year |
|---|---|---|---|
| Albany, NY | $263,500 | 2.7% | 8.9% |
| Allentown, PA | $285,000 | 7.5% | 18.8% |
| Anaheim, CA | $1,040,000 | 4.2% | 22.2% |
| Atlanta, GA | $368,000 | 3.7% | 21.8% |
| Austin, TX | $525,000 | 5.0% | 22.9% |
| Bakersfield, CA | $350,000 | 2.4% | 16.7% |
| Baltimore, MD | $335,000 | 6.3% | 6.3% |
| Baton Rouge, LA | $252,500 | -1.0% | 8.0% |
| Birmingham, AL | $275,000 | 3.0% | 10.0% |
| Boston, MA | $640,000 | 7.6% | 11.0% |
| Bridgeport, CT | $499,500 | 11.0% | 8.6% |
| Buffalo, NY | $193,100 | -1.5% | 10.3% |
| Camden, NJ | $275,000 | 3.8% | 16.3% |
| Charleston, SC | $395,000 | 3.9% | 16.2% |
| Charlotte, NC | $379,300 | 3.4% | 21.6% |
| Chicago, IL | $310,000 | 6.7% | 3.3% |
| Cincinnati, OH | $248,000 | 6.7% | 11.2% |
| Cleveland, OH | $190,000 | 6.7% | 13.9% |
| Columbus, OH | $291,500 | 7.7% | 14.3% |
| Dallas, TX | $420,000 | 5.1% | 22.0% |
| Dayton, OH | $177,500 | 3.5% | 10.9% |
| Denver, CO | $600,600 | 5.4% | 21.3% |
| Detroit, MI | $166,000 | 0.6% | 6.1% |
| El Paso, TX | $225,000 | 0.0% | 20.5% |
| Elgin, IL | $286,200 | 4.1% | 6.0% |
| Fort Lauderdale, FL | $370,000 | 2.5% | 15.1% |
| Fort Worth, TX | $352,000 | 1.3% | 22.6% |
| Frederick, MD | $510,000 | 5.2% | 8.5% |
| Fresno, CA | $400,000 | 3.5% | 17.6% |
| Grand Rapids, MI | $290,000 | 3.6% | 15.1% |
| Greensboro, NC | $245,000 | 5.4% | 21.0% |
| Greenville, SC | $300,000 | 3.3% | 20.0% |
| Hartford, CT | $270,000 | 1.9% | 8.0% |
| Houston, TX | $330,000 | 1.5% | 14.4% |
| Indianapolis, IN | $260,000 | 4.0% | 15.6% |
| Jacksonville, FL | $350,000 | 4.9% | 25.0% |
| Kansas City, MO | $290,000 | 7.4% | 10.7% |
| Knoxville, TN | $319,000 | 3.6% | 23.3% |
| Lake County, IL | $291,000 | 7.8% | 3.3% |
| Las Vegas, NV | $430,000 | 1.4% | 27.2% |
| Los Angeles, CA | $872,500 | 3.9% | 12.6% |
| Louisville, KY | $235,000 | 1.2% | 8.9% |
| McAllen, TX | $210,000 | 7.3% | 27.3% |
| Memphis, TN | $277,900 | 5.9% | 18.3% |
| Miami, FL | $466,000 | 3.8% | 19.8% |
| Milwaukee, WI | $255,800 | 6.1% | 5.2% |
| Minneapolis, MN | $355,000 | 2.9% | 7.6% |
| Montgomery County, PA | $400,000 | 4.5% | 8.1% |
| Nashville, TN | $430,000 | 2.4% | 23.9% |
| Nassau County, NY | $599,000 | 2.4% | 12.2% |
| New Brunswick, NJ | $425,000 | 0.0% | 9.0% |
| New Haven, CT | $280,000 | 3.7% | 9.8% |
| New Orleans, LA | $280,000 | -1.8% | 7.0% |
| New York, NY | $677,700 | 1.1% | 7.7% |
| Newark, NJ | $470,000 | 5.3% | 10.6% |
| North Port, FL | $444,500 | 4.6% | 27.0% |
| Oakland, CA | $980,000 | 6.5% | 10.1% |
| Oklahoma City, OK | $245,000 | 4.3% | 12.9% |
| Omaha, NE | $277,000 | 9.9% | 13.1% |
| Orlando, FL | $377,000 | 4.7% | 25.7% |
| Oxnard, CA | $820,000 | 1.7% | 13.9% |
| Philadelphia, PA | $265,000 | 6.6% | 2.3% |
| Phoenix, AZ | $470,000 | 3.3% | 27.4% |
| Pittsburgh, PA | $213,500 | 6.8% | 1.7% |
| Portland, OR | $550,000 | 4.8% | 15.2% |
| Providence, RI | $385,000 | 1.3% | 13.6% |
| Raleigh, NC | $419,900 | 5.2% | 27.2% |
| Richmond, VA | $340,000 | 6.2% | 13.3% |
| Riverside, CA | $560,000 | 2.2% | 19.1% |
| Rochester, NY | $185,000 | 4.5% | 14.3% |
| Sacramento, CA | $610,000 | 6.1% | 17.3% |
| Salt Lake City, UT | $540,000 | 4.9% | 24.1% |
| San Antonio, TX | $320,000 | 4.6% | 20.8% |
| San Diego, CA | $850,000 | 6.1% | 21.4% |
| San Francisco, CA | $1,580,000 | 3.5% | 10.5% |
| San Jose, CA | $1,560,000 | 8.0% | 17.7% |
| Seattle, WA | $820,000 | 9.3% | 17.3% |
| St. Louis, MO | $225,000 | 4.7% | 6.4% |
| Tacoma, WA | $551,000 | 4.3% | 17.2% |
| Tampa, FL | $363,800 | 3.7% | 29.2% |
| Tucson, AZ | $340,000 | 1.5% | 19.3% |
| Tulsa, OK | $235,500 | 4.7% | 9.5% |
| Honolulu, HI | $705,600 | 4.5% | 14.7% |
| Virginia Beach, VA | $296,100 | 3.9% | 11.3% |
| Warren, MI | $262,000 | 4.8% | 7.2% |
| Washington, DC | $525,000 | 6.5% | 9.4% |
| West Palm Beach, FL | $416,600 | 4.1% | 20.8% |
| Worcester, MA | $360,000 | 2.9% | 10.3% |
| National | $412,700 | 6.2% | 17.3% |
Homes Sold
| Redfin Metro | Homes Sold | Month-Over-Month | Year-Over-Year |
|---|---|---|---|
| Albany, NY | 701 | 19.0% | -18.1% |
| Allentown, PA | 712 | 33.6% | -4.9% |
| Anaheim, CA | 2,706 | 50.2% | -16.8% |
| Atlanta, GA | 9,748 | 24.8% | -9.3% |
| Austin, TX | 3,131 | 24.2% | -9.7% |
| Bakersfield, CA | 857 | 30.4% | -5.1% |
| Baltimore, MD | 3,775 | 33.0% | -3.1% |
| Baton Rouge, LA | 1,120 | 17.3% | -9.5% |
| Birmingham, AL | 1,531 | 37.9% | -8.7% |
| Boston, MA | 3,090 | 43.1% | -14.1% |
| Bridgeport, CT | 1,002 | 30.3% | -20.0% |
| Buffalo, NY | 720 | 1.3% | -14.1% |
| Camden, NJ | 1,455 | 24.1% | -13.9% |
| Charleston, SC | 1,767 | 37.8% | -12.4% |
| Charlotte, NC | 4,248 | 20.5% | -6.5% |
| Chicago, IL | 8,632 | 40.1% | -7.1% |
| Cincinnati, OH | 2,487 | 29.1% | -7.2% |
| Cleveland, OH | 2,214 | 27.8% | -9.6% |
| Columbus, OH | 2,323 | 24.6% | -4.8% |
| Dallas, TX | 5,637 | 26.0% | -6.3% |
| Dayton, OH | 921 | 24.6% | -3.3% |
| Denver, CO | 4,636 | 36.2% | -8.6% |
| Detroit, MI | 1,654 | 18.8% | -5.2% |
| El Paso, TX | 870 | 17.6% | -5.2% |
| Elgin, IL | 912 | 37.8% | -12.1% |
| Fort Lauderdale, FL | 3,753 | 30.4% | -15.1% |
| Fort Worth, TX | 2,813 | 23.1% | -3.6% |
| Frederick, MD | 1,454 | 30.8% | -7.7% |
| Fresno, CA | 786 | 30.1% | 6.1% |
| Grand Rapids, MI | 939 | 18.6% | -17.6% |
| Greensboro, NC | 926 | 22.0% | -13.2% |
| Greenville, SC | 1,339 | 31.8% | -1.4% |
| Hartford, CT | 1,168 | 27.0% | -12.2% |
| Houston, TX | 9,987 | 28.6% | 1.8% |
| Indianapolis, IN | 2,776 | 20.1% | -2.4% |
| Jacksonville, FL | 3,031 | 21.8% | -11.1% |
| Kansas City, MO | 2,776 | 31.6% | 0.6% |
| Knoxville, TN | 1,135 | 20.9% | -10.6% |
| Lake County, IL | 970 | 25.5% | -21.0% |
| Las Vegas, NV | 4,240 | 29.0% | -12.2% |
| Los Angeles, CA | 6,589 | 40.6% | -7.4% |
| Louisville, KY | 1,598 | 25.8% | -2.6% |
| McAllen, TX | 431 | 12.8% | -14.5% |
| Memphis, TN | 1,455 | 20.7% | 1.0% |
| Miami, FL | 3,895 | 27.7% | -4.2% |
| Milwaukee, WI | 1,622 | 39.3% | -0.9% |
| Minneapolis, MN | 4,054 | 40.4% | -9.5% |
| Montgomery County, PA | 1,846 | 32.5% | -7.9% |
| Nashville, TN | 3,510 | 26.1% | -3.5% |
| Nassau County, NY | 2,341 | 6.5% | -17.8% |
| New Brunswick, NJ | 2,659 | 25.1% | -16.6% |
| New Haven, CT | 891 | 28.6% | -8.7% |
| New Orleans, LA | 1,382 | 22.7% | -12.2% |
| New York, NY | 6,483 | 18.1% | -4.6% |
| Newark, NJ | 1,803 | 22.5% | -19.0% |
| North Port, FL | 2,370 | 27.0% | -29.6% |
| Oakland, CA | 2,781 | 63.8% | -0.1% |
| Oklahoma City, OK | 2,024 | 25.0% | -6.7% |
| Omaha, NE | 971 | 22.1% | -0.5% |
| Orlando, FL | 4,772 | 24.0% | -9.3% |
| Oxnard, CA | 808 | 54.5% | 3.3% |
| Philadelphia, PA | 2,389 | 32.3% | 5.8% |
| Phoenix, AZ | 9,557 | 24.1% | -2.2% |
| Pittsburgh, PA | 2,111 | 25.5% | -8.1% |
| Portland, OR | 3,501 | 35.1% | 2.8% |
| Providence, RI | 1,437 | 19.7% | -14.6% |
| Raleigh, NC | 2,267 | 22.8% | -10.3% |
| Richmond, VA | 1,701 | 46.0% | -9.0% |
| Riverside, CA | 6,076 | 35.0% | -2.4% |
| Rochester, NY | 694 | 29.7% | -11.7% |
| Sacramento, CA | 2,668 | 29.6% | -2.2% |
| Salt Lake City, UT | 1,284 | 26.6% | -11.4% |
| San Antonio, TX | 3,032 | 22.1% | -10.6% |
| San Diego, CA | 3,162 | 31.3% | -7.1% |
| San Francisco, CA | 1,253 | 67.1% | -4.2% |
| San Jose, CA | 1,589 | 65.3% | 0.4% |
| Seattle, WA | 4,396 | 60.5% | -2.2% |
| St. Louis, MO | 3,167 | 28.5% | -8.5% |
| Tacoma, WA | 1,370 | 44.7% | -3.5% |
| Tampa, FL | 6,612 | 22.9% | -7.0% |
| Tucson, AZ | 1,815 | 21.6% | -5.3% |
| Tulsa, OK | 1,364 | 27.2% | -0.6% |
| Honolulu, HI | 906 | 30.9% | 1.3% |
| Virginia Beach, VA | 2,725 | 29.0% | -1.2% |
| Warren, MI | 2,993 | 26.0% | -7.3% |
| Washington, DC | 6,517 | 36.9% | -6.2% |
| West Palm Beach, FL | 3,321 | 23.5% | -24.3% |
| Worcester, MA | 751 | 22.9% | -8.6% |
| National | 574,200 | -3.7% | -8.1% |
New Listings
| Redfin Metro | New Listings | Month-Over-Month | Year-Over-Year |
|---|---|---|---|
| Albany, NY | 1,011 | 36.4% | -13.2% |
| Allentown, PA | 461 | -20.1% | -56.3% |
| Anaheim, CA | 2,990 | 15.6% | -17.7% |
| Atlanta, GA | 10,268 | 20.0% | -13.2% |
| Austin, TX | 4,066 | 47.6% | -1.3% |
| Bakersfield, CA | 998 | 19.0% | -5.4% |
| Baltimore, MD | 4,711 | 43.8% | -4.0% |
| Birmingham, AL | 1,413 | 8.2% | -18.2% |
| Boston, MA | 5,803 | 69.7% | -4.5% |
| Bridgeport, CT | 1,433 | 41.3% | -23.1% |
| Buffalo, NY | 1,079 | 60.6% | -5.9% |
| Camden, NJ | 1,973 | 39.2% | -7.7% |
| Charleston, SC | 1,890 | 26.6% | -9.0% |
| Charlotte, NC | 3,942 | 31.7% | -19.7% |
| Chicago, IL | 11,473 | 33.0% | -15.3% |
| Cincinnati, OH | 3,110 | 49.1% | -4.3% |
| Cleveland, OH | 2,921 | 45.9% | -7.4% |
| Columbus, OH | 2,969 | 48.9% | 0.1% |
| Dallas, TX | 6,783 | 39.2% | -4.4% |
| Dayton, OH | 1,216 | 53.1% | -0.2% |
| Denver, CO | 5,757 | 41.9% | 4.3% |
| Detroit, MI | 2,322 | 34.8% | 6.8% |
| El Paso, TX | 1,004 | 24.9% | 0.5% |
| Elgin, IL | 1,084 | 30.0% | -19.6% |
| Fort Lauderdale, FL | 3,434 | 3.1% | -23.6% |
| Fort Worth, TX | 3,329 | 42.9% | -1.5% |
| Frederick, MD | 1,929 | 41.1% | -9.8% |
| Fresno, CA | 906 | 19.4% | 2.0% |
| Grand Rapids, MI | 1,342 | 57.1% | -5.6% |
| Greensboro, NC | 651 | 1.6% | -39.2% |
| Greenville, SC | 1,330 | 9.3% | -5.7% |
| Hartford, CT | 1,648 | 48.9% | -16.0% |
| Houston, TX | 11,113 | 24.0% | 2.4% |
| Indianapolis, IN | 3,531 | 45.8% | 2.8% |
| Jacksonville, FL | 3,107 | 17.2% | -14.8% |
| Kansas City, MO | 3,484 | 30.3% | -12.0% |
| Knoxville, TN | 1,151 | 21.2% | -6.7% |
| Lake County, IL | 1,372 | 42.2% | -18.7% |
| Las Vegas, NV | 4,519 | 17.9% | -3.4% |
| Los Angeles, CA | 7,243 | 11.5% | -15.2% |
| Louisville, KY | 1,963 | 44.7% | -1.2% |
| McAllen, TX | 621 | 26.5% | 17.2% |
| Memphis, TN | 1,714 | 29.0% | 4.0% |
| Miami, FL | 4,102 | 6.5% | -13.4% |
| Milwaukee, WI | 1,816 | 23.1% | -17.5% |
| Minneapolis, MN | 6,044 | 45.1% | -5.6% |
| Montgomery County, PA | 2,541 | 36.6% | -12.8% |
| Nashville, TN | 3,787 | 36.3% | -0.6% |
| Nassau County, NY | 3,589 | 46.5% | 1.1% |
| New Brunswick, NJ | 3,902 | 41.2% | -8.6% |
| New Haven, CT | 1,230 | 49.6% | -12.1% |
| New Orleans, LA | 1,885 | 37.5% | 1.1% |
| New York, NY | 10,807 | 40.8% | 2.6% |
| Newark, NJ | 2,725 | 31.7% | -14.5% |
| North Port, FL | 2,790 | 21.0% | -1.5% |
| Oakland, CA | 3,352 | 25.3% | -0.7% |
| Oklahoma City, OK | 2,463 | 42.6% | -0.3% |
| Omaha, NE | 1,275 | 25.9% | -10.4% |
| Orlando, FL | 5,065 | 15.7% | 0.1% |
| Oxnard, CA | 890 | 24.5% | -7.6% |
| Philadelphia, PA | 3,195 | 28.6% | -3.4% |
| Phoenix, AZ | 9,252 | 15.0% | -8.5% |
| Pittsburgh, PA | 2,848 | 49.4% | -4.1% |
| Portland, OR | 4,080 | 28.5% | -0.1% |
| Providence, RI | 2,014 | 47.7% | -12.2% |
| Raleigh, NC | 2,480 | 25.3% | -9.5% |
| Richmond, VA | 1,977 | 22.8% | -11.5% |
| Riverside, CA | 6,473 | 16.3% | -1.6% |
| Rochester, NY | 1,231 | 71.2% | 7.4% |
| Sacramento, CA | 3,321 | 28.4% | 2.0% |
| San Antonio, TX | 3,451 | 20.5% | -2.7% |
| San Diego, CA | 3,477 | 17.4% | -10.7% |
| San Francisco, CA | 1,284 | 3.0% | -13.8% |
| San Jose, CA | 1,844 | 17.8% | -8.5% |
| Seattle, WA | 5,700 | 43.8% | 2.2% |
| St. Louis, MO | 3,604 | 46.1% | -14.1% |
| Tacoma, WA | 1,788 | 32.5% | 3.3% |
| Tampa, FL | 6,768 | 18.6% | -3.6% |
| Tucson, AZ | 1,739 | 13.4% | -9.1% |
| Tulsa, OK | 1,544 | 37.0% | -6.3% |
| Honolulu, HI | 773 | -4.4% | -24.5% |
| Virginia Beach, VA | 3,178 | 29.1% | -5.9% |
| Warren, MI | 3,929 | 49.7% | -1.1% |
| Washington, DC | 8,145 | 35.4% | -10.1% |
| West Palm Beach, FL | 3,855 | 18.5% | -7.4% |
| Worcester, MA | 1,149 | 59.4% | -9.5% |
| National | 594,700 | -1.1% | -6.2% |
All Homes for Sale
| Redfin Metro | All Homes for Sale | Month-Over-Month | Year-Over-Year |
|---|---|---|---|
| Albany, NY | 2,137 | 10.3% | -19.5% |
| Allentown, PA | 1,036 | -15.7% | -47.5% |
| Anaheim, CA | 5,614 | 15.8% | -30.2% |
| Atlanta, GA | 19,107 | 5.5% | -17.6% |
| Austin, TX | 6,950 | 20.3% | -2.5% |
| Bakersfield, CA | 1,910 | 12.2% | -7.3% |
| Baltimore, MD | 8,231 | 16.0% | -9.3% |
| Birmingham, AL | 3,535 | 6.1% | -28.7% |
| Boston, MA | 9,092 | 38.6% | -17.0% |
| Bridgeport, CT | 3,297 | 14.8% | -34.5% |
| Buffalo, NY | 1,777 | 25.1% | -8.9% |
| Camden, NJ | 3,747 | 16.4% | -12.8% |
| Charleston, SC | 4,393 | 14.0% | -23.8% |
| Charlotte, NC | 7,945 | 8.3% | -30.9% |
| Chicago, IL | 31,414 | 22.3% | 13.5% |
| Cincinnati, OH | 6,732 | 16.1% | -11.5% |
| Cleveland, OH | 5,835 | 13.5% | -15.4% |
| Columbus, OH | 5,940 | 17.3% | -5.5% |
| Dallas, TX | 11,321 | 16.9% | -18.8% |
| Dayton, OH | 2,143 | 18.9% | -8.3% |
| Denver, CO | 7,260 | 30.5% | -7.3% |
| Detroit, MI | 5,113 | 13.4% | 12.6% |
| El Paso, TX | 2,161 | 9.0% | -22.3% |
| Elgin, IL | 2,757 | 21.9% | 29.5% |
| Fort Lauderdale, FL | 9,567 | -1.1% | -37.2% |
| Fort Worth, TX | 5,675 | 14.4% | -13.4% |
| Frederick, MD | 3,025 | 22.7% | -17.6% |
| Fresno, CA | 1,487 | 10.9% | -0.9% |
| Grand Rapids, MI | 1,910 | 32.6% | -16.8% |
| Greensboro, NC | 1,466 | -7.6% | -40.9% |
| Greenville, SC | 3,141 | 4.8% | -23.4% |
| Hartford, CT | 3,227 | 15.7% | -30.0% |
| Houston, TX | 23,102 | 4.7% | -8.4% |
| Indianapolis, IN | 5,302 | 18.9% | -9.5% |
| Jacksonville, FL | 6,000 | 2.3% | -23.0% |
| Kansas City, MO | 6,201 | 13.0% | -15.9% |
| Knoxville, TN | 2,822 | 6.6% | -21.4% |
| Lake County, IL | 3,376 | 24.0% | 5.0% |
| Las Vegas, NV | 8,696 | 6.7% | -12.9% |
| Los Angeles, CA | 16,150 | 7.2% | -23.5% |
| Louisville, KY | 3,391 | 15.7% | -15.9% |
| McAllen, TX | 1,714 | 4.8% | -11.9% |
| Memphis, TN | 3,400 | 10.4% | -13.6% |
| Miami, FL | 12,867 | -3.2% | -29.6% |
| Milwaukee, WI | 4,731 | 11.1% | -9.3% |
| Minneapolis, MN | 10,378 | 23.6% | -5.9% |
| Montgomery County, PA | 4,360 | 19.9% | -18.8% |
| Nashville, TN | 7,001 | 15.8% | -15.9% |
| Nassau County, NY | 7,582 | 16.1% | -19.5% |
| New Brunswick, NJ | 8,703 | 16.9% | -3.9% |
| New Haven, CT | 2,555 | 13.5% | -25.6% |
| New Orleans, LA | 3,650 | 15.0% | -18.6% |
| New York, NY | 32,250 | 12.8% | -9.0% |
| Newark, NJ | 6,131 | 18.1% | -16.3% |
| North Port, FL | 4,129 | 11.9% | -19.1% |
| Oakland, CA | 4,969 | 23.4% | -3.5% |
| Oklahoma City, OK | 4,039 | 12.8% | -8.7% |
| Omaha, NE | 1,851 | 16.1% | -17.5% |
| Orlando, FL | 8,283 | 6.0% | -19.6% |
| Oxnard, CA | 1,757 | 18.0% | -13.4% |
| Philadelphia, PA | 7,582 | 9.9% | -4.1% |
| Phoenix, AZ | 17,629 | 4.2% | -9.0% |
| Pittsburgh, PA | 8,043 | 10.3% | -4.9% |
| Portland, OR | 6,089 | 19.6% | -7.8% |
| Providence, RI | 3,696 | 20.9% | -20.6% |
| Raleigh, NC | 4,434 | 10.5% | -30.4% |
| Richmond, VA | 3,102 | 16.1% | -20.4% |
| Riverside, CA | 13,174 | 6.9% | -8.6% |
| Rochester, NY | 1,778 | 34.4% | -7.2% |
| Sacramento, CA | 5,072 | 19.9% | -1.3% |
| San Antonio, TX | 6,912 | 1.4% | -12.8% |
| San Diego, CA | 5,414 | 13.5% | -18.5% |
| San Francisco, CA | 2,622 | 8.5% | -22.2% |
| San Jose, CA | 2,699 | 21.1% | -25.0% |
| Seattle, WA | 7,038 | 39.7% | -10.1% |
| St. Louis, MO | 7,002 | 16.8% | -18.8% |
| Tacoma, WA | 2,318 | 26.3% | -2.1% |
| Tampa, FL | 10,485 | 9.3% | -17.7% |
| Tucson, AZ | 4,113 | 1.0% | -10.2% |
| Tulsa, OK | 2,499 | 13.4% | -15.9% |
| Honolulu, HI | 2,759 | -0.3% | -20.3% |
| Virginia Beach, VA | 5,358 | 12.4% | -16.2% |
| Warren, MI | 6,656 | 21.3% | -4.2% |
| Washington, DC | 14,179 | 17.8% | -13.8% |
| West Palm Beach, FL | 9,206 | 5.8% | -32.3% |
| Worcester, MA | 1,883 | 24.5% | -13.2% |
| National | 1,336,900 | -1.9% | -12.6% |
Median Off-Market Redfin Estimate
| Redfin Metro | Estimate | Month-Over-Month | Year-Over-Year |
|---|---|---|---|
| Albany, NY | $230,300 | 2.6% | 7.0% |
| Allentown, PA | $276,600 | 0.8% | 18.3% |
| Anaheim, CA | $1,008,300 | 2.5% | 26.5% |
| Atlanta, GA | $334,300 | 1.8% | 29.7% |
| Austin, TX | $482,800 | 2.3% | 41.8% |
| Bakersfield, CA | $268,600 | 1.6% | 24.0% |
| Baltimore, MD | $338,100 | 0.8% | 14.5% |
| Baton Rouge, LA | $150,100 | 0.8% | 7.7% |
| Birmingham, AL | $172,400 | 1.4% | 16.3% |
| Boston, MA | $630,100 | 0.6% | 11.7% |
| Bridgeport, CT | $474,200 | 0.8% | 13.8% |
| Buffalo, NY | $194,000 | 1.8% | 16.7% |
| Camden, NJ | $283,400 | 1.1% | 22.4% |
| Charleston, SC | $322,100 | 1.8% | 24.4% |
| Charlotte, NC | $310,200 | 1.7% | 29.4% |
| Chicago, IL | $288,100 | 0.9% | 5.1% |
| Cincinnati, OH | $216,700 | 1.2% | 19.1% |
| Cleveland, OH | $179,800 | 1.3% | 16.1% |
| Columbus, OH | $256,200 | 1.2% | 16.5% |
| Dallas, TX | $365,600 | 2.5% | 30.3% |
| Dayton, OH | $162,900 | 0.7% | 18.9% |
| Denver, CO | $557,400 | 2.5% | 24.1% |
| Detroit, MI | $130,400 | 0.2% | 14.1% |
| Elgin, IL | $269,500 | 0.5% | 9.9% |
| Fort Lauderdale, FL | $360,100 | 1.9% | 21.6% |
| Fort Worth, TX | $307,900 | 2.0% | 28.5% |
| Frederick, MD | $511,400 | 0.9% | 14.9% |
| Fresno, CA | $361,900 | 1.2% | 24.7% |
| Grand Rapids, MI | $238,000 | 1.2% | 22.1% |
| Greensboro, NC | $186,600 | 1.1% | 20.4% |
| Greenville, SC | $217,500 | 1.5% | 23.3% |
| Hartford, CT | $275,700 | 0.9% | 16.1% |
| Houston, TX | $266,000 | 1.5% | 23.1% |
| Indianapolis, IN | $222,900 | 1.1% | 21.9% |
| Jacksonville, FL | $303,600 | 2.4% | 28.8% |
| Kansas City, MO | $243,700 | 1.4% | 21.6% |
| Knoxville, TN | $252,900 | 1.9% | 27.1% |
| Lake County, IL | $254,900 | 0.6% | 9.8% |
| Las Vegas, NV | $398,100 | 2.5% | 29.9% |
| Los Angeles, CA | $834,500 | 1.2% | 18.3% |
| Louisville, KY | $204,600 | 0.7% | 6.6% |
| Memphis, TN | $196,600 | 1.9% | 17.9% |
| Miami, FL | $414,500 | 1.5% | 22.0% |
| Milwaukee, WI | $257,900 | 0.9% | 15.8% |
| Minneapolis, MN | $339,000 | 0.8% | 15.2% |
| Montgomery County, PA | $412,700 | 0.7% | 17.0% |
| Nashville, TN | $392,500 | 2.1% | 30.5% |
| Nassau County, NY | $603,200 | 0.5% | 13.0% |
| New Brunswick, NJ | $455,900 | 0.8% | 19.3% |
| New Haven, CT | $284,400 | 1.1% | 18.2% |
| New Orleans, LA | $203,000 | 0.9% | 10.1% |
| Newark, NJ | $454,400 | 0.6% | 11.2% |
| North Port, FL | $364,700 | 3.3% | 40.2% |
| Oakland, CA | $1,043,200 | 2.0% | 21.9% |
| Oklahoma City, OK | $186,100 | 0.9% | 17.2% |
| Omaha, NE | $242,200 | 1.4% | 16.6% |
| Orlando, FL | $329,500 | 2.2% | 29.3% |
| Oxnard, CA | $798,300 | 1.0% | 22.2% |
| Philadelphia, PA | $234,000 | 0.5% | 10.5% |
| Phoenix, AZ | $434,700 | 2.4% | 39.1% |
| Pittsburgh, PA | $160,600 | 0.4% | 7.6% |
| Portland, OR | $524,000 | 1.5% | 20.5% |
| Providence, RI | $385,100 | 0.7% | 17.1% |
| Raleigh, NC | $372,700 | 2.2% | 32.8% |
| Richmond, VA | $294,500 | 0.9% | 14.4% |
| Riverside, CA | $490,100 | 1.8% | 30.3% |
| Rochester, NY | $183,100 | 2.5% | 17.1% |
| Sacramento, CA | $570,400 | 1.3% | 25.1% |
| Salt Lake City, UT | $528,600 | 2.5% | 32.9% |
| San Antonio, TX | $247,600 | 1.5% | 23.2% |
| San Diego, CA | $855,400 | 2.1% | 27.0% |
| San Francisco, CA | $1,574,000 | 1.6% | 15.1% |
| San Jose, CA | $1,567,600 | 3.1% | 25.5% |
| Seattle, WA | $780,500 | 3.2% | 24.5% |
| St. Louis, MO | $186,300 | 1.0% | 9.4% |
| Tacoma, WA | $515,900 | 1.4% | 23.1% |
| Tampa, FL | $319,300 | 2.6% | 30.3% |
| Tucson, AZ | $289,200 | 1.5% | 25.0% |
| Tulsa, OK | $163,200 | 0.7% | 12.8% |
| Honolulu, HI | $872,300 | 0.8% | 18.7% |
| Virginia Beach, VA | $290,100 | 1.1% | 14.5% |
| Warren, MI | $261,100 | 0.7% | 13.8% |
| Washington, DC | $493,300 | 0.8% | 14.0% |
| West Palm Beach, FL | $392,700 | 2.3% | 31.0% |
| Worcester, MA | $362,800 | 0.7% | 17.4% |
| National | $408,900 | 0.6% | 21.7% |


