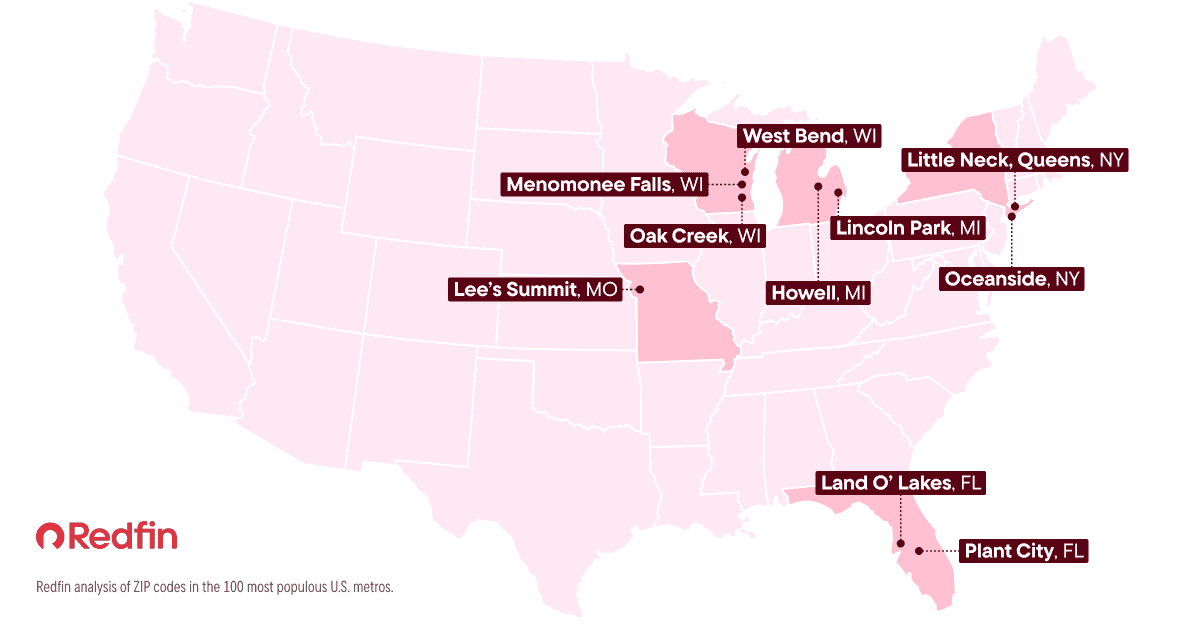
- Two Florida neighborhoods–Land O’ Lakes and Plant City–top Redfin’s list of this year’s hottest neighborhoods.
- Six of the top 10 are Midwest suburbs–a signal that homebuyers are chasing affordability without straying too far from big-city jobs and amenities.
- The New York City area still has pull, too, landing a pair of neighborhoods in the top 10.
Land O’Lakes, FL is Redfin’s hottest neighborhood of 2026, with nearby Plant City, FL close behind. Oak Creek, WI takes the No. 3 spot.
All in all, six of this year’s hottest neighborhoods are in the Midwest–the second straight year America’s heartland has dominated the list of hottest places for homebuyers and sellers.
The suburbs of New York City are also popular with house hunters, with many people searching for homes in neighborhoods that are close to a major city–but not too close.
This is according to a Redfin analysis ranking U.S. zip codes in the 100 most populous metro areas by year-over-year growth in listing views on Redfin.com and Redfin Compete Score—a measure of how difficult it is to win a home. Please note zip codes may encompass more than one neighborhood, village or town, and we use neighborhood names that are representative of the area covered. See the methodology section at the end of this report for more details.
“Midwest cities and lesser-known places in Florida are having a moment—and affordability is the reason,” said Redfin Senior Economist Asad Khan. “Many of these neighborhoods sit just outside major hubs like Milwaukee, Chicago and Tampa, hitting a sweet spot: lower cost of living without giving up access to highly rated schools, shopping and dining. They have the convenience of big cities without the big-city price tags.”
1. Land O’ Lakes, Florida
Zip code: 34637
Parent metro area: Tampa, Florida
Median sale price: $425,000
Median sale price YoY: 7.6%
Median days on market: 66
Change in home sales: 35.9% YoY
Change in median views per listing: 90.9% YoY
Share of homes that sold above list price: 7.5%
In Land O’ Lakes, home sales are up 36% year over year and views of home listings nearly doubled, giving it the top spot in our ranking.
Just 20 miles north of Tampa, this fast-growing suburb blends fresh new construction with established neighborhoods, giving buyers options—and a bit more breathing room than they’ll find in denser cities. With over 38,000 residents, Land O’ Lakes is drawing attention for its parks, strong public schools and easygoing lifestyle.
“There’s a bit more land out here and more space between homes,” said Redfin senior agent Angelo Dass. “A lot of buyers are coming from high-tax states like New York and California, looking for more value.”
It’s not just about space. Locals can bike to everyday errands, enjoy a walkable feel in parts of town and still be within reach of Clearwater’s beaches—striking a balance that’s fueling its surge in popularity.
2. Plant City, Florida
Zip code: 33566
Parent metro area: Tampa, Florida
Median sale price: $320,000
Median sale price YoY: -7.0%
Median days on market: 46
Change in home sales: 5.9% YoY
Change in median views per listing: 30.6% YoY
Share of homes that sold above list price: 13%
Plant City, a neighbor to Land O’Lakes, gives you more house for less money–and house hunters are taking notice. Home sales were up 6% year over year in this Florida town, and views of home listings jumped.
“This area is for people who want to live in Florida but don’t want to be limited to small houses in beach towns without much breathing room between neighbors. In a place like Plant City, they can actually get land–and they get year-round sunshine, too,” Dass said.
Just about 25 miles east of Tampa and 63 miles west of Orlando, this suburb allows its over 45,000 residents the chance to live close to a big city without the hustle and bustle. Plant City is also known for newly constructed communities, giving buyers the option for brand-new homes with a lower price tag than other parts of the Sunshine State.
3. Oak Creek, Wisconsin
Zip code: 53154
Parent metro area: Milwaukee, Wisconsin
Median sale price: $381,200
Median sale price YoY: 12.8%
Median days on market: 42.5
Change in home sales: -3.8% YoY
Change in median views per listing: 26.5% YoY
Share of homes that sold above list price: 38%
In Oak Creek, residents can enjoy many of the same perks they’d get living in Milwaukee–while also getting more space and more room for new construction, according to Redfin Premier agent W.J. Eulberg.
Just south of the city along Lake Michigan, Oak Creek offers a suburban feel with scenic lakeside parks, trails and a town square that anchors the community with shops, restaurants and events.
In the Milwaukee suburb, 38% shares of homes sold above their listing price, and house hunters’ views of listings surged. It is one of the fastest-growing cities in Wisconsin; in addition to its proximity to Milwaukee, it’s within striking distance of Chicago and Minneapolis.

4. Oceanside, New York
Zip code: 11572
Parent metro area: Nassau County, New York
Median sale price: $725,000
Median sale price YoY: 2.8%
Median days on market: 38
Change in home sales: -7.5% YoY
Change in median views per listing: 34.6% YoY
Share of homes that sold above list price: 50%
As the name suggests, Oceanside is just four miles from the Atlantic Ocean. Locals get proximity to New York City combined with the laidback vibes of living on Long Island–and living near beaches, including Long Beach and Jones Beach State Park. House hunters are taking note of Oceanside’s lifestyle: Half of the homes that sell in the area go for above asking price, highlighting the competitiveness of Oceanside’s housing market.
Oceanside is an ideal place to live for Big Apple commuters. It’s part of a bigger trend that started in Long Island during the pandemic, Senior Redfin agent Michael Graziose says. “All of Long Island is off the charts right now,” he said.
5. West Bend, Wisconsin
Zip code: 53090
Parent metro area: Milwaukee, Wisconsin
Median sale price: $350,000
Median sale price YoY: 16.7%
Median days on market: 42
Change in home sales: -8.9% YoY
Change in median views per listing: 19.4% YoY
Share of homes that sold above list price: 45.1%
West Bend is drawing buyers who want small-town charm without giving up big-city access. About 40 minutes from Milwaukee, it offers a quieter pace, more space and relative affordability compared to nearby urban hubs.
West Bend is up and coming, says Eulberg, the Redfin agent in Wisconsin.
“Living in West Bend gives you the ability to get to Milwaukee quickly but still have a small town feel with everything you need,” he said.
The area is known for its parks and trails, making it a hit with outdoor lovers. A walkable downtown and solid schools add to the appeal—especially for buyers priced out of bigger metros who still want an easy commute.
It also offers residents a lower tax rate than Milwaukee County, so their overall cost of living is lower. In West Bend, nearly half of homes sell above their list price, highlighting serious competition for house hunters looking to get into the area.

6. Lincoln Park, Michigan
Zip code: 48146
Parent metro area: Detroit, Michigan
Median sale price: $158,000
Median sale price YoY: 1.9%
Median days on market: 30
Change in home sales: 14.0% YoY
Change in median views per listing: 14.3% YoY
Share of homes that sold above list price: 38.7%
In Lincoln Park, momentum is building in the housing market: Home sales are up 14% year over year and views of home listings are surging.
Just south of Detroit, Lincoln Park gives buyers easy access to the city and airport with a lower price tag. The neighborhood stands out for its tight-knit feel, local parks and a walkable stretch of shops and restaurants–and for outdoor lovers, it punches above its weight in terms of parks and green spaces.
“Everything around is affordable and the quality of life here is great, too. There’s a lifestyle component that attracts people,” said Redfin Premier agent Anne Loehr.
7. Lee’s Summit, Missouri
Zip code: 64081
Parent metro area: Kansas City, Missouri
Median sale price: $397,500
Median sale price YoY: –2.8%
Median days on market: 41
Change in home sales: -16.0% YoY
Change in median views per listing: 31.0% YoY
Share of homes that sold above list price: 30.9%
Lee’s Summit has been rapidly growing for some time, Redfin Premier agent Jo Chavez said.
“When people are searching in Lee’s Summit, it’s rare that they don’t buy in Lee’s Summit,” Chavez said. “It’s got a little bit of everything. I recently worked with one family that was looking to move to a Kansas City suburb, and the minute they stepped in Lee’s Summit, they fell in love and quickly bought a home for above asking price.”
The city has well-established subdivisions, recreation areas as well as charming shops and restaurants. It’s also close to downtown Kansas City and just 25 minutes from Overland Park, KS, another popular suburb.
8. Little Neck, Queens, New York
Zip code: 11362
Parent metro area: New York, NY
Median sale price: $796,500
Median sale price YoY: 35.0%
Median days on market: 49.5
Change in home sales: 11.1% YoY
Change in median views per listing: 26.7% YoY
Share of homes that sold above list price: 26.0%
Little Neck, Queens is gaining traction fast—thanks to its prime spot on the edge of New York City and Long Island.
About 15 miles from Midtown, it’s a commuter’s dream: the Long Island Rail Road gets you into Manhattan in under 30 minutes, with easy access to the Long Island Expressway and Cross Island Parkway for drivers. The neighborhood blends quiet, tree-lined streets with standout perks like waterfront views along Little Neck Bay, top-rated schools and a suburban feel that’s rare in the city.
“It’s the first stop on Long Island, and that proximity to the city is what makes it so desirable,” said Redfin Premier agent Mohamed Elbaroudy. “We don’t have enough inventory for the demand.”
9. Howell, Michigan
Zip code: 48843
Parent metro area: Warren, Michigan
Median sale price: $385,000
Median sale price YoY: 1.7%
Median days on market: 54
Change in home sales: -22.7% YoY
Change in median views per listing: 27.3% YoY
Share of homes that sold above list price: 26.3%
Howell is heating up as buyers look for value without sacrificing charm.
Set between Lansing and Detroit, it’s a sweet spot for commuters heading to either city. The draw? A true small-town feel paired with a revitalized downtown—think new restaurants, boutiques and local shops filling in historic storefronts.
Housing options run the gamut, from classic older homes to new construction, plus properties with acreage just outside town. And demand is tight. “It’s pretty low inventory,” Loehr said. “There aren’t many homes to sell because it’s such a popular place.”
10. Menomonee Falls, Wisconsin
Zip code: 53051
Parent metro area: Milwaukee, Wisconsin
Median sale price: $410,000
Median sale price YoY: -11.4%
Median days on market: 57
Change in home sales: -19.1% YoY
Change in median views per listing: 19.2% YoY
Share of homes that sold above list price: 41.6%
Menomonee Falls lands at No. 10, giving Milwaukee another suburb in the spotlight.
Like nearby West Bend, it pairs easy access to the city with a charming downtown packed with shops and restaurants. Buyers are also drawn to its abundance of parks and the availability of land for new construction.
Competition is fierce—over 40% of homes are selling above list price, and the median sale price now tops Milwaukee’s.
Here’s a video shot live from Land ‘O Lakes and Plant City:
Methodology
This Redfin analysis ranks U.S. zip codes in the 100 most-populous metro areas by year-over-year growth in listing views on Redfin.com and Redfin Compete Score—a measure of how difficult it is to win a home in a particular area based on factors including days on market, share of homes that sold above their listing prices and sale-to-list price ratio. The Compete Score for an area is rated on a scale of 0 to 100, where 100 is the most competitive.
All data represents January – February 2026, with year-over-year data compared against the same timeframe in 2025.
To make the list, a zip code must have recorded 50+ home sales between January 1 and February 28 and have a Redfin Compete Score above 50.
Please note that zip codes may encompass more than one neighborhood, village or town, and we use neighborhood names that are representative of the area covered.
We want to hear your thoughts on this year’s ranking. Join the conversation on LinkedIn and Reddit.
The Hottest Neighborhoods In Your Metro Area
Take a look at the list below to see the hottest neighborhoods in your region. We included the three hottest zip codes in each of the 100 most populous U.S. metropolitan areas (with sufficient data). All data represents January 1-February 28.
| Zip code | Parent metro area | Median sale price | Median sale price, YoY | Parent metro median sale price | Parent metro median sale price, YoY | Share of homes sold above list price | Median views per home listing, YoY change |
| 44223 | Akron, OH | $227,000 | -4.5% | $220,000 | 10.0% | 36.4% | 0.0% |
| 44313 | Akron, OH | $256,000 | 8.5% | $220,000 | 10.0% | 20.0% | -2.7% |
| 44266 | Akron, OH | $224,900 | 24.9% | $220,000 | 10.0% | 35.8% | 1.6% |
| 12309 | Albany, NY | $389,000 | 0.5% | $318,000 | 3.7% | 42.9% | -12.7% |
| 12306 | Albany, NY | $309,000 | 13.4% | $318,000 | 3.7% | 47.0% | 216.3% |
| 12302 | Albany, NY | $298,000 | 5.3% | $318,000 | 3.7% | 46.2% | -6.4% |
| 18103 | Allentown, PA | $310,000 | -1.6% | $335,000 | -3.5% | 43.8% | -2.0% |
| 18104 | Allentown, PA | $365,000 | -3.7% | $335,000 | -3.5% | 36.1% | -17.3% |
| 18017 | Allentown, PA | $365,000 | 4.3% | $335,000 | -3.5% | 50.0% | -19.4% |
| 92869 | Anaheim, CA | $1,037,500 | -5.7% | $1,200,000 | 0.0% | 37.5% | 1.7% |
| 92649 | Anaheim, CA | $1,304,500 | 4.4% | $1,200,000 | 0.0% | 27.9% | -4.2% |
| 92870 | Anaheim, CA | $1,120,000 | 0.9% | $1,200,000 | 0.0% | 42.5% | 8.1% |
| 30265 | Atlanta, GA | $363,500 | -5.6% | $391,169 | 1.0% | 12.8% | 12.5% |
| 30060 | Atlanta, GA | $390,000 | 8.8% | $391,169 | 1.0% | 21.6% | 7.6% |
| 30078 | Atlanta, GA | $360,000 | -5.3% | $391,169 | 1.0% | 16.3% | 11.5% |
| 78729 | Austin, TX | $460,000 | 13.6% | $412,000 | -4.2% | 15.7% | -17.1% |
| 78645 | Austin, TX | $412,000 | -7.8% | $412,000 | -4.2% | 9.7% | -7% |
| 78745 | Austin, TX | $458,000 | -1.7% | $412,000 | -4.2% | 15.1% | -8.6% |
| 93309 | Bakersfield, CA | $341,000 | -1.2% | $380,000 | -1.7% | 29.4% | 7.4% |
| 93560 | Bakersfield, CA | $426,250 | -1.3% | $380,000 | -1.7% | 43.3% | -4.8% |
| 93306 | Bakersfield, CA | $370,000 | 2.1% | $380,000 | -1.7% | 30.3% | 13.5% |
| 21001 | Baltimore, MD | $350,000 | -4.1% | $380,000 | 4.0% | 20.3% | 52.4% |
| 21014 | Baltimore, MD | $415,000 | 2.0% | $380,000 | 4.0% | 39.5% | 0.4% |
| 21078 | Baltimore, MD | $387,490 | 4.7% | $380,000 | 4.0% | 22.2% | -12.6% |
| 70726 | Baton Rouge, LA | $259,250 | 8.0% | $277,143 | 3.4% | 20.4% | -20.0% |
| 70769 | Baton Rouge, LA | $302,000 | -0.2% | $277,143 | 3.4% | 10.7% | -23.1% |
| 70817 | Baton Rouge, LA | $282,500 | -10.3% | $277,143 | 3.4% | 11.9% | 1.6% |
| 35022 | Birmingham, AL | $314,950 | 2.6% | $303,000 | 6.3% | 10.8% | 42.5% |
| 35071 | Birmingham, AL | $271,900 | 5.1% | $303,000 | 6.3% | 12.7% | -2.5% |
| 35124 | Birmingham, AL | $360,000 | 6.5% | $303,000 | 6.3% | 28.1% | -14.4% |
| 83709 | Boise City, ID | $475,000 | 1.1% | $480,495 | 1.2% | 17.9% | 7.6% |
| 83686 | Boise City, ID | $464,990 | 7.4% | $480,495 | 1.2% | 15.5% | 0.0% |
| 83646 | Boise City, ID | $514,756 | -1.0% | $480,495 | 1.2% | 11.9% | 17.8% |
| 02176 | Boston, MA | $823,000 | 4.3% | $690,000 | -2.1% | 54.5% | -4.9% |
| 01906 | Boston, MA | $637,500 | -1.2% | $690,000 | -2.1% | 48.0% | 2.1% |
| 01915 | Boston, MA | $750,000 | 11.8% | $690,000 | -2.1% | 49.2% | -11.4% |
| 06851 | Bridgeport, CT | $630,500 | -5.2% | $620,000 | 2.6% | 51.3% | -13.6% |
| 06611 | Bridgeport, CT | $628,000 | -0.8% | $620,000 | 2.6% | 57.4% | -50.0% |
| 06468 | Bridgeport, CT | $640,000 | 3.2% | $620,000 | 2.6% | 38.1% | -3.0% |
| 14224 | Buffalo, NY | $260,000 | 2.8% | $246,250 | 7.1% | 57.9% | -2.5% |
| 14150 | Buffalo, NY | $250,000 | 11.1% | $246,250 | 7.1% | 56.7% | -8.8% |
| 14223 | Buffalo, NY | $241,000 | -0.8% | $246,250 | 7.1% | 61.3% | -8.4% |
| 08016 | Camden, NJ | $350,000 | 5.2% | $360,000 | 0.8% | 36.0% | 6.2% |
| 08094 | Camden, NJ | $360,000 | 6.5% | $360,000 | 0.8% | 39.1% | -8.9% |
| 08012 | Camden, NJ | $360,000 | 0.0% | $360,000 | 0.8% | 40.0% | -8.1% |
| 33990 | Cape Coral, FL | $347,000 | -7.5% | $371,000 | -4.9% | 9.8% | 45.0% |
| 33912 | Cape Coral, FL | $410,000 | -1.2% | $371,000 | -4.9% | 1.8% | 2.0% |
| 33967 | Cape Coral, FL | $369,000 | -10.7% | $371,000 | -4.9% | 5.0% | 12.1% |
| 29410 | Charleston, SC | $410,000 | -3.5% | $434,800 | -0.4% | 5.5% | 0.0% |
| 29414 | Charleston, SC | $479,000 | 8.9% | $434,800 | -0.4% | 7.6% | -16.8% |
| 28112 | Charlotte, NC | $410,000 | -1.8% | $401,250 | 1.6% | 20.3% | 3.7% |
| 28269 | Charlotte, NC | $360,000 | 2.0% | $401,250 | 1.6% | 21.2% | -13.8% |
| 29720 | Charlotte, NC | $380,000 | 26.7% | $401,250 | 1.6% | 16.6% | -9.4% |
| 60651 | Chicago, IL | $361,000 | 3.1% | $360,000 | 4.3% | 43.1% | 13.9% |
| 60142 | Chicago, IL | $397,750 | -0.5% | $360,000 | 4.3% | 18.7% | 150.0% |
| 60634 | Chicago, IL | $377,500 | 1.8% | $360,000 | 4.3% | 43.6% | 2.9% |
| 41001 | Cincinnati, OH | $293,200 | -8.8% | $299,900 | 3.4% | 17.2% | 9.1% |
| 45245 | Cincinnati, OH | $341,325 | 7.7% | $299,900 | 3.4% | 17.2% | 46.4% |
| 41005 | Cincinnati, OH | $329,900 | 11.6% | $299,900 | 3.4% | 15.1% | 72.7% |
| 44094 | Cleveland, OH | $245,000 | -6.1% | $230,000 | 4.5% | 24.7% | 17.4% |
| 44124 | Cleveland, OH | $247,000 | 9.8% | $230,000 | 4.5% | 24.6% | 2.3% |
| 44118 | Cleveland, OH | $223,750 | -8.7% | $230,000 | 4.5% | 26.0% | -11.5% |
| 43206 | Columbus, OH | $315,000 | -7.3% | $332,000 | 3.1% | 14.3% | -3.5% |
| 43229 | Columbus, OH | $285,000 | -1.7% | $332,000 | 3.1% | 23.2% | -5.8% |
| 43113 | Columbus, OH | $295,000 | 25.5% | $332,000 | 3.1% | 22.2% | 31.0% |
| 75069 | Dallas, TX | $389,500 | -2.6% | $399,000 | -3.9% | 6.4% | -1.0% |
| 75154 | Dallas, TX | $394,990 | 3.3% | $399,000 | -3.9% | 19.3% | -2.1% |
| 75028 | Dallas, TX | $491,500 | -2.7% | $399,000 | -3.9% | 22.1% | -13.3% |
| 45385 | Dayton, OH | $261,400 | 25.1% | $225,000 | 0.0% | 23.1% | -3.8% |
| 45322 | Dayton, OH | $228,950 | 9.4% | $225,000 | 0.0% | 21.2% | 2.6% |
| 45373 | Dayton, OH | $263,750 | 2.9% | $225,000 | 0.0% | 15.3% | -6.3% |
| 80018 | Denver, CO | $531,250 | 0.6% | $575,000 | -4.2% | 15.3% | 12.9% |
| 80224 | Denver, CO | $562,000 | 0.8% | $575,000 | -4.2% | 23.2% | 2.3% |
| 80015 | Denver, CO | $541,450 | 1.2% | $575,000 | -4.2% | 25.3% | 11.0% |
| 50312 | Des Moines, IA | $268,750 | 2.2% | $290,000 | 0.9% | 13.0% | 26.7% |
| 50322 | Des Moines, IA | $277,000 | -0.2% | $290,000 | 0.9% | 19.7% | -18.2% |
| 50265 | Des Moines, IA | $299,000 | -2.4% | $290,000 | 0.9% | 13.5% | -21.9% |
| 48146 | Detroit, MI | $158,000 | 1.9% | $180,000 | 2.0% | 38.7% | 14.3% |
| 48135 | Detroit, MI | $218,500 | 13.7% | $180,000 | 2.0% | 40.5% | 23.6% |
| 48125 | Detroit, MI | $163,900 | 2.4% | $180,000 | 2.0% | 32.9% | -4.3% |
| 60174 | Elgin, IL | $422,495 | 6.3% | $367,400 | 9.5% | 29.0% | 11.0% |
| 60140 | Elgin, IL | $386,990 | 20.6% | $367,400 | 9.5% | 11.3% | 79.3% |
| 60543 | Elgin, IL | $389,990 | -1.3% | $367,400 | 9.5% | 16.9% | -23.4% |
| 33023 | Fort Lauderdale, FL | $480,000 | 1.6% | $459,500 | -0.1% | 24.0% | -30.4% |
| 33334 | Fort Lauderdale, FL | $546,500 | 9.8% | $459,500 | -0.1% | 5.3% | 10% |
| 33323 | Fort Lauderdale, FL | $510,000 | -10.5% | $459,500 | -0.1% | 9.1% | 1.5% |
| 76020 | Fort Worth, TX | $332,800 | -8.2% | $354,000 | 1.1% | 17.6% | 14.1% |
| 76021 | Fort Worth, TX | $390,000 | 4.0% | $354,000 | 1.1% | 25.0% | 7.8% |
| 76244 | Fort Worth, TX | $395,000 | 4.6% | $354,000 | 1.1% | 16.1% | 5.9% |
| 21774 | Frederick, MD | $545,000 | -10.8% | $550,000 | 1.3% | 17.9% | 8.9% |
| 20852 | Frederick, MD | $601,400 | 27.4% | $550,000 | 1.3% | 28.1% | -18.6% |
| 21771 | Frederick, MD | $580,500 | 6.1% | $550,000 | 1.3% | 38.3% | -34.1% |
| 93727 | Fresno, CA | $412,820 | -4.0% | $415,000 | -3.5% | 23.2% | -37.9% |
| 93611 | Fresno, CA | $477,000 | -0.6% | $415,000 | -3.5% | 24.3% | -24.7% |
| 93722 | Fresno, CA | $409,750 | -1.1% | $415,000 | -3.5% | 36.7% | -17.6% |
| 46356 | Gary, IN | $339,404 | 6.8% | $283,000 | 2.9% | 4.9% | -19.7% |
| 46383 | Gary, IN | $329,900 | 8.2% | $283,000 | 2.9% | 14.5% | -1.5% |
| 46304 | Gary, IN | $317,500 | 5.3% | $283,000 | 2.9% | 27.3% | -27.9% |
| 49418 | Grand Rapids, MI | $364,500 | 2.7% | $330,000 | 1.5% | 22.1% | 20.0% |
| 49319 | Grand Rapids, MI | $354,900 | 8.4% | $330,000 | 1.5% | 27.3% | -11.9% |
| 49417 | Grand Rapids, MI | $357,950 | -2.2% | $330,000 | 1.5% | 15.7% | -26.8% |
| 27265 | Greensboro, NC | $297,000 | 8.0% | $290,000 | -1.0% | 18.3% | -1.5% |
| 27406 | Greensboro, NC | $255,000 | -1.9% | $290,000 | -1.0% | 24.7% | -4.6% |
| 27405 | Greensboro, NC | $255,825 | 0.6% | $290,000 | -1.0% | 22.0% | -26.1% |
| 29680 | Greenville, SC | $340,000 | -2.7% | $334,910 | 3.0% | 14.0% | 3.9% |
| 29605 | Greenville, SC | $335,500 | 4.8% | $334,910 | 3.0% | 13.4% | -8.5% |
| 29617 | Greenville, SC | $300,000 | 1.7% | $334,910 | 3.0% | 5.7% | 5.4% |
| 06051 | Hartford, CT | $340,000 | 13.3% | $360,000 | 4.3% | 62.7% | -5.2% |
| 06457 | Hartford, CT | $332,500 | 2.3% | $360,000 | 4.3% | 58.3% | -14.7% |
| 06489 | Hartford, CT | $410,000 | 5.1% | $360,000 | 4.3% | 52.9% | -18.1% |
| 96744 | Honolulu, HI | $875,000 | -4.1% | $700,000 | 4.8% | 19.7% | 16.6% |
| 96789 | Honolulu, HI | $625,925 | -3.3% | $700,000 | 4.8% | 30.4% | -11.6% |
| 96706 | Honolulu, HI | $822,500 | 1.9% | $700,000 | 4.8% | 26.1% | -6.9% |
| 77070 | Houston, TX | $293,375 | -9.7% | $325,000 | -0.5% | 8.6% | -4.5% |
| 77051 | Houston, TX | $303,990 | -3.9% | $325,000 | -0.5% | 10.3% | -19.0% |
| 77545 | Houston, TX | $296,284 | -1.6% | $325,000 | -0.5% | 13.0% | 4.2% |
| 46239 | Indianapolis, IN | $325,000 | 2.4% | $300,000 | 0.7% | 10.4% | 15.0% |
| 46112 | Indianapolis, IN | $325,000 | -2.7% | $300,000 | 0.7% | 14.3% | 16.4% |
| 46122 | Indianapolis, IN | $360,000 | 6.8% | $300,000 | 0.7% | 13.2% | 42.9% |
| 32065 | Jacksonville, FL | $362,000 | -4.5% | $365,000 | -1.1% | 20.0% | 60.0% |
| 32223 | Jacksonville, FL | $417,500 | -9.2% | $365,000 | -1.1% | 10.8% | 11.7% |
| 32246 | Jacksonville, FL | $320,000 | -11.1% | $365,000 | -1.1% | 17.6% | 28.4% |
| 64081 | Kansas City, MO | $397,500 | -2.8% | $339,900 | 4.6% | 31.0% | |
| 66109 | Kansas City, MO | $320,000 | -1.4% | $339,900 | 4.6% | 11.7% | |
| 64015 | Kansas City, MO | $315,000 | 6.1% | $339,900 | 4.6% | 23.5% | |
| 37923 | Knoxville, TN | $400,000 | 0.0% | $392,450 | 1.9% | 18.7% | -98.8% |
| 37849 | Knoxville, TN | $390,000 | 1.7% | $392,450 | 1.9% | 25.3% | -92.5% |
| 37920 | Knoxville, TN | $346,500 | -3.1% | $392,450 | 1.9% | 15.6% | -89.8% |
| 60030 | Lake County, IL | $340,000 | 12.4% | $354,000 | 10.6% | 36.5% | -0.8% |
| 60046 | Lake County, IL | $358,950 | 8.5% | $354,000 | 10.6% | 33.3% | -1.6% |
| 60060 | Lake County, IL | $409,500 | 1.7% | $354,000 | 10.6% | 36.0% | -1.4% |
| 33810 | Lakeland, FL | $329,750 | 0.1% | $305,000 | -3.2% | 17.1% | 26.4% |
| 33809 | Lakeland, FL | $294,900 | -1.7% | $305,000 | -3.2% | 13.1% | -12.8% |
| 33803 | Lakeland, FL | $290,000 | -3.3% | $305,000 | -3.2% | 10.5% | -13.7% |
| 89130 | Las Vegas, NV | $420,000 | -8.2% | $440,000 | -0.6% | 21.5% | -7.6% |
| 89002 | Las Vegas, NV | $445,000 | 3.5% | $440,000 | -0.6% | 11.8% | -16.2% |
| 89123 | Las Vegas, NV | $450,000 | 4.7% | $440,000 | -0.6% | 14.7% | -7.8% |
| 72015 | Little Rock, AR | $215,000 | 6.2% | $249,000 | 9.2% | 20.5% | -8.7% |
| 72032 | Little Rock, AR | $215,000 | 7.0% | $249,000 | 9.2% | 11.1% | 1.7% |
| 72205 | Little Rock, AR | $235,000 | 11.1% | $249,000 | 9.2% | 11.9% | -7.0% |
| 91367 | Los Angeles, CA | $1,012,500 | -12.0% | $903,000 | -1.7% | 23.9% | 26.9% |
| 91355 | Los Angeles, CA | $785,750 | -2.7% | $903,000 | -1.7% | 34.8% | 19.1% |
| 90043 | Los Angeles, CA | $850,500 | -5.0% | $903,000 | -1.7% | 36.8% | -11.0% |
| 40165 | Louisville, KY | $300,000 | 9.5% | $279,990 | 7.7% | 17.4% | -5.6% |
| 40219 | Louisville, KY | $249,000 | 8.3% | $279,990 | 7.7% | 32.9% | -27.2% |
| 40291 | Louisville, KY | $310,000 | -1.2% | $279,990 | 7.7% | 14.0% | -25.8% |
| 38654 | Memphis, TN | $343,000 | -7.8% | $282,250 | 4.5% | 12.8% | -23.1% |
| 38104 | Memphis, TN | $339,000 | 0.6% | $282,250 | 4.5% | 11.9% | -72.3% |
| 38672 | Memphis, TN | $340,000 | -0.8% | $282,250 | 4.5% | 14.5% | -25.0% |
| 33173 | Miami, FL | $550,000 | 17.6% | $561,000 | -2.4% | 11.9% | 8.5% |
| 33186 | Miami, FL | $540,000 | 4.9% | $561,000 | -2.4% | 12.4% | -10.1% |
| 33177 | Miami, FL | $580,000 | 3.0% | $561,000 | -2.4% | 11.7% | -13.0% |
| 53154 | Milwaukee, WI | $381,200 | 12.8% | $329,900 | 0.0% | 38.0% | 26.5% |
| 53090 | Milwaukee, WI | $350,000 | 16.7% | $329,900 | 0.0% | 45.1% | 19.4% |
| 53051 | Milwaukee, WI | $410,000 | -11.4% | $329,900 | 0.0% | 41.6% | 19.2% |
| 55033 | Minneapolis, MN | $368,750 | 5.5% | $380,000 | -1.3% | 25.0% | 6.0% |
| 55311 | Minneapolis, MN | $452,250 | -12.9% | $380,000 | -1.3% | 26.9% | 20.5% |
| 55378 | Minneapolis, MN | $420,000 | 0.4% | $380,000 | -1.3% | 21.9% | -2.2% |
| 19446 | Montgomery County, PA | $434,000 | 0.3% | $469,950 | 2.2% | 41.4% | 4.5% |
| 19426 | Montgomery County, PA | $545,000 | 9.0% | $469,950 | 2.2% | 38.6% | 23.8% |
| 19020 | Montgomery County, PA | $425,100 | 9.0% | $469,950 | 2.2% | 23.6% | 7.8% |
| 37174 | Nashville, TN | $490,000 | 0.0% | $459,900 | 0.0% | 17.5% | -22.6% |
| 37208 | Nashville, TN | $507,450 | -1.5% | $459,000 | 0.0% | 4.7% | -40.0% |
| 37080 | Nashville, TN | $461,208 | 1.8% | $459,900 | 0.0% | 16.7% | 6.7% |
| 11572 | Nassau County, NY | $725,000 | 2.8% | $730,500 | 2.2% | 50.0% | 34.6% |
| 11758 | Nassau County, NY | $790,500 | 8.6% | $730,500 | 2.2% | 69.8% | -4.7% |
| 11725 | Nassau County, NY | $805,000 | 3.9% | $730,500 | 2.2% | 63.2% | -2.4% |
| 07753 | New Brunswick, NJ | $620,000 | 0.6% | $545,000 | 2.8% | 44.9% | 19.4% |
| 07701 | New Brunswick, NJ | $615,000 | 0.0% | $545,000 | 2.8% | 54.5% | -6.4% |
| 07747 | New Brunswick, NJ | $518,000 | 0.6% | $545,000 | 2.8% | 49.3% | -26.2% |
| 06512 | New Haven, CT | $371,000 | 9.1% | $379,900 | 2.7% | 53.6% | -21.3% |
| 06492 | New Haven, CT | $397,700 | 9.0% | $379,900 | 2.7% | 62.7% | -39.4% |
| 06516 | New Haven, CT | $388,000 | 7.8% | $379,900 | 2.7% | 41.3% | -24.1% |
| 70065 | New Orleans, LA | $270,450 | 1.7% | $297,500 | 3.1% | 10.7% | -27.8% |
| 70435 | New Orleans, LA | $325,000 | 4.8% | $297,500 | 3.1% | 10.8% | 11.8% |
| 70448 | New Orleans, LA | $348,500 | -1.6% | $207,500 | 3.1% | 8.3% | -3.8% |
| 11362 | New York, NY | $796,500 | 35.0% | $795,000 | 3.9% | 26.0% | 26.7% |
| 07010 | New York, NY | $651,500 | -8.6% | $795,000 | 3.9% | 22.4% | 16.2% |
| 10305 | New York, NY | $725,000 | 6.1% | $795,000 | 3.9% | 34.2% | 1.7% |
| 07108 | Newark, NJ | $660,000 | 23.4% | $590,000 | 5.6% | 70.6% | 23.0% |
| 07834 | Newark, NJ | $702,500 | 16.1% | $590,000 | 5.6% | 51.7% | 9.3% |
| 07083 | Newark, NJ | $580,000 | 0.0% | $590,000 | 5.6% | 66.0% | 5.0% |
| 34292 | North Port, FL | $380,000 | -6.8% | $425,000 | 2.4% | 0.9% | 33.3% |
| 34232 | North Port, FL | $360,500 | -0.6% | $425,000 | 2.4% | 11.3% | 15.7% |
| 34209 | North Port, FL | $357,000 | -13.0% | $425,000 | 2.4% | 8.8% | 18.2% |
| 94598 | Oakland, CA | $1,200,000 | -2.0% | $877,750 | -5.6% | 38.6% | 44.0% |
| 94546 | Oakland, CA | $1,070,000 | -0.9% | $877,750 | -5.6% | 65.5% | 6.8% |
| 94577 | Oakland, CA | $800,000 | -0.4% | $877,750 | -5.6% | 66.7% | -2.7% |
| 73170 | Oklahoma City, OK | $304,000 | 5.9% | $266,000 | -0.4% | 10.6% | -10.0% |
| 73069 | Oklahoma City, OK | $263,000 | -4.4% | $266,000 | -0.4% | 13.0% | -25.0% |
| 73160 | Oklahoma City, OK | $230,000 | -4.2% | $266,000 | -0.4% | 30.4% | -5.7% |
| 68116 | Omaha, NE | $373,778 | 7.3% | $318,063 | 5.3% | 49.1% | 25.9% |
| 68123 | Omaha, NE | $319,644 | -4.7% | $318,063 | 5.3% | 76.7% | -1.7% |
| 68154 | Omaha, NE | $335,000 | -0.1% | $318,063 | 5.3% | 49.2% | 5.4% |
| 32746 | Orlando, FL | $427,500 | -10.5% | $400,000 | 0.0% | 11.4% | 34.7% |
| 32837 | Orlando, FL | $400,000 | -3.4% | $400,000 | 0.0% | 11.9% | 8.3% |
| 32824 | Orlando, FL | $400,000 | -3.6% | $400,000 | 0.0% | 9.9% | 25.0% |
| 93003 | Oxnard, CA | $832,500 | 4.6% | $870,000 | -2.8% | 26.8% | 12.1% |
| 93021 | Oxnard, CA | $998,000 | 13.2% | $870,000 | -2.8% | 27.7% | -17.7% |
| 91320 | Oxnard, CA | $945,000 | -3.8% | $870,000 | -2.8% | 19.8% | -12.6% |
| 19148 | Philadelphia, PA | $280,000 | 6.7% | $280,750 | 2.3% | 19.8% | 7.8% |
| 19026 | Philadelphia, PA | $325,000 | 12.8% | $280,750 | 2.3% | 27.8% | -1.4% |
| 19154 | Philadelphia, PA | $337,000 | 7.0% | $280,750 | 2.3% | 40.0% | -1.9% |
| 85022 | Phoenix, AZ | $430,000 | -4.4% | $465,000 | -1.6% | 14.4% | 24.6% |
| 85203 | Phoenix, AZ | $510,950 | 8.7% | $465,000 | -1.6% | 14.1% | 5.8% |
| 85120 | Phoenix, AZ | $427,990 | -7.5% | $465,000 | -1.6% | 14.5% | 23.8% |
| 15205 | Pittsburgh, PA | $215,000 | -5.9% | $235,150 | 2.2% | 22.4% | 28.8% |
| 15642 | Pittsburgh, PA | $247,500 | -7.0% | $235,150 | 2.2% | 20.2% | 0.0% |
| 15601 | Pittsburgh, PA | $250,000 | 6.4% | $235,150 | 2.2% | 22.0% | -14.3% |
| 97055 | Portland, OR | $531,500 | -2.5% | $539,900 | 0.0% | 23.3% | 2.1% |
| 97223 | Portland, OR | $593,352 | -1.1% | $539,900 | 0.0% | 18.4% | 9.6% |
| 97211 | Portland, OR | $575,000 | 16.2% | $539,900 | 0.0% | 33.3% | 17.5% |
| 02920 | Providence, RI | $460,000 | 0.0% | $492,250 | 2.6% | 46.7% | 1.7% |
| 02720 | Providence, RI | $473,685 | 5.3% | $492,250 | 2.6% | 44.8% | 2.0% |
| 02864 | Providence, RI | $515,000 | 1.4% | $492,250 | 2.6% | 48.3% | 1.8% |
| 27592 | Raleigh, NC | $400,000 | -0.9% | $429,320 | 2.2% | 8.8% | 7.4% |
| 27603 | Raleigh, NC | $415,000 | -2.4% | $429,320 | 2.2% | 7.9% | 8.8% |
| 27587 | Raleigh, NC | $482,500 | 1.6% | $429,320 | 2.2% | 9.8% | 17.8% |
| 23236 | Richmond, VA | $385,000 | 2.7% | $395,000 | 1.4% | 31.6% | 14.1% |
| 23060 | Richmond, VA | $419,364 | -2.4% | $395,000 | 1.4% | 21.8% | 22.7% |
| 23112 | Richmond, VA | $420,000 | 2.4% | $395,000 | 1.4% | 32.1% | 14.9% |
| 92399 | Riverside, CA | $565,000 | -1.3% | $579,000 | -1.9% | 36.8% | 11.2% |
| 92555 | Riverside, CA | $578,205 | -3.1% | $579,000 | -1.9% | 43.1% | 30.9% |
| 92507 | Riverside, CA | $625,000 | -1.8% | $579,000 | -1.9% | 31.8% | 31.2% |
| 14624 | Rochester, NY | $230,000 | 0.0% | $240,000 | 9.1% | 80.8% | -2.0% |
| 14612 | Rochester, NY | $252,500 | 1.0% | $240,000 | 9.1% | 70.0% | -2.5% |
| 14626 | Rochester, NY | $249,500 | 4.0% | $240,000 | 9.1% | 69.0% | -6.6% |
| 95662 | Sacramento, CA | $560,000 | -1.8% | $570,000 | -2.2% | 38.1% | 9.4% |
| 95624 | Sacramento, CA | $615,000 | -5.0% | $570,000 | -2.2% | 45.2% | 7.2% |
| 95678 | Sacramento, CA | $525,000 | -8.7% | $570,000 | -2.2% | 37.7% | 8.8% |
| 84084 | Salt Lake City, UT | $487,400 | -1.5% | $533,000 | 0.8% | 20.7% | 16.0% |
| 84129 | Salt Lake City, UT | $481,700 | 5.1% | $533,000 | 0.8% | 20.3% | 17.0% |
| 84117 | Salt Lake City, UT | $507,500 | -31.0% | $533,000 | 0.8% | 18.3% | -23.5% |
| 78251 | San Antonio, TX | $280,999 | -2.8% | $295,000 | 1.8% | 13.7% | -7.1% |
| 78230 | San Antonio, TX | $358,500 | -6.9% | $295,000 | 1.8% | 7.1% | -13.8% |
| 78240 | San Antonio, TX | $275,000 | -0.9% | $295,000 | 1.8% | 15.1% | 30.8% |
| 92020 | San Diego, CA | $890,000 | 2.0% | $899,500 | -0.1% | 40.0% | 9.5% |
| 91910 | San Diego, CA | $800,750 | 0.7% | $899,500 | -0.1% | 41.7% | 20.0% |
| 92065 | San Diego, CA | $796,500 | -2.3% | $899,500 | -0.1% | 32.0% | 10.1% |
| 94122 | San Francisco, CA | $1,750,000 | 7.7% | $1,545,000 | 3.0% | 80.0% | 5.6% |
| 94403 | San Francisco, CA | $1,525,000 | -18.7% | $1,545,000 | 3.0% | 63.0% | 0.0% |
| 94044 | San Francisco, CA | $1,347,000 | 3.5% | $1,545,000 | 3.0% | 54.0% | -19.7% |
| 95051 | San Jose, CA | $1,831,000 | 9.0% | $1,562,000 | -1.1% | 68.3% | 33.8% |
| 95125 | San Jose, CA | $1,775,000 | -4.1% | $1,562,000 | -1.1% | 61.6% | -11.1% |
| 94086 | San Jose, CA | $1,610,000 | -5.4% | $1,562,000 | -1.1% | 56.6% | -16.2% |
| 98296 | Seattle, WA | $857,500 | -8.9% | $802,750 | 0.3% | 12.2% | 215.0% |
| 98290 | Seattle, WA | $935,000 | 16.1% | $802,750 | 0.3% | 19.5% | 3.3% |
| 98133 | Seattle, WA | $700,000 | -3.1% | $802,750 | 0.3% | 24.3% | -7.4% |
| 63130 | St. Louis, MO | $332,450 | 11.6% | $268,500 | 7.4% | 32.1% | 29.9% |
| 63052 | St. Louis, MO | $295,000 | 7.3% | $268,500 | 7.4% | 44.1% | 16.4% |
| 63123 | St. Louis, MO | $250,000 | 1.0% | $268,500 | 7.4% | 37.3% | 2.8% |
| 95209 | Stockton, CA | $477,000 | -6.5% | $505,000 | -3.8% | 39.7% | 8.0% |
| 95376 | Stockton, CA | $587,500 | -0.2% | $505,000 | -3.8% | 36.7% | -7.8% |
| 95240 | Stockton, CA | $470,000 | -6.1% | $505,000 | -3.8% | 25.3% | 14.5% |
| 98338 | Tacoma, WA | $587,450 | -2.1% | $585,000 | 6.4% | 47.5% | 36.5% |
| 98372 | Tacoma, WA | $648,750 | 3.6% | $585,000 | 6.4% | 34.0% | -12.6% |
| 98466 | Tacoma, WA | $635,000 | 0.5% | $585,000 | 6.4% | 33.3% | 16.4% |
| 34637 | Tampa, FL | $425,000 | 7.6% | $380,500 | 2.8% | 7.5% | 90.9% |
| 33566 | Tampa, FL | $320,000 | -7.0% | $380,500 | 2.8% | 13.0% | 30.6% |
| 33771 | Tampa, FL | $335,000 | 12.6% | $380,500 | 2.8% | 6.3% | 28.8% |
| 85748 | Tucson, AZ | $362,500 | -11.9% | $365,000 | -1.4% | 17.7% | 10.5% |
| 85747 | Tucson, AZ | $395,000 | -1.3% | $365,000 | -1.4% | 10.1% | 6.0% |
| 85716 | Tucson, AZ | $344,000 | -3.1% | $365,000 | -1.4% | 9.8% | -17.5% |
| 74055 | Tulsa, OK | $320,000 | 0.1% | $275,000 | 5.8% | 24.1% | -14.3% |
| 74136 | Tulsa, OK | $300,000 | 11.7% | $275,000 | 5.8% | 17.5% | -0.9% |
| 74105 | Tulsa, OK | $317,250 | 6.8% | $275,000 | 5.8% | 9.8% | 2.9% |
| 23703 | Virginia Beach, VA | $343,000 | 8.9% | $360,000 | 2.9% | 33.7% | 7.0% |
| 23505 | Virginia Beach, VA | $321,100 | -1.2% | $360,000 | 2.9% | 33.3% | -0.7% |
| 23452 | Virginia Beach, VA | $366,000 | 1.7% | $360,000 | 2.9% | 38.9% | 0.8% |
| 48843 | Warren, MI | $385,000 | 1.7% | $301,500 | 3.9% | 26.3% | 27.3% |
| 48036 | Warren, MI | $270,000 | 17.4% | $301,500 | 3.9% | 23.5% | 15.5% |
| 48346 | Warren, MI | $380,000 | 5.3% | $301,500 | 3.9% | 31.6% | 17.1% |
| 20008 | Washington, DC | $510,000 | -18.8% | $564,795 | 1.8% | 12.5% | -4.4% |
| 20121 | Washington, DC | $527,500 | 0.5% | $564,795 | 1.8% | 32.7% | -5.5% |
| 22152 | Washington, DC | $650,000 | 2.4% | $564,795 | 1.8% | 29.5% | -15.7% |
| 19808 | Wilmington, DE | $395,000 | 6.8% | $350,000 | 0.0% | 39.6% | 5.1% |
| 19702 | Wilmington, DE | $370,000 | 8.9% | $350,000 | 0.0% | 30.7% | -1.7% |
| 19720 | Wilmington, DE | $314,500 | 4.0% | $350,000 | 0.0% | 38.0% | -10.4% |
| 01606 | Worcester, MA | $422,500 | -1.2% | $450,000 | -1.3% | 38.9% | -2.9% |
| 01420 | Worcester, MA | $415,000 | 0.6% | $450,000 | -1.3% | 46.2% | -15.8% |
| 01453 | Worcester, MA | $413,000 | -6.1% | $450,000 | -1.3% | 37.3% | -22.5% |