
Home sales fell in May for only the second time on record, while home prices saw the smallest May increase on record. That helped ease the inventory crunch, with the number of homes for sale posting the smallest drop since 2019.
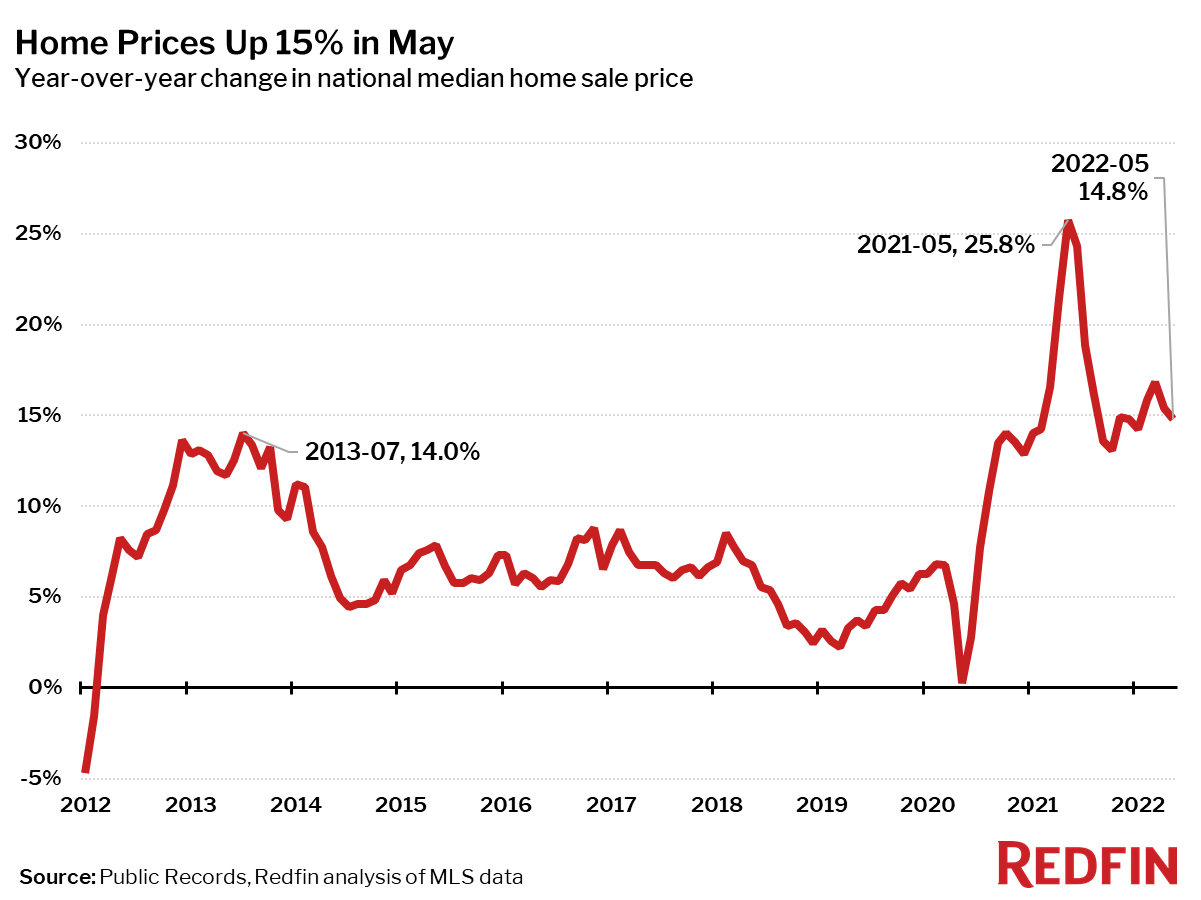
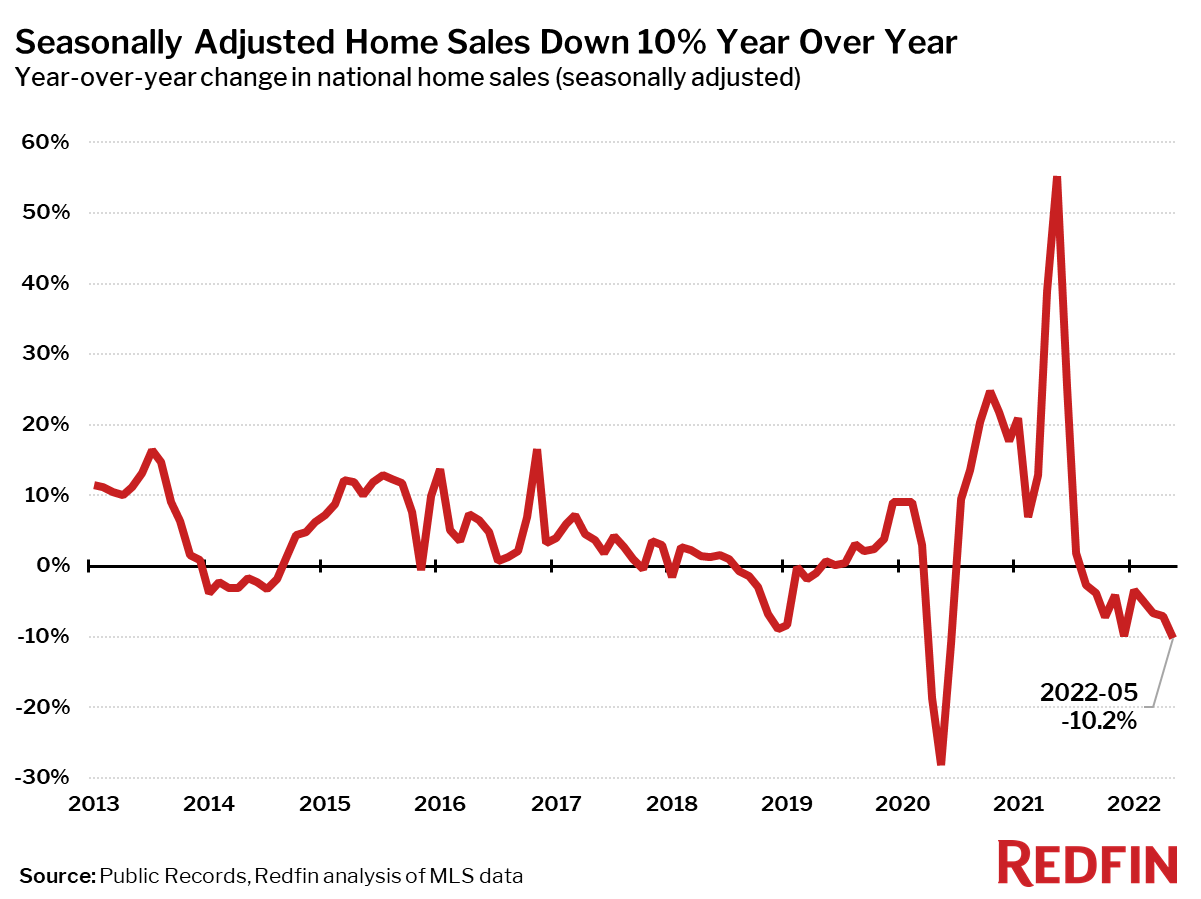
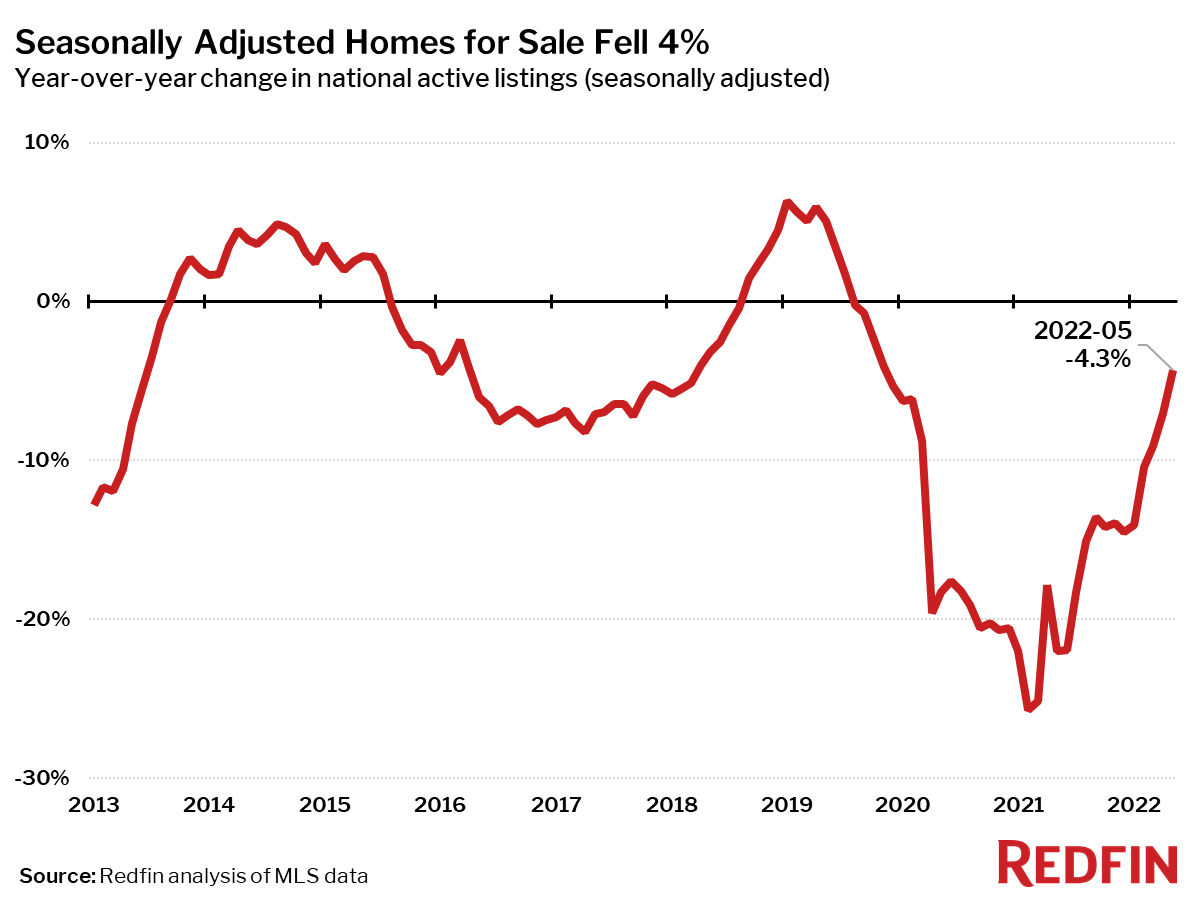
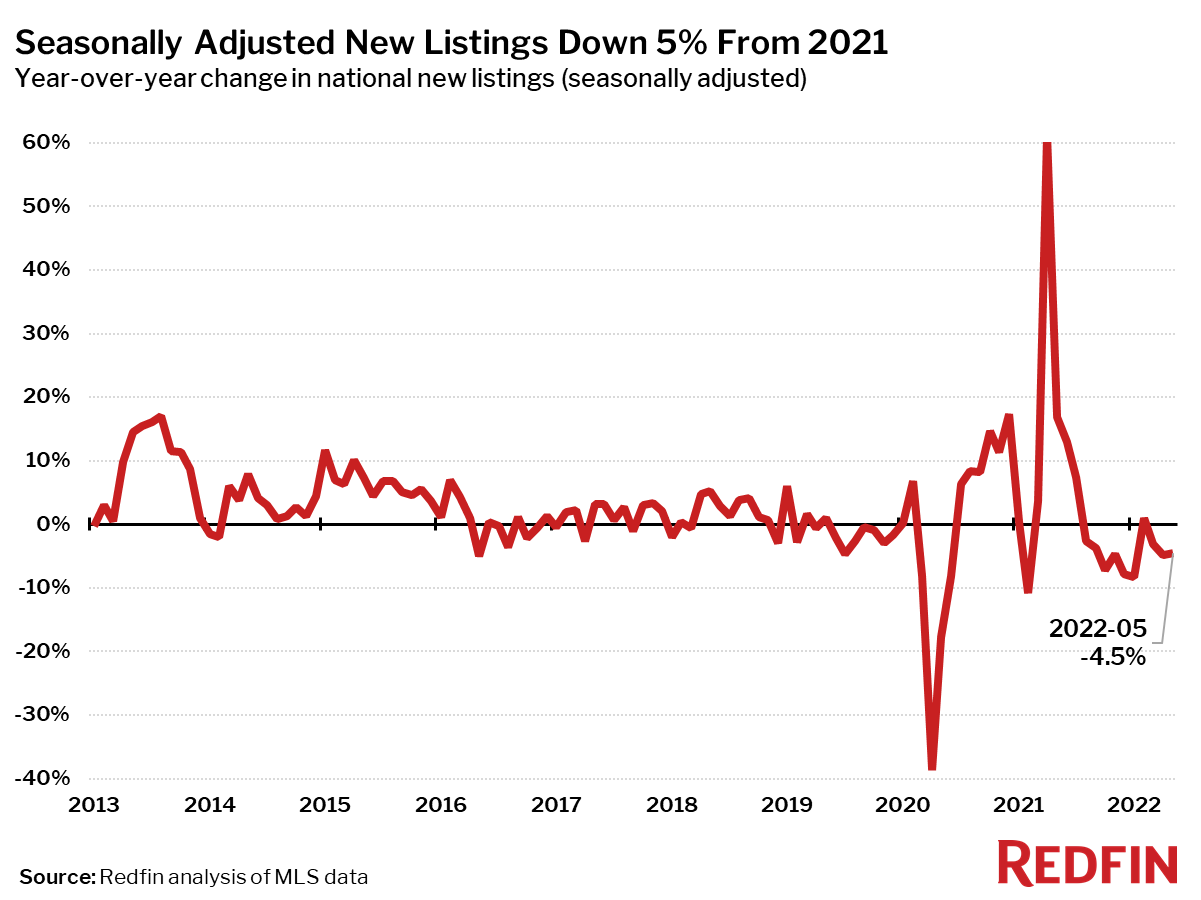
Home prices rose 1.5% month over month in May, their smallest increase of any May in Redfin’s records, which go back to 2012. The housing market cooled considerably as mortgage rates climbed to their highest levels since 2009. Seasonally-adjusted home sales fell 3% month over month, their only May decline on record outside of 2020, when the start of the pandemic sent shockwaves through the housing market. Despite this decline in demand, the inventory of homes for sale still fell from a year earlier. As the market remains tight and new listings also decline, May saw the smallest drop in active listings since November 2019.
“The sudden and dramatic surge in mortgage rates has been a shock to the system for housing,” said Redfin chief economist Daryl Fairweather. “With inflation still at 40-year highs, mortgage rates are likely to stay elevated for a while, so the market will have to adjust to this new reality. The good news is that cheap debt is no longer fueling unsustainable home price growth, and existing homeowners are in a good position, holding record high home equity with debt financed at record low mortgage rates. Homebuyers however are facing mortgage rates near 6%, which means the housing-market slowdown will likely continue into the fall, but one silver lining is that homebuyers are facing less competition for the first time in two years.”
| Market Summary | May 2022 | Month-Over-Month | Year-Over-Year |
|---|---|---|---|
| Median sale price | $430,600 | 1.5% | 14.8% |
| Homes sold, seasonally-adjusted | 556,200 | -3.0% | -10.2% |
| Pending sales, seasonally-adjusted | 516,500 | 0.3% | -9.2% |
| New listings, seasonally-adjusted | 614,200 | 0.8% | -4.5% |
| All Homes for sale, seasonally-adjusted | 1,372,800 | -0.7% | -4.3% |
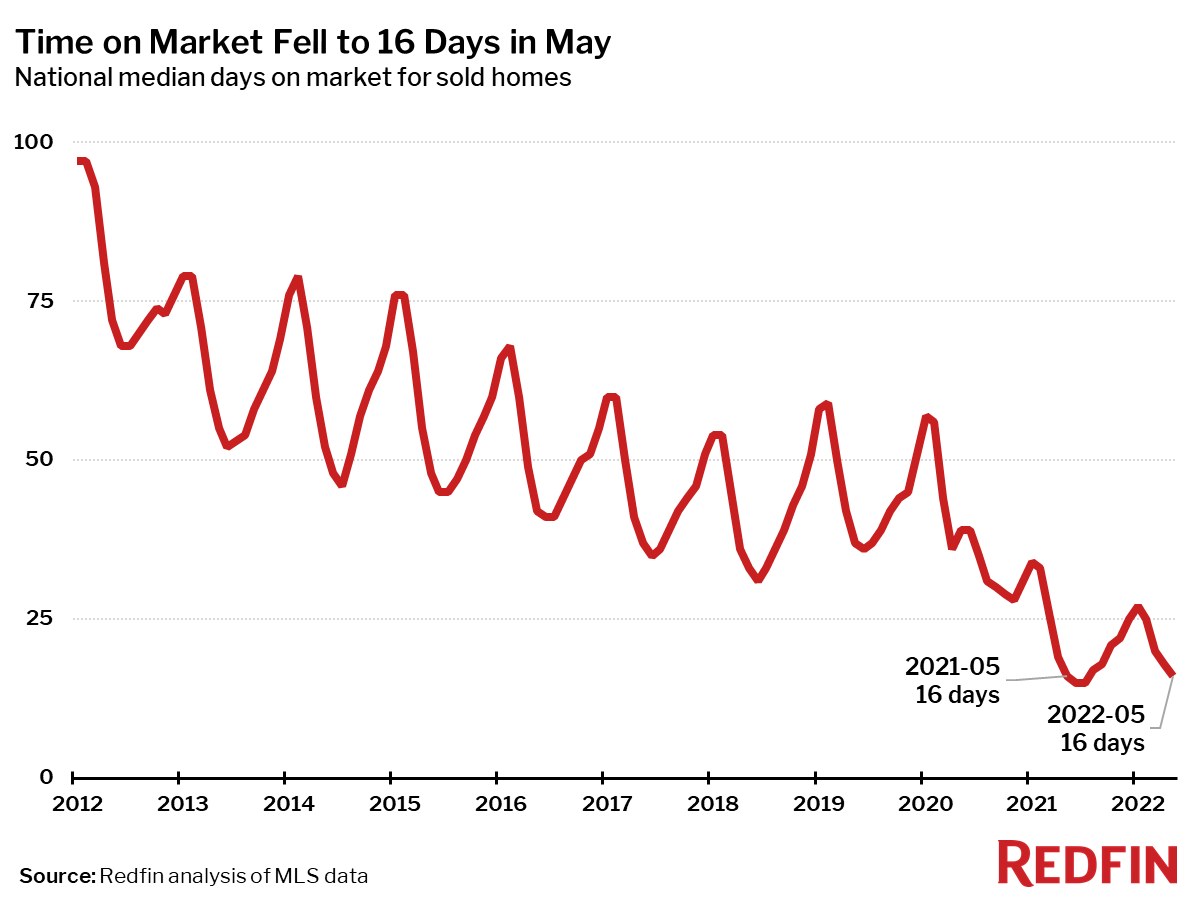
| Median days on market | 16 | -1 | 0 |
| Months of supply | 1.4 | 0 | 0.1 |
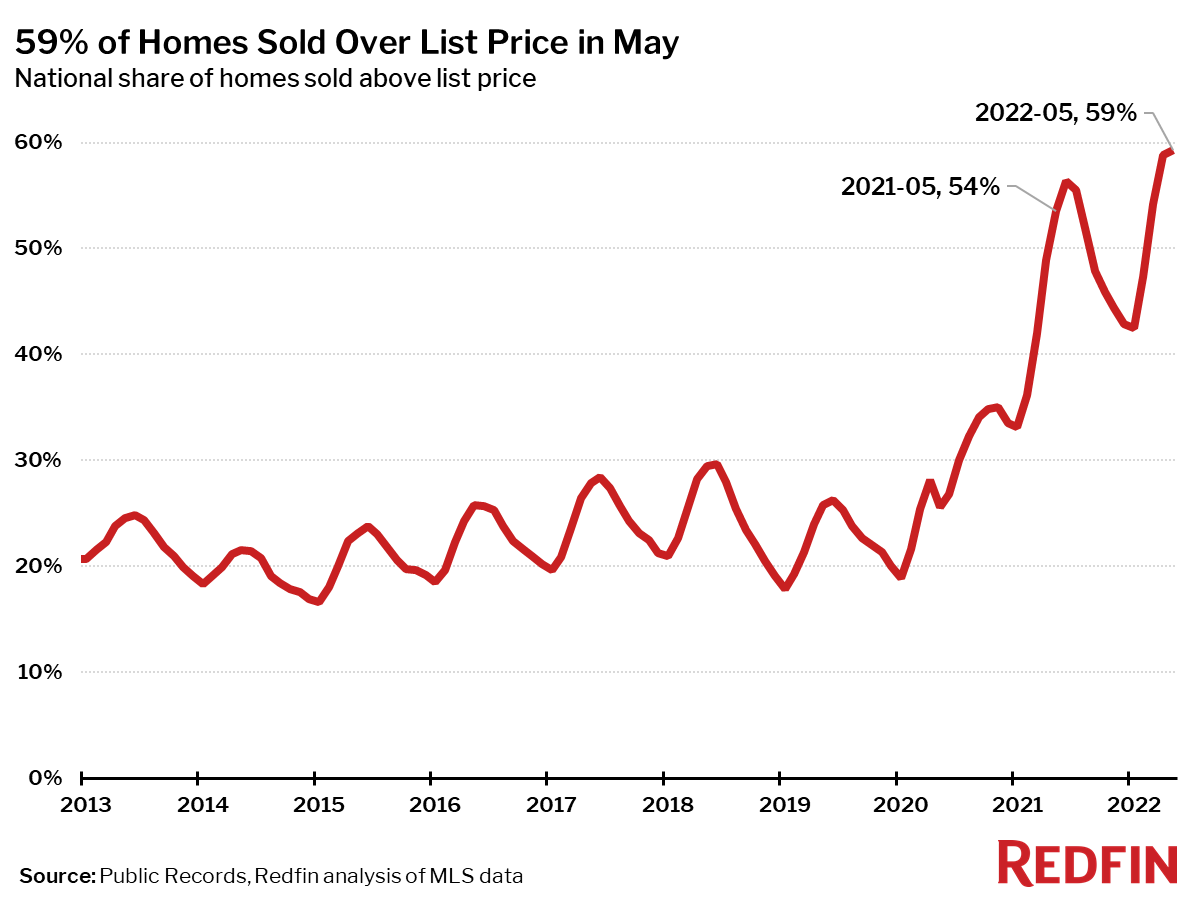
| Sold above list | 59.3% | 0.4 pts† | 5.8 pts† |
| Median Off-Market Redfin Estimate | $420,600 | 1.4% | 22.3% |
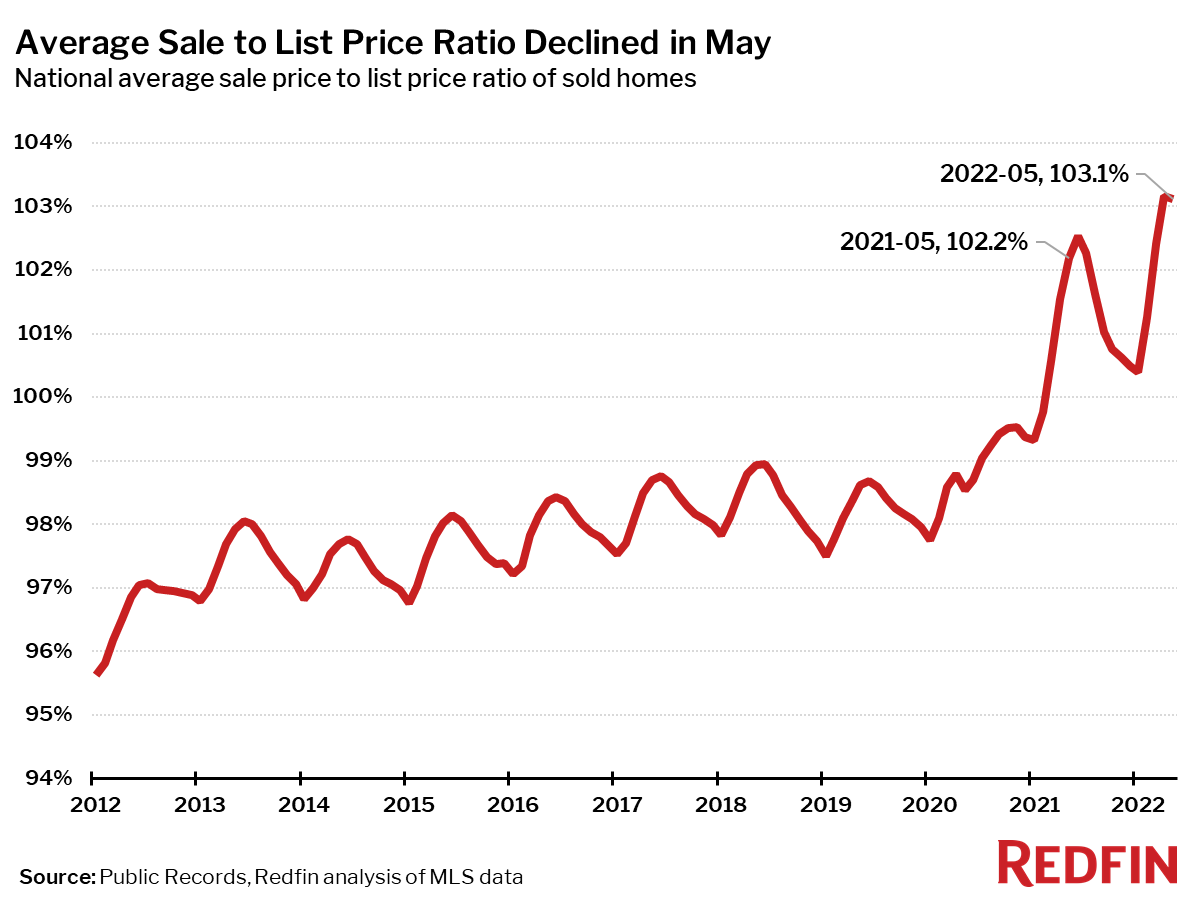
| Average Sale-to-list | 103.1% | 0.0 pts† | 0.9 pts† |
| Average 30-year fixed mortgage rate | 5.23% | +0.25 pts† | +2.27 pts† |
Metro-Level Highlights
Competition
- Indianapolis was the fastest market, with half of all homes pending sale in just 4 days, the same as a year earlier. Denver, Omaha, NE, Oklahoma City and Portland, OR were the next fastest markets, with 5 median days on market.
- In San Jose, CA, 84.5% of homes sold above list price, more than any other metro Redfin analyzed. Next came 83.6% in Oakland, CA, 79.3% in Worcester, MA, 76.3% in San Francisco, and 76.0% in Rochester, NY.
Prices
- North Port, FL had the nation’s highest price growth, rising 30.5% since last year to $475,000. Tampa, FL came next at 28.1%, followed by Las Vegas (26.8%), Knoxville, TN (25.9%), and Orlando, FL (25.8%).
- No metros saw price declines in May.
Sales
- Honolulu led the nation in year-over-year sales growth, up 5.0%, followed by Denver, up 4.0%. El Paso, TX rounded out the top three, with sales up 3.7%.
- West Palm Beach, FL saw the largest decline in sales since last year, falling 25.5%. Next came Lake County, IL (-22.9%) and Anaheim, CA (-22.4%).
Inventory
- Elgin, IL had the highest increase in the number of homes for sale, up 35% year over year, followed by Chicago (18.9%) and Austin, TX (15.6%).
- Allentown, PA had the largest decrease in overall active listings, falling 46.3% since last May. It was followed by Greensboro, NC (-35.2%), Bridgeport, CT (-31.6%) and Hartford, CT (-29.3%).
Redfin Estimate
- Miami (48.4%) had the largest share of homes predicted to sell for below list price, according to Redfin Estimate data, followed by Baton Rouge, LA (40.6%) and Tulsa, OK (40.0%).
- Sacramento, CA (90.8%) had the largest share of homes predicted to sell at or above list price, followed by Oakland (90.1%) and Worcester (89.6%).
Scroll down for national charts and market-by-market breakdowns. For downloadable data on all of the markets Redfin tracks, visit the Redfin Data Center. Refer to our metrics definition page for explanations of all the metrics used in this report.
Median Sale Price
| Redfin Metro | Median Sale Price | Month-Over-Month | Year-Over-Year |
|---|---|---|---|
| Albany, NY | $289,000 | 7.5% | 11.2% |
| Allentown, PA | $300,000 | 7.1% | 20.0% |
| Anaheim, CA | $1,060,000 | -1.4% | 17.8% |
| Atlanta, GA | $400,000 | 5.0% | 23.1% |
| Austin, TX | $556,000 | 0.2% | 19.8% |
| Bakersfield, CA | $361,000 | -1.1% | 16.5% |
| Baltimore, MD | $370,000 | 5.7% | 8.8% |
| Baton Rouge, LA | $255,000 | -2.3% | 8.5% |
| Birmingham, AL | $299,900 | 7.1% | 14.9% |
| Boston, MA | $690,000 | 2.2% | 11.3% |
| Bridgeport, CT | $570,000 | 8.6% | 7.0% |
| Buffalo, NY | $230,000 | 11.3% | 11.4% |
| Camden, NJ | $300,000 | 4.9% | 15.4% |
| Charleston, SC | $430,000 | 6.2% | 22.9% |
| Charlotte, NC | $401,000 | 2.3% | 21.1% |
| Chicago, IL | $329,900 | 0.7% | 4.7% |
| Cincinnati, OH | $265,000 | 6.0% | 10.9% |
| Cleveland, OH | $210,000 | 10.5% | 13.8% |
| Columbus, OH | $327,200 | 5.6% | 15.0% |
| Dallas, TX | $465,000 | 4.5% | 24.0% |
| Dayton, OH | $207,500 | 3.8% | 12.2% |
| Denver, CO | $612,000 | -0.5% | 14.4% |
| Detroit, MI | $187,200 | 7.0% | 6.4% |
| El Paso, TX | $238,000 | 1.3% | 22.0% |
| Elgin, IL | $310,000 | 1.6% | 12.7% |
| Fort Lauderdale, FL | $400,000 | 6.7% | 23.1% |
| Fort Worth, TX | $385,000 | 2.6% | 24.2% |
| Frederick, MD | $560,000 | 3.7% | 12.0% |
| Fresno, CA | $411,000 | 1.5% | 17.4% |
| Grand Rapids, MI | $312,500 | 1.6% | 16.8% |
| Greensboro, NC | $267,400 | 6.1% | 24.4% |
| Greenville, SC | $324,100 | 8.3% | 23.2% |
| Hartford, CT | $300,000 | 4.3% | 9.1% |
| Houston, TX | $350,000 | 2.9% | 16.7% |
| Indianapolis, IN | $285,000 | 5.6% | 13.2% |
| Jacksonville, FL | $365,900 | 2.5% | 25.1% |
| Kansas City, MO | $320,000 | 6.7% | 14.3% |
| Knoxville, TN | $340,000 | 1.5% | 25.9% |
| Lake County, IL | $324,400 | 1.4% | 8.2% |
| Las Vegas, NV | $450,000 | 1.6% | 26.8% |
| Los Angeles, CA | $900,000 | 0.0% | 10.9% |
| Louisville, KY | $255,000 | 2.0% | 10.9% |
| McAllen, TX | $220,000 | 0.9% | 22.9% |
| Memphis, TN | $288,000 | 3.6% | 14.7% |
| Miami, FL | $490,000 | 3.9% | 21.9% |
| Milwaukee, WI | $287,800 | 2.8% | 6.6% |
| Minneapolis, MN | $375,000 | 0.5% | 8.7% |
| Montgomery County, PA | $428,100 | 4.4% | 12.1% |
| Nashville, TN | $465,000 | 3.0% | 23.7% |
| Nassau County, NY | $622,900 | 4.0% | 10.2% |
| New Brunswick, NJ | $465,000 | 3.3% | 12.0% |
| New Haven, CT | $310,000 | 5.1% | 10.8% |
| New Orleans, LA | $305,000 | 5.2% | 11.1% |
| New York, NY | $690,000 | 1.5% | 7.0% |
| Newark, NJ | $517,000 | 7.7% | 13.6% |
| North Port, FL | $475,000 | 5.6% | 30.5% |
| Oakland, CA | $1,070,000 | -1.6% | 9.2% |
| Oklahoma City, OK | $260,000 | 5.6% | 15.6% |
| Omaha, NE | $293,000 | 2.8% | 14.2% |
| Orlando, FL | $396,400 | 1.7% | 25.8% |
| Oxnard, CA | $838,000 | -4.4% | 11.7% |
| Philadelphia, PA | $290,000 | 5.5% | 8.2% |
| Phoenix, AZ | $485,600 | 1.2% | 21.4% |
| Pittsburgh, PA | $230,000 | 7.5% | 7.0% |
| Portland, OR | $571,000 | 2.9% | 12.7% |
| Providence, RI | $420,000 | 2.4% | 16.3% |
| Raleigh, NC | $441,000 | 0.5% | 22.5% |
| Richmond, VA | $365,000 | 4.3% | 17.7% |
| Riverside, CA | $575,000 | 0.9% | 16.2% |
| Rochester, NY | $212,100 | 6.0% | 11.0% |
| Sacramento, CA | $610,000 | 0.8% | 10.9% |
| Salt Lake City, UT | $555,600 | 0.8% | 23.2% |
| San Antonio, TX | $350,000 | 6.1% | 25.0% |
| San Diego, CA | $875,000 | -0.2% | 15.1% |
| San Francisco, CA | $1,620,000 | -1.8% | 5.3% |
| San Jose, CA | $1,560,000 | -2.5% | 14.0% |
| Seattle, WA | $850,000 | 0.0% | 15.3% |
| St. Louis, MO | $248,200 | 7.5% | 8.9% |
| Tacoma, WA | $575,000 | 1.0% | 15.0% |
| Tampa, FL | $384,200 | 3.8% | 28.1% |
| Tucson, AZ | $360,000 | 2.0% | 19.8% |
| Tulsa, OK | $250,000 | 2.0% | 16.3% |
| Honolulu, HI | $705,000 | -0.7% | 6.5% |
| Virginia Beach, VA | $325,000 | 3.2% | 13.0% |
| Warren, MI | $294,000 | 5.0% | 8.9% |
| Washington, DC | $551,200 | 0.2% | 7.0% |
| West Palm Beach, FL | $458,000 | 2.0% | 25.1% |
| Worcester, MA | $405,000 | 5.7% | 12.5% |
| National | $430,600 | 1.5% | 14.8% |
Homes Sold
| Redfin Metro | Homes Sold | Month-Over-Month | Year-Over-Year |
|---|---|---|---|
| Albany, NY | 720 | 0.4% | -12.5% |
| Allentown, PA | 804 | 1.4% | -5.9% |
| Anaheim, CA | 2,561 | -1.5% | -22.4% |
| Atlanta, GA | 9,604 | 2.0% | -9.0% |
| Austin, TX | 3,413 | 7.8% | -9.3% |
| Bakersfield, CA | 815 | -6.3% | -10.6% |
| Baltimore, MD | 4,258 | 6.0% | -7.7% |
| Baton Rouge, LA | 1,189 | 8.2% | -7.3% |
| Birmingham, AL | 1,664 | 2.8% | -6.3% |
| Boston, MA | 4,436 | 24.0% | -9.0% |
| Bridgeport, CT | 1,072 | 4.9% | -15.5% |
| Buffalo, NY | 851 | 23.9% | -4.3% |
| Camden, NJ | 1,676 | 9.8% | -4.6% |
| Charleston, SC | 1,774 | 5.5% | -12.3% |
| Charlotte, NC | 4,415 | 4.3% | -2.5% |
| Chicago, IL | 10,055 | 6.4% | -7.5% |
| Cincinnati, OH | 2,970 | 13.0% | -2.7% |
| Cleveland, OH | 2,702 | 11.0% | -2.6% |
| Columbus, OH | 3,037 | 14.5% | 3.5% |
| Dallas, TX | 6,313 | 9.7% | -6.4% |
| Dayton, OH | 1,119 | 17.3% | -2.4% |
| Denver, CO | 5,735 | 12.5% | 4.0% |
| Detroit, MI | 1,872 | -0.7% | -2.9% |
| El Paso, TX | 879 | 5.8% | 3.7% |
| Elgin, IL | 1,111 | 19.8% | -6.2% |
| Fort Lauderdale, FL | 3,354 | -9.5% | -16.4% |
| Fort Worth, TX | 3,093 | 9.4% | -0.6% |
| Frederick, MD | 1,828 | 8.3% | -11.1% |
| Fresno, CA | 769 | -4.1% | -8.0% |
| Grand Rapids, MI | 1,258 | 13.6% | -8.1% |
| Greensboro, NC | 941 | -2.0% | -10.6% |
| Greenville, SC | 1,380 | 8.3% | 2.2% |
| Hartford, CT | 1,409 | 10.5% | -10.0% |
| Houston, TX | 9,982 | 6.8% | -2.4% |
| Indianapolis, IN | 3,428 | 13.8% | -0.5% |
| Jacksonville, FL | 3,027 | 3.4% | -13.1% |
| Kansas City, MO | 3,575 | 17.3% | -2.7% |
| Knoxville, TN | 1,286 | 6.6% | 0.8% |
| Lake County, IL | 1,204 | -5.9% | -22.9% |
| Las Vegas, NV | 3,828 | -2.5% | -8.9% |
| Los Angeles, CA | 5,985 | -5.8% | -14.8% |
| Louisville, KY | 1,695 | 2.0% | -10.0% |
| McAllen, TX | 437 | 8.4% | -2.0% |
| Memphis, TN | 1,549 | 7.2% | -2.5% |
| Miami, FL | 3,281 | -12.6% | -14.4% |
| Milwaukee, WI | 1,974 | 14.5% | -6.0% |
| Minneapolis, MN | 5,597 | 14.3% | -2.1% |
| Montgomery County, PA | 2,258 | 6.7% | -6.6% |
| Nashville, TN | 3,709 | 3.5% | -2.7% |
| Nassau County, NY | 2,371 | 10.5% | -3.1% |
| New Brunswick, NJ | 2,990 | 12.8% | -7.2% |
| New Haven, CT | 1,015 | 14.8% | -4.1% |
| New Orleans, LA | 1,550 | 2.6% | -7.7% |
| New York, NY | 6,499 | 10.5% | -2.3% |
| Newark, NJ | 2,021 | 5.4% | -11.0% |
| North Port, FL | 2,507 | 6.3% | -4.7% |
| Oakland, CA | 2,835 | 3.1% | -10.5% |
| Oklahoma City, OK | 2,294 | 5.2% | 0.2% |
| Omaha, NE | 1,242 | 8.1% | -9.9% |
| Orlando, FL | 4,411 | -0.2% | -9.8% |
| Oxnard, CA | 739 | -1.1% | -14.3% |
| Philadelphia, PA | 2,489 | 6.4% | -1.7% |
| Phoenix, AZ | 8,170 | -6.2% | -10.1% |
| Pittsburgh, PA | 2,423 | 7.7% | -5.5% |
| Portland, OR | 3,760 | 3.4% | -8.9% |
| Providence, RI | 1,685 | 11.6% | -7.9% |
| Raleigh, NC | 2,444 | 3.5% | -8.5% |
| Richmond, VA | 1,881 | 5.7% | -10.2% |
| Riverside, CA | 5,303 | -5.5% | -5.8% |
| Rochester, NY | 957 | 22.4% | -3.7% |
| Sacramento, CA | 2,672 | -5.5% | -11.7% |
| Salt Lake City, UT | 1,395 | 1.1% | -11.4% |
| San Antonio, TX | 2,978 | 1.6% | -16.4% |
| San Diego, CA | 3,021 | -3.2% | -14.3% |
| San Francisco, CA | 1,276 | 0.5% | -7.3% |
| San Jose, CA | 1,543 | -10.0% | -19.0% |
| Seattle, WA | 4,840 | 5.7% | -8.1% |
| St. Louis, MO | 3,771 | 7.4% | -6.8% |
| Tacoma, WA | 1,561 | 3.9% | 2.7% |
| Tampa, FL | 6,219 | 1.7% | -5.0% |
| Tucson, AZ | 1,751 | 3.2% | 1.9% |
| Tulsa, OK | 1,481 | 13.3% | -4.5% |
| Honolulu, HI | 1,015 | 0.1% | 5.0% |
| Virginia Beach, VA | 3,162 | 9.1% | 0.2% |
| Warren, MI | 3,491 | 4.4% | -6.3% |
| Washington, DC | 7,448 | 8.6% | -12.3% |
| West Palm Beach, FL | 3,044 | -2.7% | -25.5% |
| Worcester, MA | 969 | 19.0% | -6.1% |
| National | 556,200 | -3.0% | -10.2% |
New Listings
| Redfin Metro | New Listings | Month-Over-Month | Year-Over-Year |
|---|---|---|---|
| Albany, NY | 1,349 | 17.9% | 0.7% |
| Allentown, PA | 604 | -21.7% | -48.7% |
| Anaheim, CA | 2,938 | -7.3% | -15.8% |
| Atlanta, GA | 10,838 | 4.0% | -3.7% |
| Austin, TX | 5,018 | 12.2% | 19.2% |
| Bakersfield, CA | 1,074 | -1.0% | 12.1% |
| Baltimore, MD | 4,676 | -6.1% | -16.3% |
| Birmingham, AL | 1,472 | -20.8% | -18.7% |
| Boston, MA | 6,332 | 6.9% | 3.7% |
| Bridgeport, CT | 1,728 | 9.2% | -14.6% |
| Buffalo, NY | 1,490 | 25.0% | 5.1% |
| Camden, NJ | 2,008 | -4.6% | -18.5% |
| Charleston, SC | 1,997 | 5.9% | 3.7% |
| Charlotte, NC | 4,756 | 6.6% | -4.9% |
| Chicago, IL | 12,145 | 0.7% | -12.9% |
| Cincinnati, OH | 3,429 | 3.7% | -2.3% |
| Cleveland, OH | 3,331 | 1.6% | -11.6% |
| Columbus, OH | 3,478 | 3.0% | -4.2% |
| Dallas, TX | 8,825 | 13.3% | 14.3% |
| Dayton, OH | 1,434 | 3.2% | 10.0% |
| Denver, CO | 6,506 | -2.4% | 6.2% |
| Detroit, MI | 2,779 | 12.7% | 7.4% |
| El Paso, TX | 1,044 | 11.7% | 6.2% |
| Elgin, IL | 1,264 | -2.3% | -17.4% |
| Fort Lauderdale, FL | 3,902 | 5.6% | -6.2% |
| Fort Worth, TX | 4,070 | 10.7% | 15.7% |
| Frederick, MD | 1,958 | -6.3% | -16.6% |
| Fresno, CA | 1,020 | 13.1% | 1.5% |
| Grand Rapids, MI | 1,673 | 15.4% | 6.6% |
| Greensboro, NC | 833 | -4.1% | -30.3% |
| Greenville, SC | 1,464 | -1.0% | -1.7% |
| Hartford, CT | 1,907 | 6.6% | -16.0% |
| Houston, TX | 12,278 | 3.4% | 2.7% |
| Indianapolis, IN | 4,093 | 5.8% | 3.4% |
| Jacksonville, FL | 3,657 | 6.4% | -1.7% |
| Kansas City, MO | 3,832 | -7.6% | -12.4% |
| Knoxville, TN | 1,328 | -1.2% | -12.8% |
| Lake County, IL | 1,539 | 2.5% | -21.5% |
| Las Vegas, NV | 5,032 | 6.0% | 2.7% |
| Los Angeles, CA | 7,046 | -6.5% | -14.9% |
| Louisville, KY | 2,017 | 1.6% | -3.6% |
| McAllen, TX | 623 | 5.8% | 21.9% |
| Memphis, TN | 1,832 | 0.4% | -3.2% |
| Miami, FL | 4,187 | 6.5% | -5.8% |
| Milwaukee, WI | 2,395 | 6.5% | -11.1% |
| Minneapolis, MN | 7,415 | 9.5% | 1.0% |
| Montgomery County, PA | 2,806 | -3.0% | -18.0% |
| Nashville, TN | 4,590 | 19.0% | 23.5% |
| Nassau County, NY | 3,788 | 11.9% | -5.6% |
| New Brunswick, NJ | 4,265 | 6.1% | -6.0% |
| New Haven, CT | 1,341 | 3.5% | -12.0% |
| New Orleans, LA | 1,881 | -1.9% | 1.2% |
| New York, NY | 10,071 | 0.2% | -4.4% |
| Newark, NJ | 2,935 | 5.0% | -10.7% |
| North Port, FL | 2,842 | 0.2% | 13.4% |
| Oakland, CA | 3,325 | -3.0% | -2.4% |
| Oklahoma City, OK | 2,824 | 3.9% | 7.3% |
| Omaha, NE | 1,348 | -7.7% | -7.2% |
| Orlando, FL | 5,600 | 13.7% | 7.2% |
| Oxnard, CA | 845 | -6.7% | -12.2% |
| Philadelphia, PA | 3,011 | -9.0% | -10.1% |
| Phoenix, AZ | 10,608 | 6.8% | 11.9% |
| Pittsburgh, PA | 3,292 | 8.5% | -4.9% |
| Portland, OR | 4,489 | 4.6% | -3.6% |
| Providence, RI | 2,267 | 5.5% | -9.7% |
| Raleigh, NC | 2,935 | 4.7% | 12.1% |
| Richmond, VA | 2,196 | 3.9% | -12.2% |
| Riverside, CA | 6,776 | -1.0% | 0.3% |
| Rochester, NY | 1,445 | 14.2% | 4.0% |
| Sacramento, CA | 3,502 | -0.2% | 1.5% |
| San Antonio, TX | 4,067 | 2.8% | 1.6% |
| San Diego, CA | 3,524 | -6.1% | -17.2% |
| San Francisco, CA | 1,292 | -14.6% | -13.9% |
| San Jose, CA | 1,929 | -1.3% | -7.5% |
| Seattle, WA | 6,045 | 5.6% | 2.5% |
| St. Louis, MO | 4,266 | 3.7% | -4.6% |
| Tacoma, WA | 1,978 | 11.2% | 7.0% |
| Tampa, FL | 7,478 | 4.7% | 4.2% |
| Tucson, AZ | 1,731 | -7.7% | -0.9% |
| Tulsa, OK | 1,516 | -10.2% | -12.8% |
| Honolulu, HI | 896 | -8.4% | -18.2% |
| Virginia Beach, VA | 3,412 | -6.1% | -10.5% |
| Warren, MI | 4,962 | 15.4% | 5.7% |
| Washington, DC | 8,144 | -9.2% | -18.1% |
| West Palm Beach, FL | 3,955 | 4.1% | 0.6% |
| Worcester, MA | 1,455 | 6.5% | 6.9% |
| National | 614,200 | 0.8% | -4.5% |
All Homes for Sale
| Redfin Metro | All Homes for Sale | Month-Over-Month | Year-Over-Year |
|---|---|---|---|
| Albany, NY | 2,556 | 13.9% | -13.6% |
| Allentown, PA | 1,283 | -15.3% | -46.3% |
| Anaheim, CA | 6,260 | 3.4% | -21.3% |
| Atlanta, GA | 21,306 | 5.4% | -7.5% |
| Austin, TX | 9,707 | 19.4% | 15.6% |
| Bakersfield, CA | 2,215 | 7.7% | 9.0% |
| Baltimore, MD | 9,036 | 0.2% | -14.6% |
| Birmingham, AL | 4,027 | -4.8% | -16.8% |
| Boston, MA | 11,758 | 10.2% | -6.5% |
| Bridgeport, CT | 4,086 | 11.1% | -31.6% |
| Buffalo, NY | 2,362 | 18.6% | -2.2% |
| Camden, NJ | 4,137 | 3.4% | -16.6% |
| Charleston, SC | 4,790 | 6.9% | -15.7% |
| Charlotte, NC | 9,622 | 9.8% | -19.2% |
| Chicago, IL | 35,932 | 3.5% | 18.9% |
| Cincinnati, OH | 7,912 | 7.4% | -9.0% |
| Cleveland, OH | 6,709 | 4.8% | -14.0% |
| Columbus, OH | 7,455 | 9.4% | -4.3% |
| Dallas, TX | 15,494 | 16.3% | 2.5% |
| Dayton, OH | 2,772 | 11.8% | 6.7% |
| Denver, CO | 10,019 | 10.2% | 10.6% |
| Detroit, MI | 5,845 | 10.2% | 13.5% |
| El Paso, TX | 2,234 | 4.1% | -16.4% |
| Elgin, IL | 3,399 | 7.7% | 35.0% |
| Fort Lauderdale, FL | 10,325 | 0.6% | -24.7% |
| Fort Worth, TX | 7,328 | 12.4% | 6.7% |
| Frederick, MD | 3,530 | 3.8% | -18.7% |
| Fresno, CA | 1,807 | 12.5% | 7.9% |
| Grand Rapids, MI | 2,533 | 19.8% | 2.3% |
| Greensboro, NC | 1,770 | -7.1% | -35.2% |
| Greenville, SC | 3,499 | 3.9% | -12.7% |
| Hartford, CT | 3,895 | 8.0% | -29.3% |
| Houston, TX | 25,654 | 6.0% | 1.4% |
| Indianapolis, IN | 6,465 | 9.9% | -2.6% |
| Jacksonville, FL | 7,177 | 8.4% | -11.4% |
| Kansas City, MO | 7,346 | -1.2% | -13.2% |
| Knoxville, TN | 3,439 | 3.0% | -15.1% |
| Lake County, IL | 4,110 | 4.2% | 8.4% |
| Las Vegas, NV | 10,094 | 10.0% | 2.4% |
| Los Angeles, CA | 17,307 | 0.1% | -18.4% |
| Louisville, KY | 3,780 | 6.2% | -10.5% |
| McAllen, TX | 1,796 | 3.5% | 0.6% |
| Memphis, TN | 3,831 | 6.1% | -14.6% |
| Miami, FL | 12,674 | -0.3% | -25.1% |
| Milwaukee, WI | 5,757 | 7.6% | -13.0% |
| Minneapolis, MN | 13,348 | 12.3% | 2.6% |
| Montgomery County, PA | 5,120 | 5.8% | -20.5% |
| Nashville, TN | 8,778 | 16.1% | 7.4% |
| Nassau County, NY | 8,620 | 8.9% | -17.5% |
| New Brunswick, NJ | 10,613 | 9.4% | 5.2% |
| New Haven, CT | 3,064 | 5.0% | -24.0% |
| New Orleans, LA | 4,239 | 3.4% | -3.5% |
| New York, NY | 34,801 | 5.1% | -13.0% |
| Newark, NJ | 7,160 | 11.1% | -13.6% |
| North Port, FL | 4,943 | 8.6% | 14.5% |
| Oakland, CA | 5,687 | 6.0% | 4.5% |
| Oklahoma City, OK | 4,849 | 8.9% | 9.4% |
| Omaha, NE | 2,188 | -0.5% | -11.1% |
| Orlando, FL | 9,380 | 10.8% | -3.1% |
| Oxnard, CA | 1,913 | 3.2% | -12.8% |
| Philadelphia, PA | 8,197 | 1.2% | -4.0% |
| Phoenix, AZ | 20,871 | 10.4% | 8.7% |
| Pittsburgh, PA | 9,237 | 9.1% | -7.7% |
| Portland, OR | 7,374 | 11.4% | -3.1% |
| Providence, RI | 4,410 | 10.3% | -12.5% |
| Raleigh, NC | 5,672 | 10.5% | -12.8% |
| Richmond, VA | 3,590 | 6.7% | -18.2% |
| Riverside, CA | 15,041 | 6.5% | 1.3% |
| Rochester, NY | 2,286 | 13.0% | -2.3% |
| Sacramento, CA | 6,316 | 13.8% | 10.7% |
| San Antonio, TX | 8,201 | 7.0% | 1.3% |
| San Diego, CA | 6,292 | 6.6% | -12.4% |
| San Francisco, CA | 2,958 | -2.5% | -12.0% |
| San Jose, CA | 3,342 | 11.4% | -9.3% |
| Seattle, WA | 9,057 | 16.2% | 2.0% |
| St. Louis, MO | 8,452 | 7.1% | -13.2% |
| Tacoma, WA | 2,988 | 17.3% | 11.1% |
| Tampa, FL | 12,494 | 10.6% | 1.6% |
| Tucson, AZ | 4,224 | -1.2% | -3.4% |
| Tulsa, OK | 2,758 | 0.2% | -8.2% |
| Honolulu, HI | 3,082 | -4.8% | -13.2% |
| Virginia Beach, VA | 6,376 | 3.4% | -15.3% |
| Warren, MI | 8,652 | 16.0% | 2.9% |
| Washington, DC | 16,431 | 2.5% | -14.5% |
| West Palm Beach, FL | 9,899 | 4.6% | -12.8% |
| Worcester, MA | 2,667 | 15.3% | -1.3% |
| National | 1,372,800 | -0.7% | -4.3% |
Median Off-Market Redfin Estimate
| Redfin Metro | Estimate | Month-Over-Month | Year-Over-Year |
|---|---|---|---|
| Albany, NY | $237,900 | 1.2% | 8.3% |
| Allentown, PA | $283,500 | 1.4% | 18.9% |
| Anaheim, CA | $1,061,600 | 2.3% | 27.9% |
| Atlanta, GA | $348,100 | 1.9% | 30.9% |
| Austin, TX | $521,900 | 3.8% | 41.4% |
| Bakersfield, CA | $277,500 | 1.4% | 27.9% |
| Baltimore, MD | $345,600 | 1.1% | 14.4% |
| Baton Rouge, LA | $152,600 | 0.8% | 6.5% |
| Birmingham, AL | $177,900 | 1.8% | 17.9% |
| Boston, MA | $645,900 | 1.3% | 11.6% |
| Bridgeport, CT | $485,500 | 1.4% | 14.4% |
| Buffalo, NY | $205,300 | 2.1% | 20.2% |
| Camden, NJ | $290,800 | 1.4% | 22.4% |
| Charleston, SC | $336,100 | 2.3% | 26.2% |
| Charlotte, NC | $321,700 | 1.9% | 29.4% |
| Chicago, IL | $295,000 | 1.2% | 5.5% |
| Cincinnati, OH | $223,200 | 1.6% | 19.8% |
| Cleveland, OH | $187,800 | 1.9% | 18.3% |
| Columbus, OH | $263,700 | 1.5% | 19.0% |
| Dallas, TX | $388,200 | 3.0% | 33.7% |
| Dayton, OH | $165,900 | 1.0% | 16.8% |
| Denver, CO | $586,700 | 2.2% | 26.3% |
| Detroit, MI | $134,300 | 1.7% | 14.9% |
| Elgin, IL | $277,300 | 1.4% | 10.8% |
| Fort Lauderdale, FL | $378,100 | 2.4% | 24.8% |
| Fort Worth, TX | $324,400 | 2.5% | 31.2% |
| Frederick, MD | $523,400 | 1.2% | 14.7% |
| Fresno, CA | $374,800 | 1.7% | 24.7% |
| Grand Rapids, MI | $247,800 | 2.2% | 22.1% |
| Greensboro, NC | $193,900 | 2.1% | 21.9% |
| Greenville, SC | $226,200 | 2.0% | 25.0% |
| Hartford, CT | $283,500 | 1.4% | 17.3% |
| Houston, TX | $276,200 | 1.8% | 24.5% |
| Indianapolis, IN | $230,400 | 1.8% | 23.8% |
| Jacksonville, FL | $320,900 | 2.7% | 32.7% |
| Kansas City, MO | $251,500 | 1.5% | 22.3% |
| Knoxville, TN | $264,000 | 2.1% | 28.1% |
| Lake County, IL | $260,800 | 1.0% | 10.0% |
| Las Vegas, NV | $418,500 | 2.7% | 31.5% |
| Los Angeles, CA | $857,700 | 1.1% | 18.1% |
| Louisville, KY | $209,300 | 1.1% | 6.9% |
| Memphis, TN | $206,200 | 3.0% | 20.4% |
| Miami, FL | $433,400 | 2.2% | 24.7% |
| Milwaukee, WI | $264,700 | 1.3% | 15.9% |
| Minneapolis, MN | $347,200 | 1.1% | 15.6% |
| Montgomery County, PA | $420,900 | 0.9% | 16.8% |
| Nashville, TN | $412,100 | 2.5% | 33.6% |
| Nassau County, NY | $612,600 | 0.8% | 13.0% |
| New Brunswick, NJ | $466,400 | 1.3% | 19.5% |
| New Haven, CT | $293,400 | 1.6% | 18.9% |
| New Orleans, LA | $208,300 | 1.3% | 10.2% |
| Newark, NJ | $463,000 | 1.1% | 11.5% |
| North Port, FL | $391,900 | 3.5% | 45.4% |
| Oakland, CA | $1,102,000 | 2.5% | 22.9% |
| Oklahoma City, OK | $192,400 | 1.9% | 19.0% |
| Omaha, NE | $249,400 | 1.6% | 16.9% |
| Orlando, FL | $346,700 | 2.5% | 32.6% |
| Oxnard, CA | $826,900 | 1.7% | 22.7% |
| Philadelphia, PA | $238,300 | 1.1% | 9.7% |
| Phoenix, AZ | $460,000 | 2.7% | 40.4% |
| Pittsburgh, PA | $163,500 | 1.2% | 10.6% |
| Portland, OR | $544,800 | 1.6% | 21.6% |
| Providence, RI | $395,800 | 1.4% | 17.4% |
| Raleigh, NC | $392,000 | 2.7% | 35.7% |
| Richmond, VA | $303,100 | 1.6% | 16.4% |
| Riverside, CA | $509,100 | 1.5% | 29.9% |
| Rochester, NY | $193,100 | 2.0% | 19.7% |
| Sacramento, CA | $593,800 | 2.0% | 24.1% |
| Salt Lake City, UT | $560,100 | 2.5% | 35.5% |
| San Antonio, TX | $257,600 | 2.1% | 25.3% |
| San Diego, CA | $896,700 | 2.2% | 26.9% |
| San Francisco, CA | $1,638,300 | 1.9% | 15.4% |
| San Jose, CA | $1,660,300 | 2.3% | 26.2% |
| Seattle, WA | $829,700 | 2.3% | 26.3% |
| St. Louis, MO | $191,100 | 1.2% | 14.6% |
| Tacoma, WA | $535,300 | 1.9% | 22.5% |
| Tampa, FL | $339,600 | 3.1% | 34.3% |
| Tucson, AZ | $304,100 | 2.7% | 26.1% |
| Tulsa, OK | $167,900 | 1.6% | 15.1% |
| Honolulu, HI | $893,200 | 1.3% | 17.4% |
| Virginia Beach, VA | $298,200 | 1.5% | 16.6% |
| Warren, MI | $269,000 | 1.6% | 14.2% |
| Washington, DC | $504,000 | 1.1% | 13.7% |
| West Palm Beach, FL | $416,700 | 3.1% | 35.2% |
| Worcester, MA | $371,100 | 1.3% | 16.5% |
| National | $420,600 | 1.4% | 22.3% |


