Pandemic boomtowns and pricey coastal markets are seeing historic home-price declines. Nationwide, the median home sale price dropped nearly $18,000 from a year earlier in April as elevated mortgage rates dampened homebuyer demand.
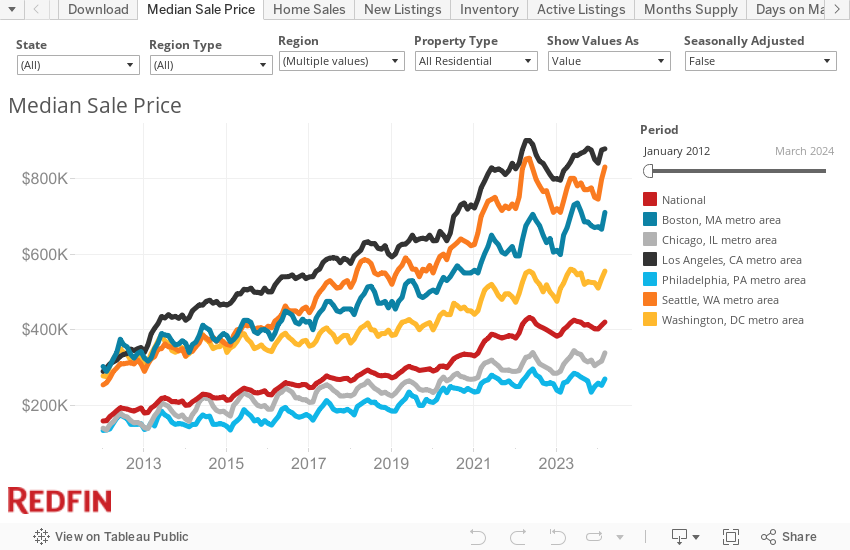
The median U.S. home sale price fell 4.1% ($17,603) year over year in April to $408,031. That’s the biggest drop on record in dollar terms and the largest decline since January 2012 in percentage terms. April marked the third consecutive month of year-over-year declines following roughly a decade of increases.
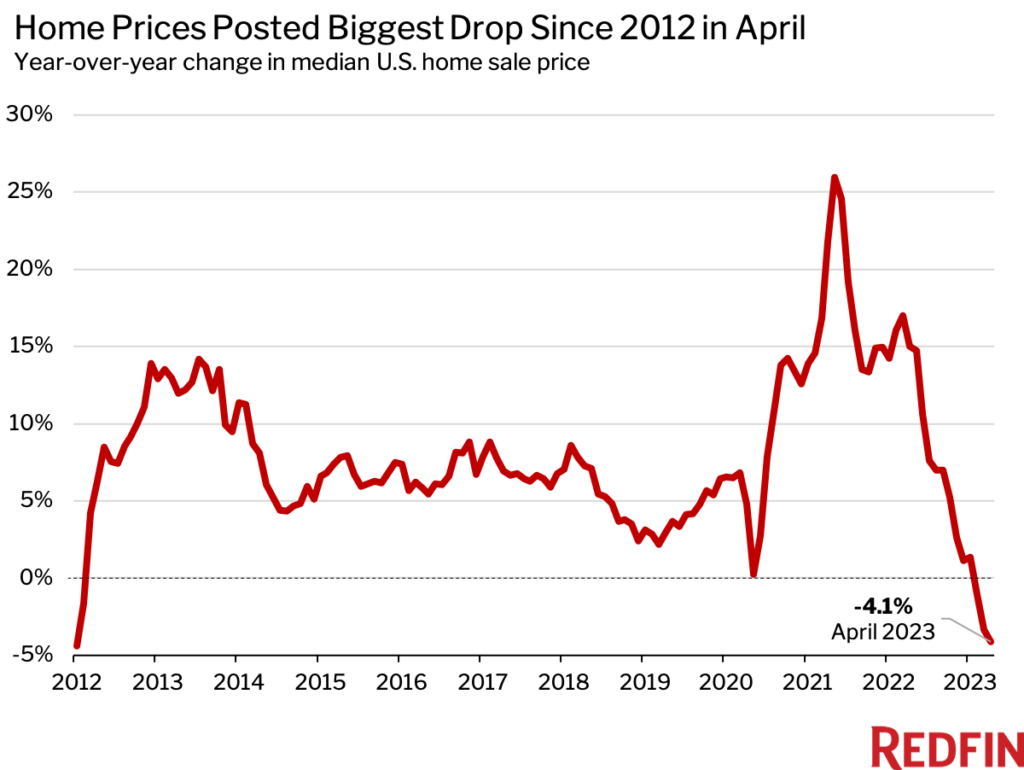
Home prices fell from a year earlier because elevated mortgage rates hampered homebuyer demand, but also because prices were near their all-time high at the same time last year. The median sale price in April 2022 was $425,634—just shy of the $432,109 record set the following month.
The steepest declines were in expensive California markets and pandemic boomtowns, where prices soared to unsustainable levels during the pandemic and are now coming back down to earth. The Oakland, CA metropolitan area saw the biggest dip (-16.1% or $174,500 YoY), followed by Austin, TX (-15.3% or $85,000), Boise, ID (-15.1% or $80,000), San Francisco (-13.4% or $220,000) and Salt Lake City (-10.9% or $60,000). In percentage terms, all five metros posted record declines in April, with the exception of Boise, which posted the second biggest drop on record (the biggest was in March). Redfin’s records date back to 2012.
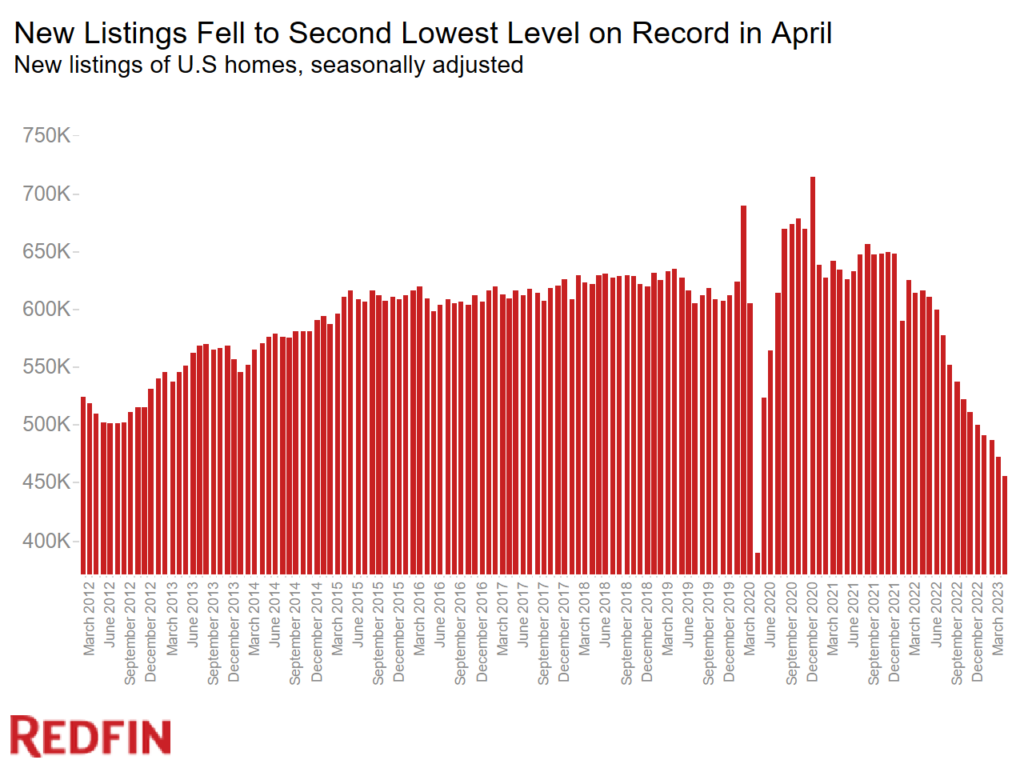
High mortgage rates are keeping both buyers and sellers on the sidelines. New listings dropped 26.1% year over year on a seasonally adjusted basis in April as homeowners stayed put in order to hold onto their relatively low rates. That’s the largest decline on record aside from April 2020, when the onset of the pandemic brought the housing market to a halt. New listings were also at the lowest level on record aside from April 2020.
“Elevated mortgage rates are preventing would-be buyers from buying and would-be sellers from selling. And because sellers aren’t selling, the buyers who are out there have very limited options,” said Redfin Chief Economist Daryl Fairweather. “Home prices are faltering due to sluggish homebuyer demand, but the shortage of homes for sale is preventing them from falling as much as they did in the Great Recession. In some places, there are so few listings that prices are actually rising as a limited pool of buyers competes for an even more limited pool of homes.”
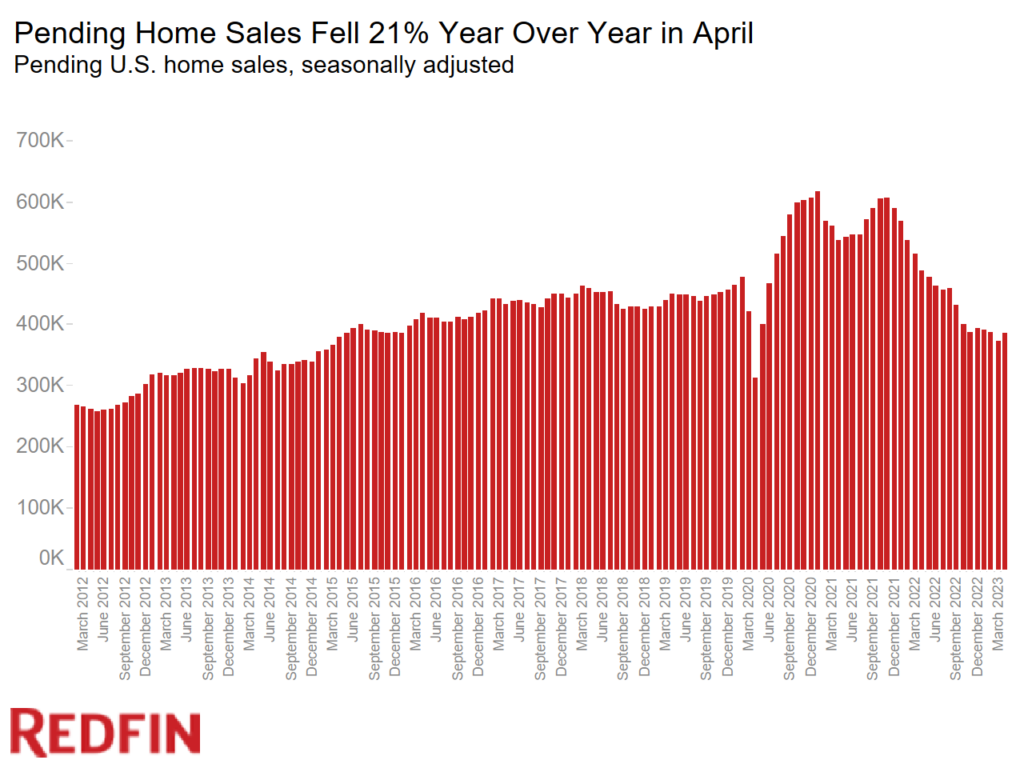
Pending home sales fell 21% year over year on a seasonally adjusted basis in April, an improvement from the record 36.1% decline in the fall. Pending sales rose 3.1% from March, the first month-over-month increase since December and the largest increase since September 2021.
April Highlights
| April 2023 | Month-Over-Month Change | Year-Over-Year Change | |
| Median sale price | $408,031 | 1.9% | -4.1% |
| Pending home sales, seasonally adjusted | 385,848 | 3.1% | -21% |
| Homes sold, seasonally adjusted | 420,294 | -1.9% | -22.1% |
| New listings, seasonally adjusted | 455,765 | -3.5% | -26.1% |
| All homes for sale, seasonally adjusted (active listings) | 1,480,489 | -3.7% | 1.1% |
| Months of supply | 2.1 | 0.1 | 0.7 |
| Median days on market | 36 | -8 | 18 |
| Share of for-sale homes with a price drop | 13.1% | -0.9 ppts | 5.4 ppts |
| Share of homes sold above final list price | 33.6% | 5.1 ppts | -25.1 ppts |
| Average sale-to-final-list-price ratio | 99.5% | 0.6 ppts | -3.6 ppts |
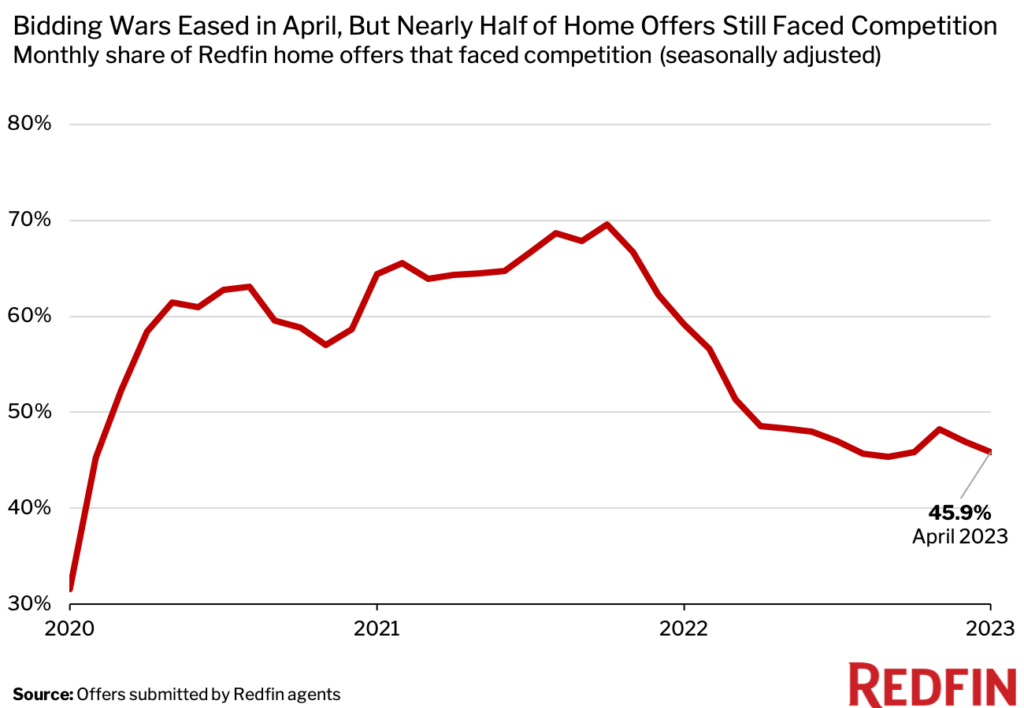
| Share of home offers written by Redfin agents that faced competition, seasonally adjusted | 45.9% | -1.1 ppts | -13.3 ppts |
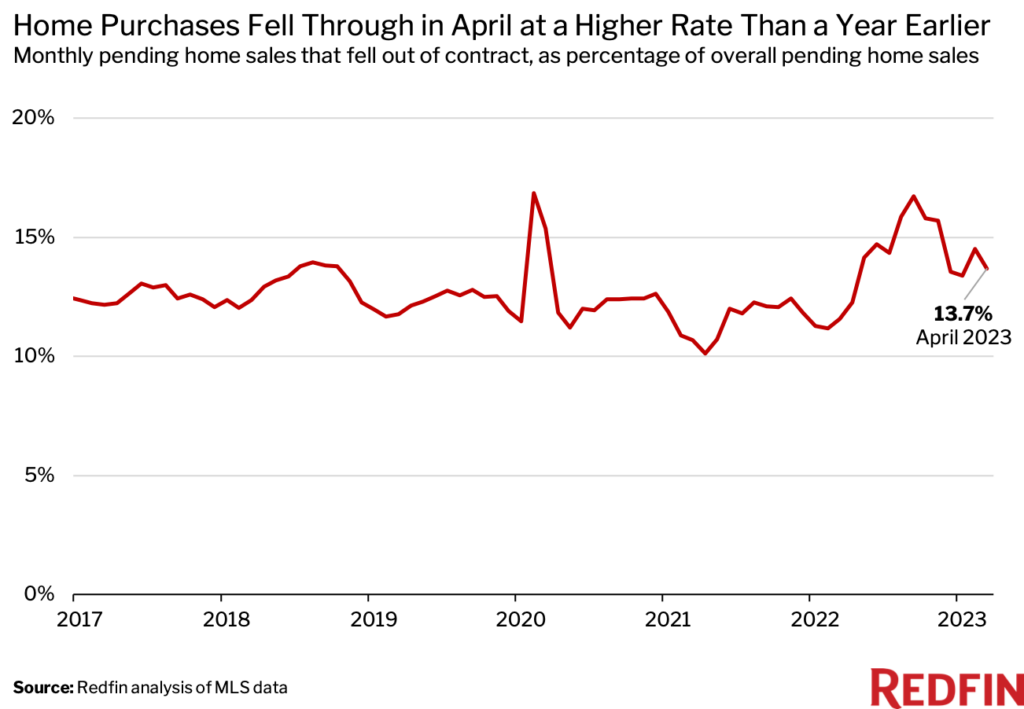
| Pending sales that fell out of contract, as % of overall pending sales | 13.7% | -0.8 ppts | 2.1 ppts |
| Average 30-year fixed mortgage rate | 6.34% | -0.2 ppts | 1.36 ppts |
Note: Data is subject to revision
A Lack of Homes for Sale Is Forcing Buyers to Move Fast and Compete
Despite a slow housing market and declining prices, many homes are still selling quickly and attracting multiple offers because buyers have so few options. Almost half (47.8%) of homes that went under contract in April did so within two weeks. That’s down from 58.4% a year earlier, but is higher than any April on record prior to the pandemic.
Some buyers are finding they have to offer more than the asking price in order to win a home. One-third (33.6%) of homes that sold in April were purchased for more than the final list price. That’s down from 58.7% a year earlier but is higher than any April on record prior to the pandemic. Nearly half (45.9%) of home offers written by Redfin agents faced competition. While that’s down from 59.2% a year earlier, the share has held steady at around 45% for the past six months even as the housing market has slowed.
“My listings are all getting multiple offers and typically sell in a week because there are so few homes for sale,” said Costanza Genoese-Zerbi, a Redfin Premier real estate agent in Los Angeles. “I recently sold a condo with no laundry, no parking and no air conditioning. It got six offers and went for $40,000 over the $380,000 list price.”
The Texas Housing Market Is Holding Up Relatively Well
Pending home sales fell in every major U.S. metro area Redfin analyzed in April, but five of the 10 metros with the smallest declines are in Texas. In Fort Worth, TX, pending sales fell just 0.8%, the smallest decrease in the country. Next came Dallas (-1.9%), North Port, FL (-5.2%), Atlanta (-7.4%), Detroit (-8.7%), Indianapolis (-11%), McAllen, TX (-11.1%), Tampa, FL (-11.3%), San Antonio (-12.9%) and El Paso, TX (-13%).
The five aforementioned Texas metros also made the list of places with the smallest declines in new listings. Sales are holding up relatively well in Texas in part because the supply shortage is less severe. New listings were down in every major U.S. metro area Redfin analyzed in April, but Texas is home to six of the 10 metros with the smallest declines. In El Paso, new listings fell 0.2%, the smallest decline in the U.S. It was followed by McAllen (-1.5%), Nashville (-7.4%), North Port (-13.5%), Fort Worth (-16%), San Antonio (-17.4%), Austin (-17.4%), Memphis (-18.2%), Dallas (-18.8%) and Pittsburgh (-19%).
Listings in Texas are holding up relatively well partly because builders in the state have been active. Homebuilders aren’t as impacted by elevated mortgage rates when selling homes as individual homeowners because they’re not already locked into a low mortgage rate, though high interest rates do make it more expensive for them to borrow money. Still, Texas issued 263,000 residential building permits issued last year, more than any other state and well above second-ranked Florida, which had 212,000.
“In the Fort Worth area, all of the new construction means buyers aren’t hindered by a lack of new listings. They’re building all over and in various price ranges,” said local Redfin real estate agent Gena Campbell. “Still, home prices aren’t low enough for everyone. Many people—especially first-time homebuyers—can’t afford to buy a home due to the rise in mortgage rates and property values.”
Metro-Level Highlights: April 2023
Data in the bullets below came from a list of the 91 U.S. metro areas with populations of at least 750,000, with the exception of competition data. Select metros may be excluded from time to time to ensure data accuracy. A full metro-level data table can be found in the “Download” tab of the dashboard embedded above, or in the monthly section of the Redfin Data Center. Refer to our metrics definition page for explanations of metrics used in this report. Metro-level data is not seasonally adjusted.
- Pending sales: In Boise, pending sales fell 70.8% year over year, more than any other metro Redfin analyzed. It was followed by Baton Rouge, LA (-61.7%), Greensboro, NC (-56.2%). Allentown, PA (-54.7%) and Honolulu (-53.9%). The smallest declines were in Fort Worth (-0.8%), Dallas (-1.9%), North Port (-5.2%), Atlanta (-7.4%) and Detroit (-8.7%).
- Closed sales: Northern California saw the biggest declines in closed sales. In San Jose, CA, closed sales dropped 48.2% year over year. The next biggest declines were in San Francisco (-44%), Stockton (-43%), Oakland (-42.8%) and Sacramento, CA (-42.2%). Closed sales fell the least in North Port (-8.4%), Fort Worth (-10.6%), Dallas (-10.7%), Tampa (-12.8%) and Dayton, OH (-13.7%).
- Prices: Median sale prices fell from a year earlier in 45 of the metros Redfin analyzed. The biggest declines were in Oakland (-16.1%), Austin (-15.3%), Boise (-15.1%), San Francisco (-13.4%) and Salt Lake City (-10.9%). The biggest increases were in Fort Lauderdale, FL (10.7%), Allentown (8.9%), Milwaukee (8.9%), Cincinnati (8%) and St. Louis (7.8%).
- Listings: New listings fell most from a year earlier in Allentown (-57.9%), Boise (-50.2%), Greensboro (-50.1%), Tacoma, WA (-46.9%) and San Diego (-44.1%). They fell least in El Paso (-0.2%), McAllen (-1.5%), Nashville (-7.4%), North Port (-13.5%) and Fort Worth (-16%).
- Supply: Active listings fell most from a year earlier in Allentown (-43.2%), Cincinnati (-40.3%), Greensboro (-37.7%), Lake County, IL (-33.4%) and Oakland (-28.7%). They rose most in North Port (75.4%), Nashville (49.2%), Austin (48.7%), New Orleans (46.2%) and Cape Coral, FL (46.1%).
- Competition: In Colorado Springs, CO, 22.2% of home offers written by Redfin agents faced competition, down from 62.8% a year earlier. That 40.6-percentage-point decline is the largest among the metros Redfin analyzed. Next came Austin (-36.2 ppts), Nashville (-33.4 ppts), Tampa (-32.4 ppts) and Charlotte, NC (-31.4 ppts). Competition rose in three metros Redfin analyzed: San Francisco (9.2 ppts), Worcester, MA (8.4 ppts) and Providence, RI (4 ppts).
Below are market-by-market breakdowns on competition and home-purchase cancellations, which aren’t in the Redfin Data Center.
Competition
Data below came from a list of the metros that had a monthly average of at least 50 offers submitted by Redfin agents from March 2021 to March 2022. An offer is considered part of a bidding war if a Redfin agent reported that it received at least one competing bid.
| Metro Area | April 2023: Share of Redfin Offers That Faced Competition | March 2023: Share of Redfin Offers That Faced Competition | April 2022: Share of Redfin Offers That Faced Competition |
| Atlanta, GA | 49.6% | 62.9% | 59.7% |
| Austin, TX | 36.3% | 43.5% | 72.4% |
| Baltimore, MD | 67.5% | 68.1% | 72.8% |
| Boston, MA | 73.6% | 72.3% | 77.2% |
| Charlotte, NC | 36.0% | 48.8% | 67.4% |
| Chicago, IL | 58.5% | 63.1% | 70.2% |
| Colorado Springs, CO | 22.2% | 31.6% | 62.8% |
| Dallas, TX | 50.2% | 51.9% | 72.4% |
| Denver, CO | 60.0% | 55.1% | 76.8% |
| Detroit, MI | 50.9% | 59.1% | 80.8% |
| Honolulu,HI | 43.3% | 44.4% | 65.8% |
| Houston, TX | 32.0% | 41.9% | 62.1% |
| Indianapolis, IN | 45.8% | 38.5% | 69.2% |
| Las Vegas, NV | 37.5% | 27.9% | 64.4% |
| Los Angeles, CA | 49.2% | 50.2% | 72.1% |
| Miami, FL | 38.0% | 47.9% | 56.8% |
| Minneapolis, MN | 60.0% | 62.8% | 70.7% |
| Nashville, TN | 39.5% | 25.0% | 72.9% |
| New York, NY | 49.4% | 55.2% | 64.1% |
| Olympia, WA | 70.0% | 36.6% | 70.3% |
| Orlando, FL | 44.3% | 39.7% | 69.3% |
| Philadelphia, PA | 65.5% | 63.0% | 70.1% |
| Phoenix, AZ | 37.5% | 30.2% | 61.6% |
| Portland, OR | 53.1% | 52.5% | 71.2% |
| Providence, RI | 78.4% | 70.8% | 74.4% |
| Raleigh, NC | 54.4% | 41.2% | 64.3% |
| Riverside, CA | 33.8% | 46.8% | 46.7% |
| Sacramento, CA | 64.9% | 53.3% | 73.8% |
| San Antonio, TX | 38.2% | 36.2% | 59.6% |
| San Diego, CA | 70.4% | 73.9% | 73.0% |
| San Francisco, CA | 71.6% | 65.8% | 62.4% |
| San Jose, CA | 67.6% | 68.8% | 69.5% |
| Seattle, WA | 60.0% | 59.9% | 72.5% |
| Tampa, FL | 42.2% | 47.9% | 74.6% |
| Washington, D.C. | 67.3% | 70.9% | 69.5% |
| Worcester, MA
|
83.7% | 86.0% | 75.3% |
| National—U.S.A. (seasonally adjusted) | 45.9% | 46.9% | 59.2% |
Home-Purchase Cancellations
Data below came from a list of the 50 most populous metro areas.
| Metro Area | April 2023: Pending Sales That Fell Out of Contract, as % of Overall Pending Sales | March 2023: Pending Sales That Fell Out of Contract, as % of Overall Pending Sales | April 2022: Pending Sales That Fell Out of Contract, as % of Overall Pending Sales |
| Anaheim, CA | 12.5% | 13.7% | 12.8% |
| Atlanta, GA | 18.9% | 21.4% | 11.0% |
| Austin, TX | 11.4% | 13.6% | 10.9% |
| Baltimore, MD | 10.5% | 11.9% | 9.9% |
| Boston, MA | 7.7% | 9.0% | 6.8% |
| Charlotte, NC | 10.5% | 10.4% | 8.8% |
| Chicago, IL | 13.7% | 14.4% | 13.8% |
| Cincinnati, OH | 10.0% | 11.7% | 10.3% |
| Cleveland, OH | 15.3% | 16.3% | 13.8% |
| Columbus, OH | 11.3% | 13.6% | 9.4% |
| Dallas, TX | 15.9% | 17.8% | 14.7% |
| Denver, CO | 13.4% | 15.4% | 5.7% |
| Detroit, MI | 14.5% | 17.6% | 14.3% |
| Fort Lauderdale, FL | 19.6% | 18.9% | 19.7% |
| Fort Worth, TX | 16.7% | 19.0% | 16.6% |
| Houston, TX | 18.1% | 17.5% | 18.5% |
| Indianapolis, IN | 14.7% | 14.6% | 11.8% |
| Jacksonville, FL | 19.7% | 19.3% | 19.6% |
| Kansas City, MO | 10.9% | 12.4% | 9.6% |
| Las Vegas, NV | 18.5% | 19.9% | 19.7% |
| Los Angeles, CA | 14.3% | 15.3% | 12.8% |
| Miami, FL | 17.2% | 16.9% | 18.3% |
| Milwaukee, WI | 6.5% | 8.0% | 8.0% |
| Minneapolis, MN | 8.0% | 8.6% | 6.3% |
| Montgomery County, PA | 5.6% | 6.2% | 6.1% |
| Nashville, TN | 13.2% | 15.1% | 10.7% |
| Nassau County, NY | 3.8% | 4.5% | 3.9% |
| New Brunswick, NJ | 12.1% | 11.1% | 8.3% |
| New York, NY | 8.2% | 8.0% | 5.0% |
| Newark, NJ | 10.1% | 9.8% | 2.4% |
| Oakland, CA | 8.5% | 8.4% | 5.5% |
| Orlando, FL | 19.7% | 21.2% | 20.7% |
| Philadelphia, PA | 11.7% | 11.6% | 10.3% |
| Phoenix, AZ | 15.6% | 18.8% | 17.1% |
| Pittsburgh, PA | 12.7% | 13.2% | 11.9% |
| Portland, OR | 11.9% | 12.9% | 10.3% |
| Providence, RI | 9.7% | 10.9% | 9.5% |
| Riverside, CA | 16.8% | 18.0% | 17.1% |
| Sacramento, CA | 14.9% | 15.6% | 14.0% |
| San Antonio, TX | 19.2% | 20.5% | 19.0% |
| San Diego, CA | 13.2% | 14.5% | 13.8% |
| San Francisco, CA | 4.1% | 5.2% | 3.4% |
| San Jose, CA | 6.7% | 5.8% | 4.2% |
| Seattle, WA | 8.7% | 9.4% | 5.1% |
| St. Louis, MO | 11.3% | 13.3% | 11.5% |
| Tampa, FL | 19.1% | 19.2% | 19.7% |
| Virginia Beach, VA | 13.4% | 13.9% | 11.7% |
| Warren, MI | 11.3% | 11.8% | 10.5% |
| Washington, D.C. | 9.3% | 10.5% | 8.1% |
| West Palm Beach, FL | 17.8% | 16.6% | 18.9% |
| National—U.S.A. | 13.7% | 14.5% | 11.6% |