Homebuyers are getting some relief as sellers slash their prices at a record rate and mortgage rates drop following months of increases.
After months of tipping heavily in sellers’ favor, the scales of the housing market are finally balancing out. Soaring housing costs caused many house hunters to drop out in recent months, which is now providing some relief for buyers who remain. Today’s buyers are seeing the housing shortage ease, price growth slow, competition decline and mortgage rates drop from their 2022 high. The share of sellers slashing their asking prices hit a record high during the four weeks ending July 3, and the portion of homes going for above list price fell for the first time since June 2020 as sellers responded to waning homebuyer demand.
“Conditions for homebuyers are improving. Housing remains expensive, but mortgage rates just posted their biggest weekly drop since 2008, which makes buying a home a bit more affordable,” said Redfin chief economist Daryl Fairweather. “One way buyers can take advantage of the shift in the market is seeking concessions from sellers. That could include asking the seller to buy down your mortgage rate, pay for repairs or cover some of your closing costs.”
“The market slowdown is giving buyers more opportunities to negotiate, especially with sellers whose homes have been on the market for a while,” said Columbia, SC Redfin real estate agent Jessica Nelson. “I tell my sellers that they need to price their homes realistically from the get-go. If they don’t, their home may end up sitting on the market and they may have to drop their price—possibly more than once—to attract buyers.”
Leading indicators of homebuying activity:
- For the week ending July 7, 30-year mortgage rates fell to 5.3%—the largest 1-week drop since 2008. This was down from a 2022 high of 5.81% but up from 3.11% at the start of the year.
- Fewer people searched for “homes for sale” on Google—searches during the week ending July 2 were down 2% from a year earlier.
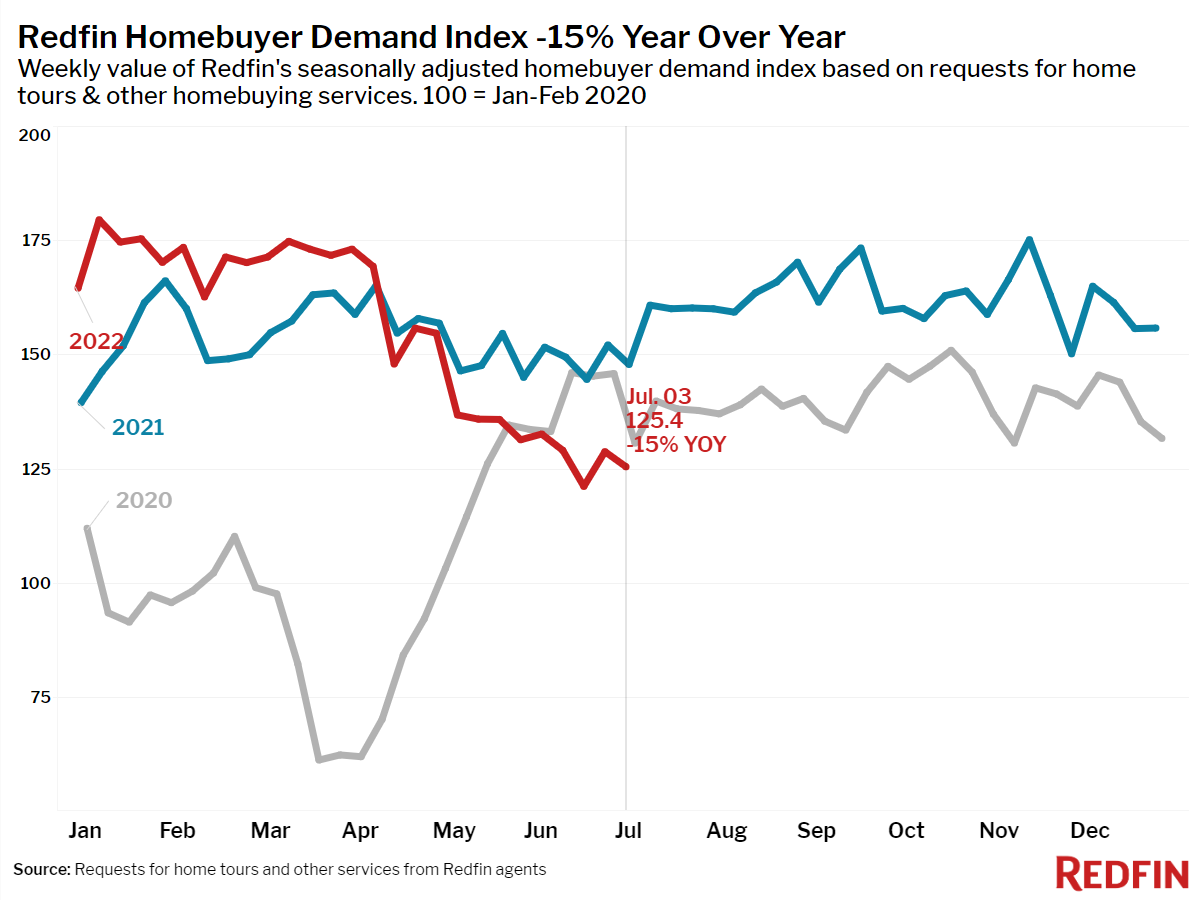
- The seasonally-adjusted Redfin Homebuyer Demand Index—a measure of requests for home tours and other home-buying services from Redfin agents—was down 15% year over year during the week ending July 3.
- Touring activity as of July 3 was down 14% from the start of the year, compared to a 7% increase at the same time last year, according to home tour technology company ShowingTime.
- Mortgage purchase applications were down 17% from a year earlier during the week ending July 1, while the seasonally-adjusted index was down 4% week over week.
Key housing market takeaways for 400+ U.S. metro areas:
Unless otherwise noted, the data in this report covers the four-week period ending July 3. Redfin’s housing market data goes back through 2012.
Data based on homes listed and/or sold during the period:
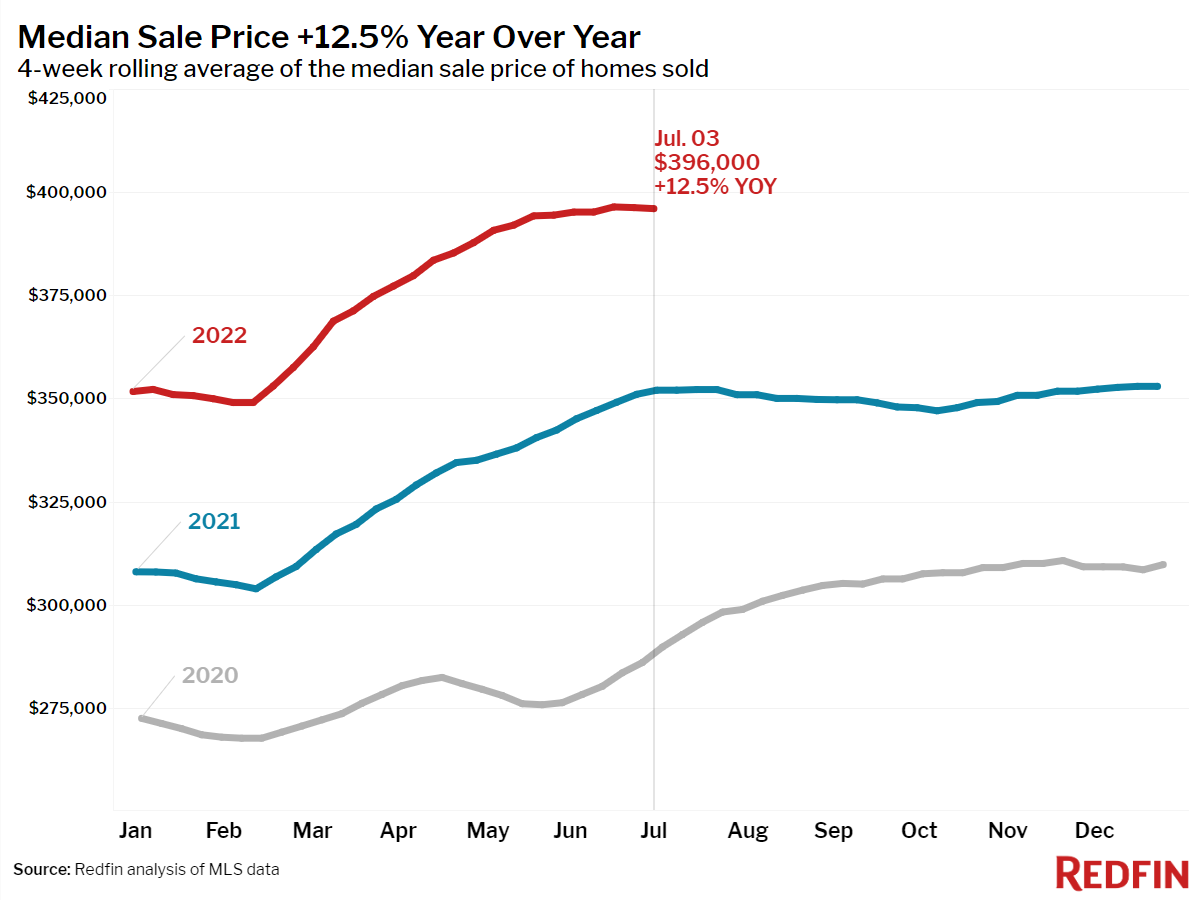
- The median home sale price was up 13% year over year to $396,000. This growth rate is down from the March peak of 16%.
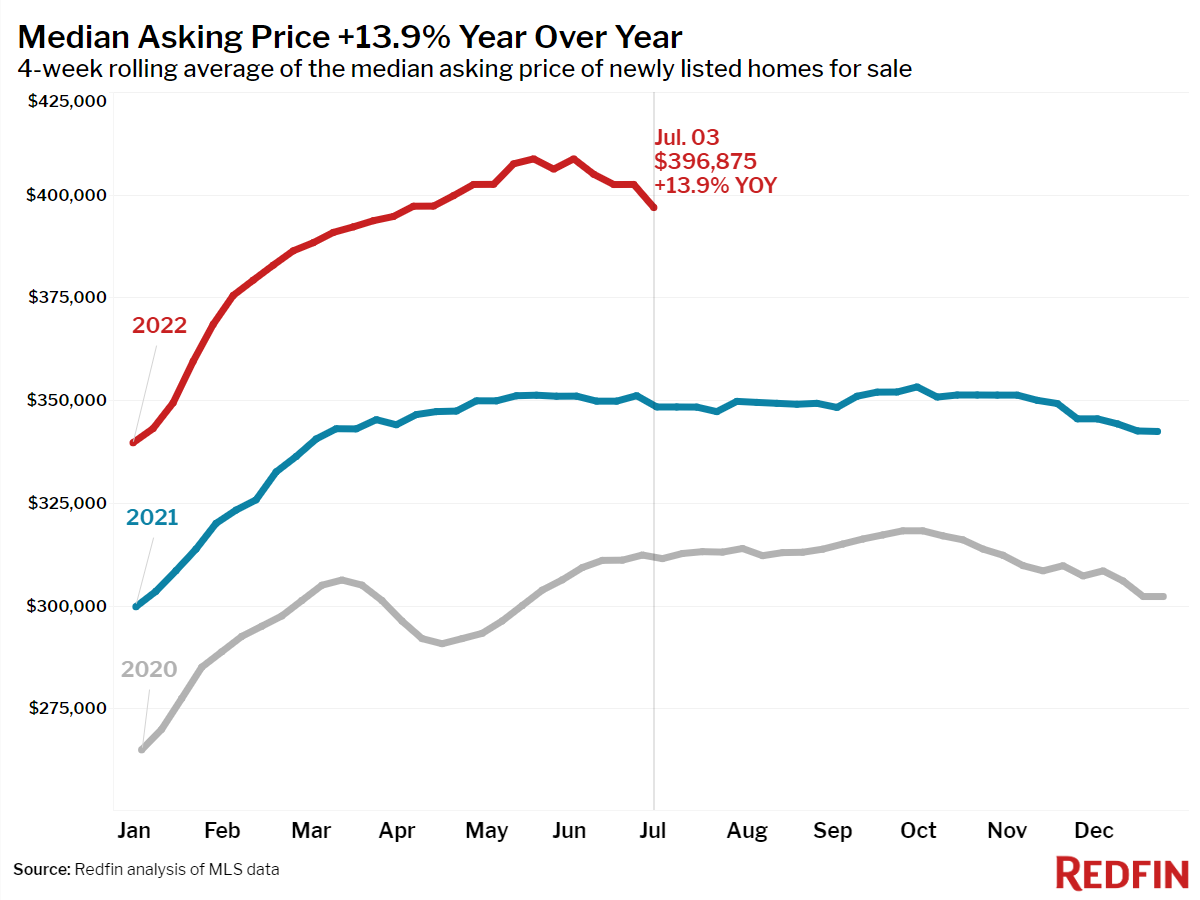
- The median asking price of newly listed homes increased 15% year over year to $399,973, but was down 2.1% from the all-time high set during the four-week period ending June 5.
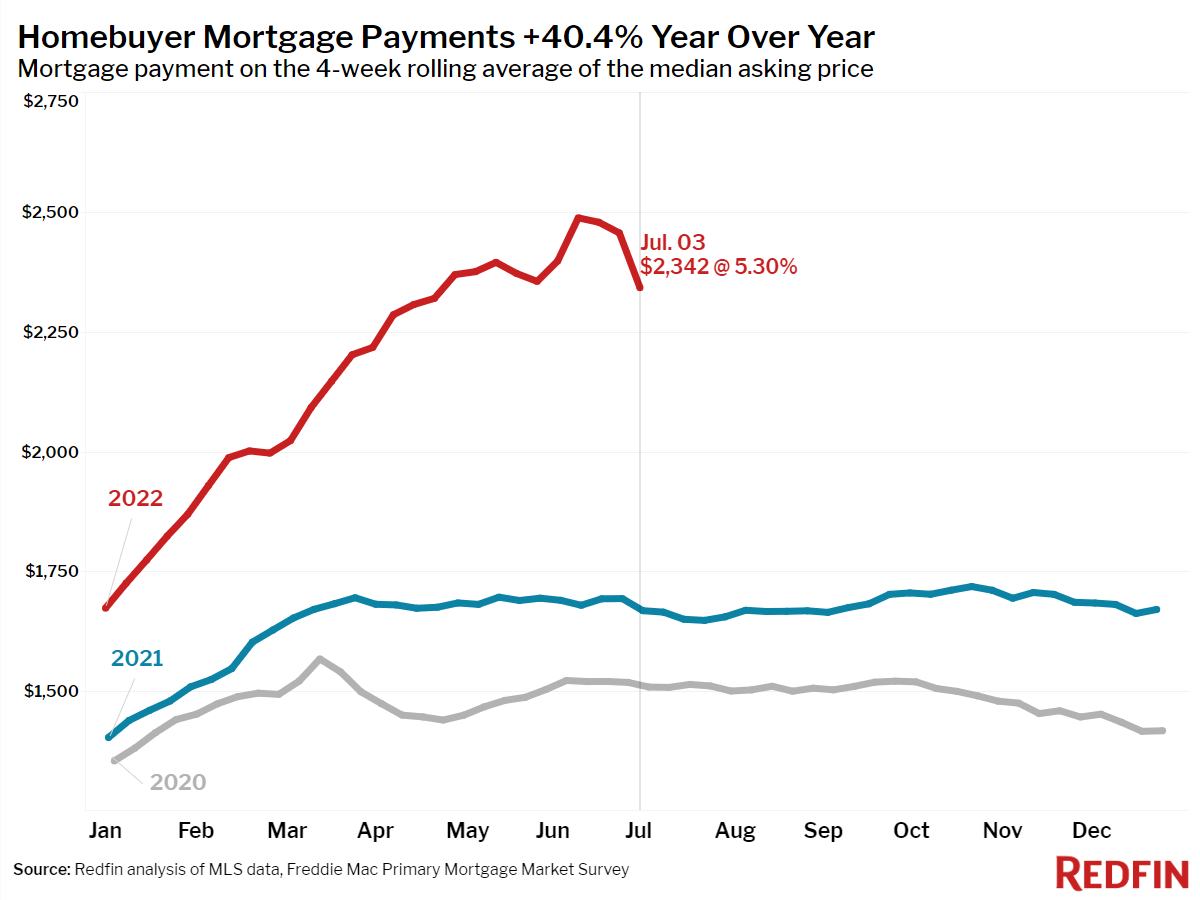
- The monthly mortgage payment on the median asking price home hit $2,342 at the current 5.3% mortgage rate, up 40% from $1,668 a year earlier, when mortgage rates were 2.9%. That’s down slightly from the peak of $2,487 reached during the four weeks ending June 12.
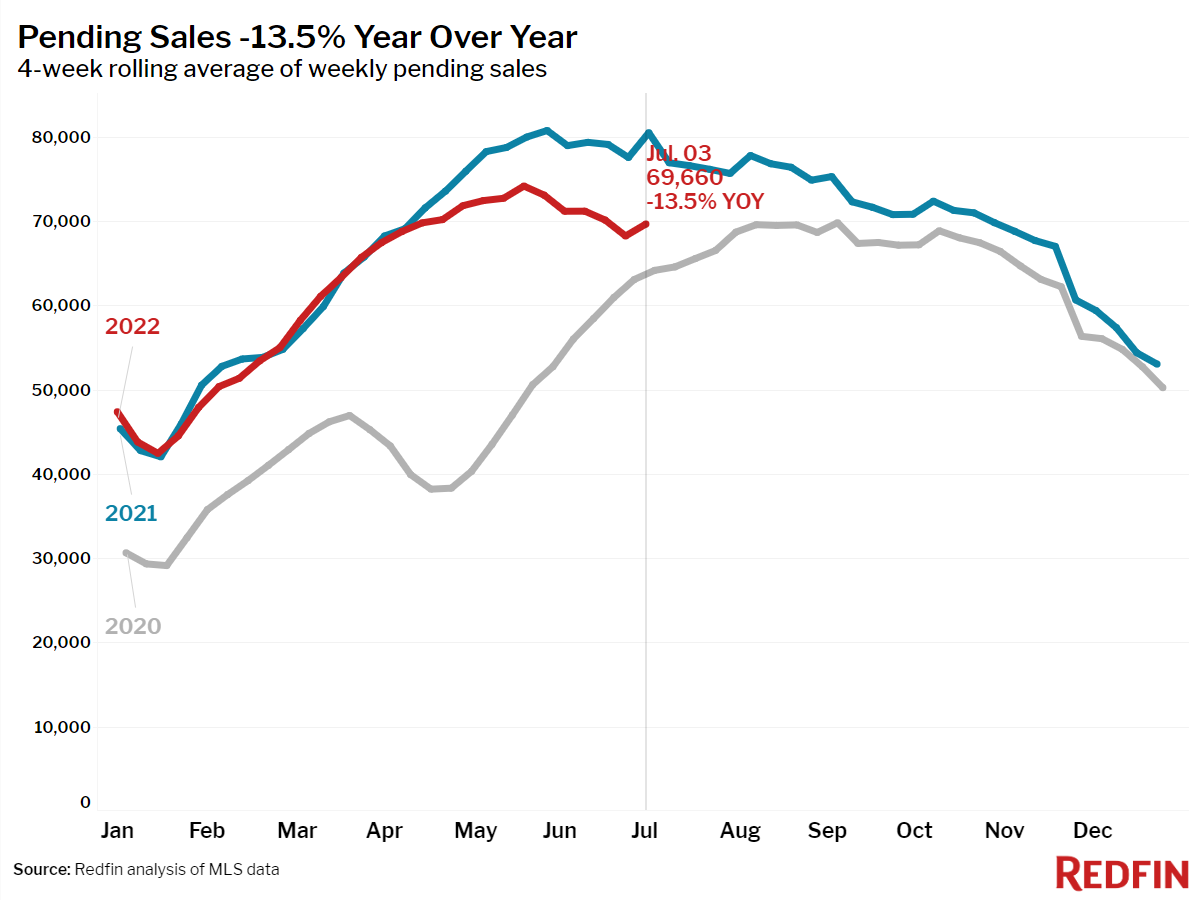
- Pending home sales were down 13% year over year, the largest decline since May 2020.
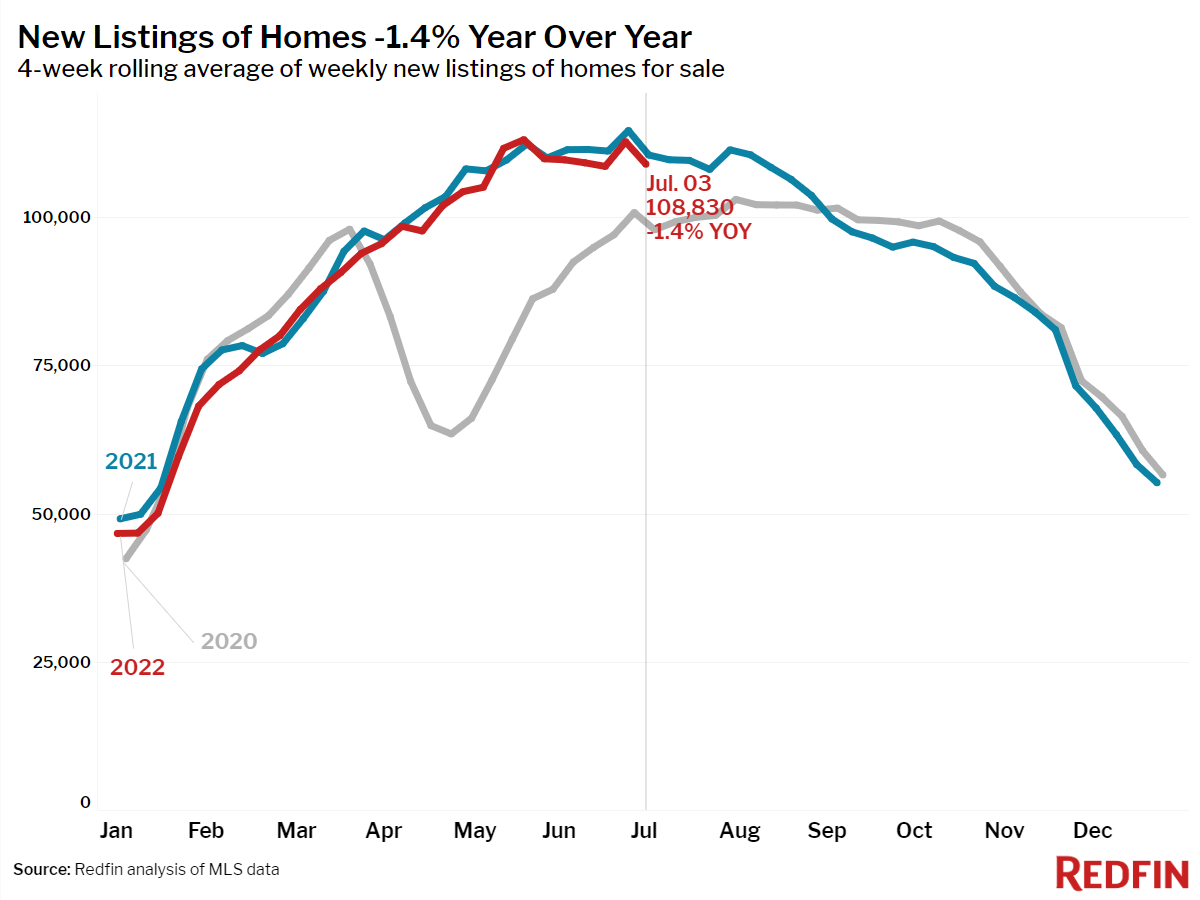
- New listings of homes for sale were down 1.4% from a year earlier.
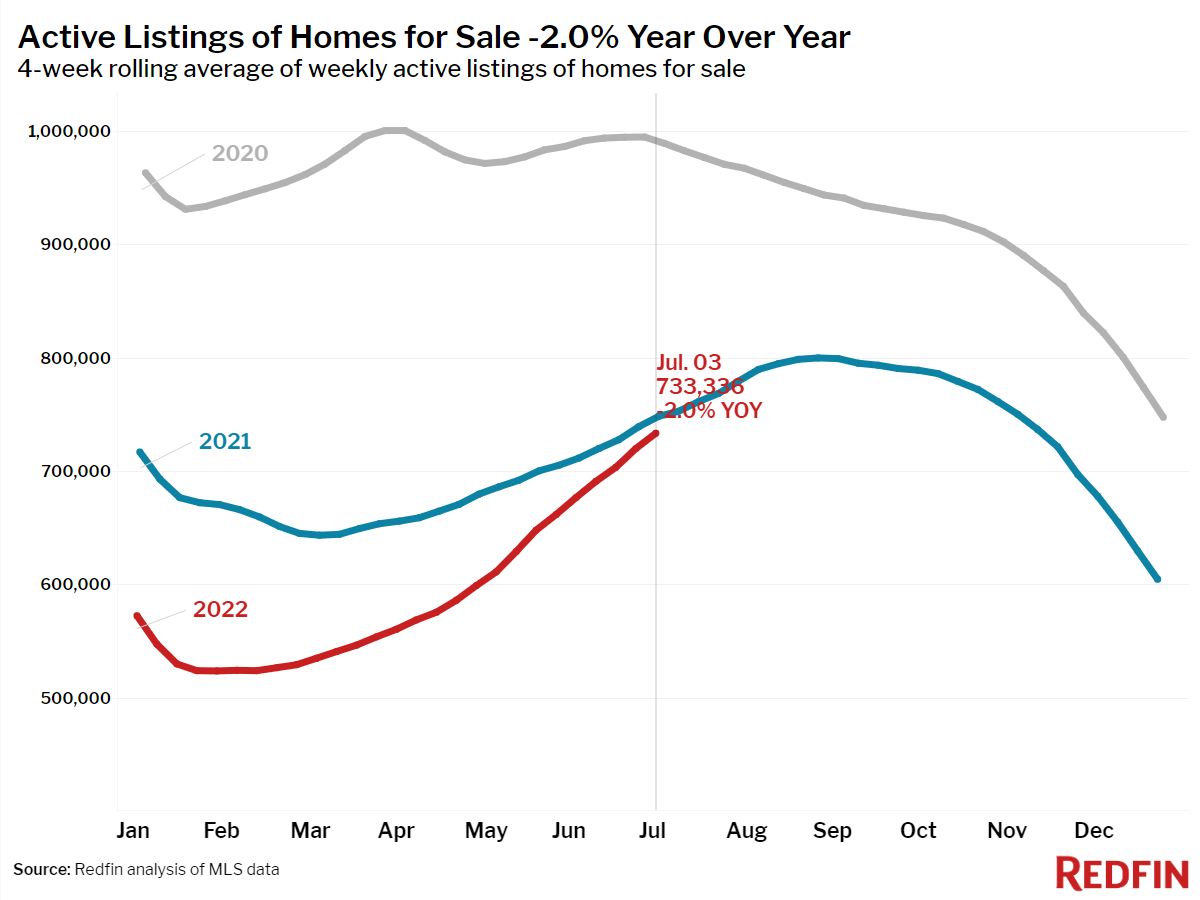
- Active listings (the number of homes listed for sale at any point during the period) fell 2% year over year—the smallest decline since October 2019.
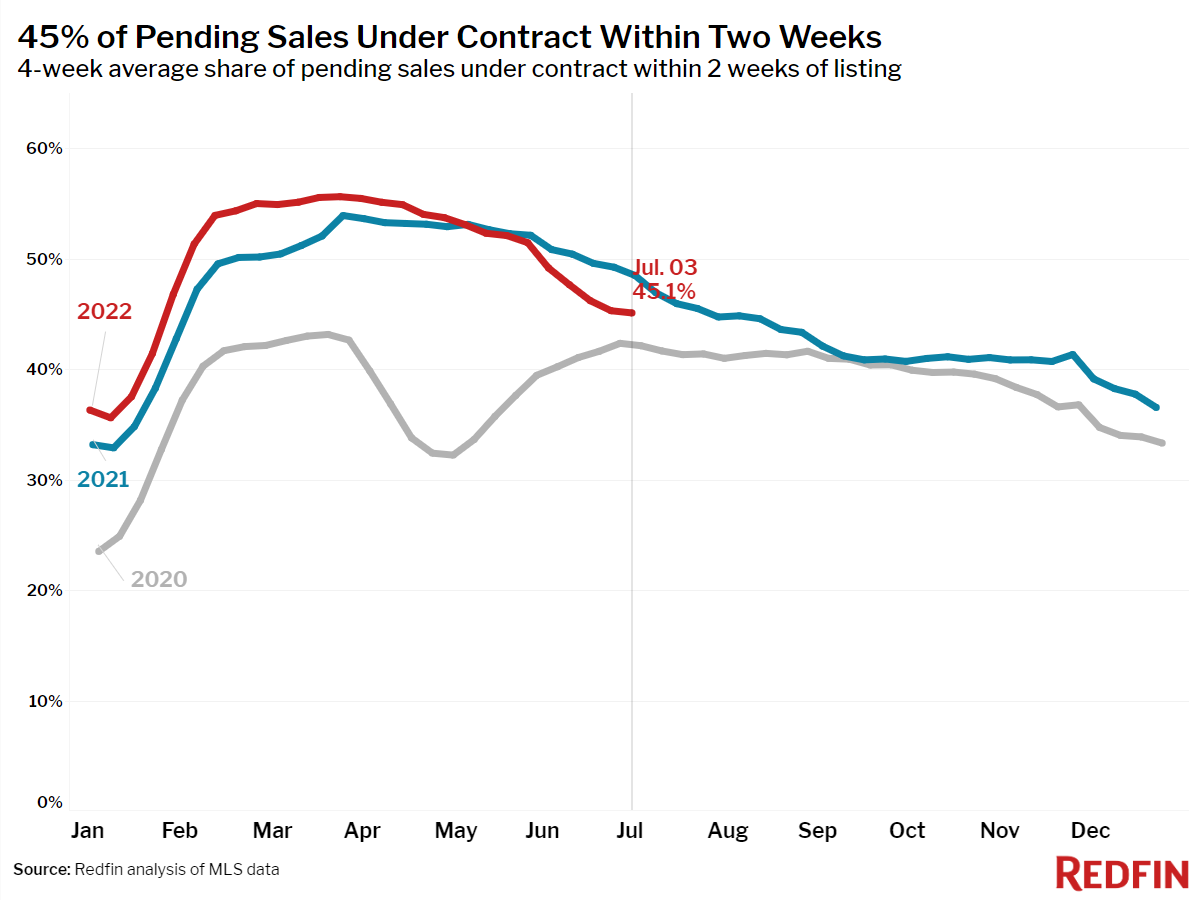
- 45% of homes that went under contract had an accepted offer within the first two weeks on the market, down from 49% a year earlier.
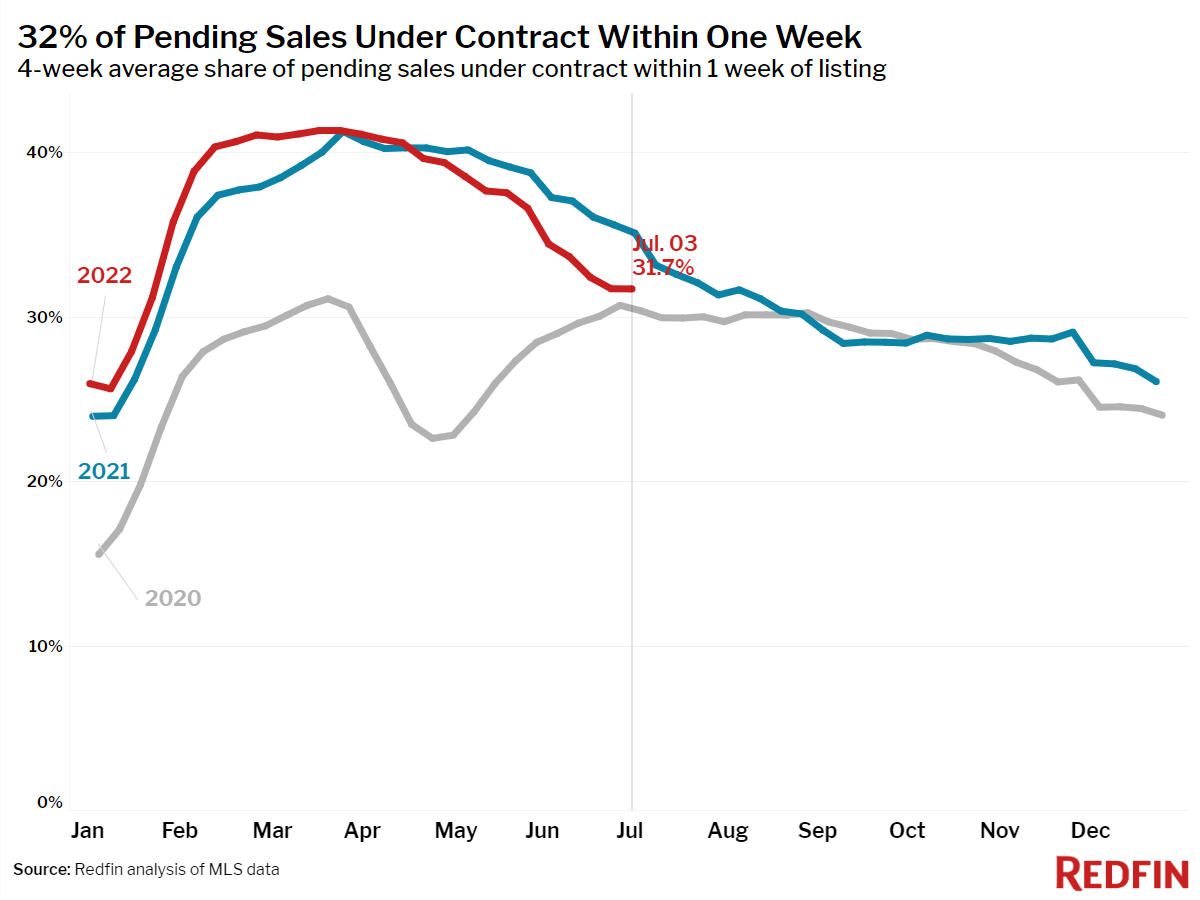
- 32% of homes that went under contract had an accepted offer within one week of hitting the market, down from 35% a year earlier.
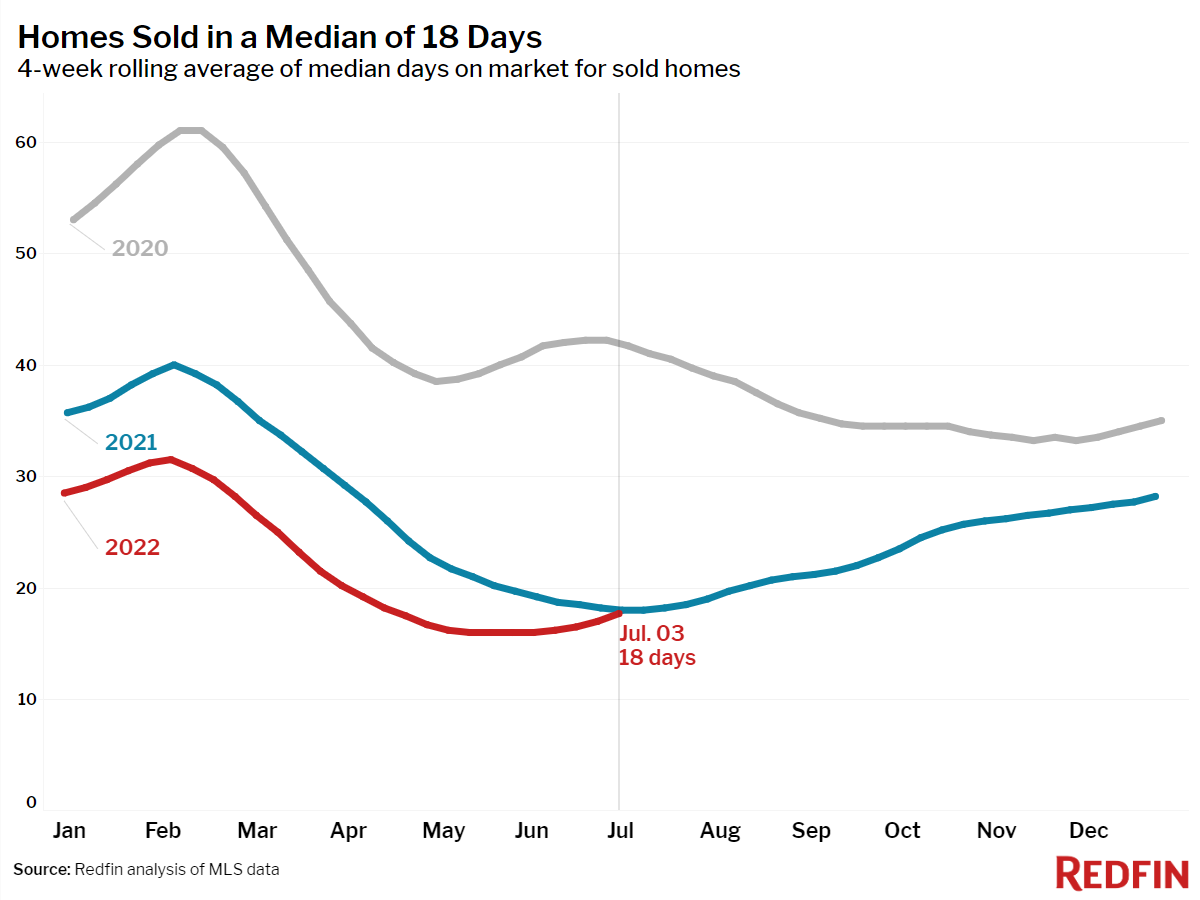
- Homes that sold were on the market for a median of 18 days, flat from a year earlier and up slightly from the record low of 15 days set in May and early June.
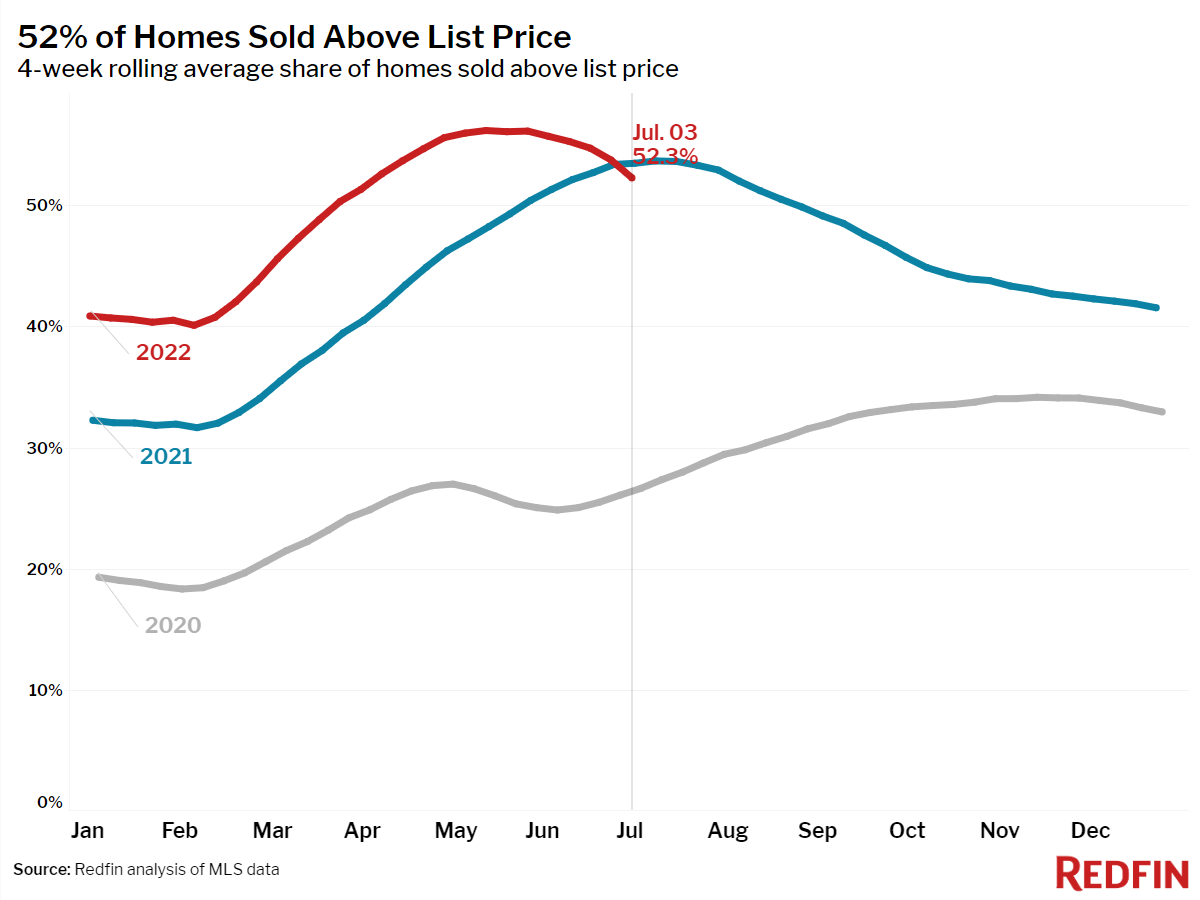
- 52% of homes sold above list price, down from 53% a year earlier. This measure peaked in mid-May and has declined 3.8 points since then.
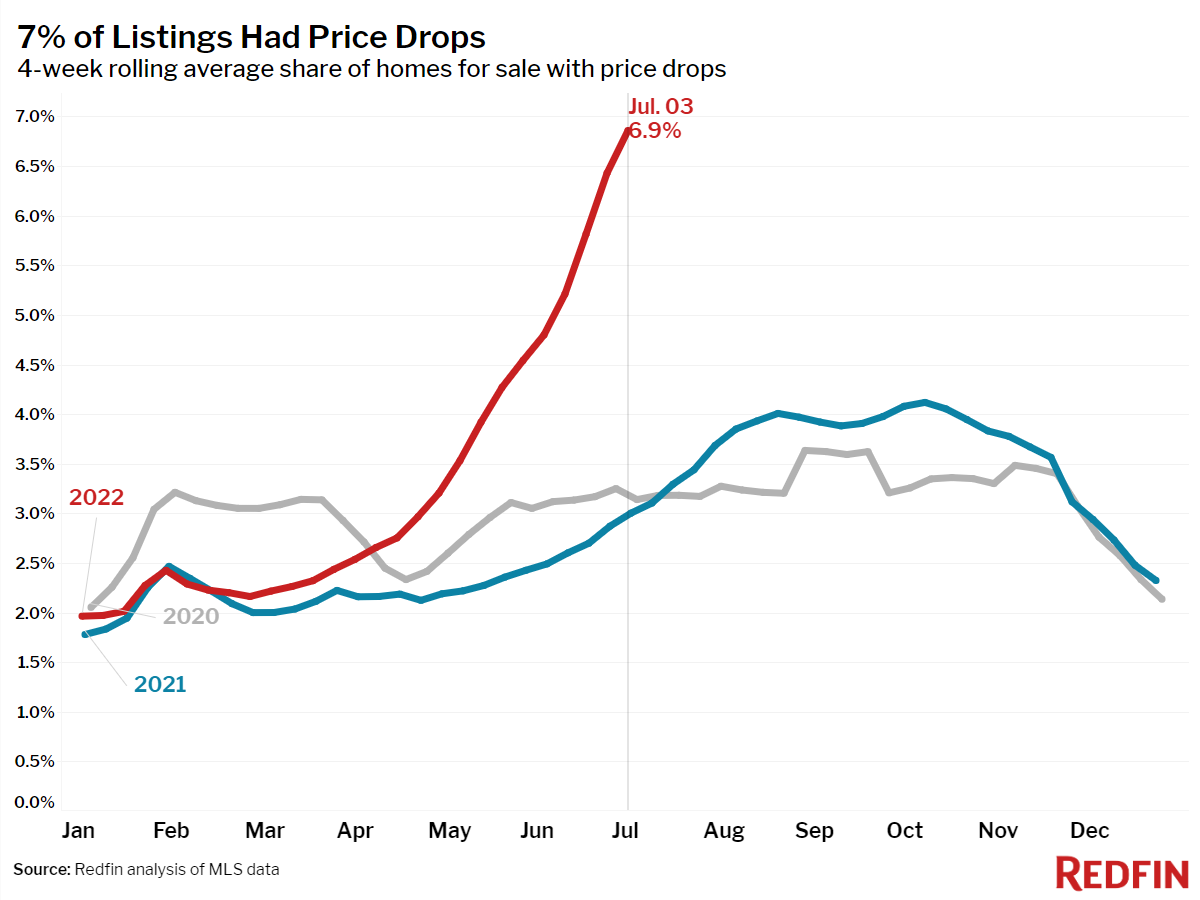
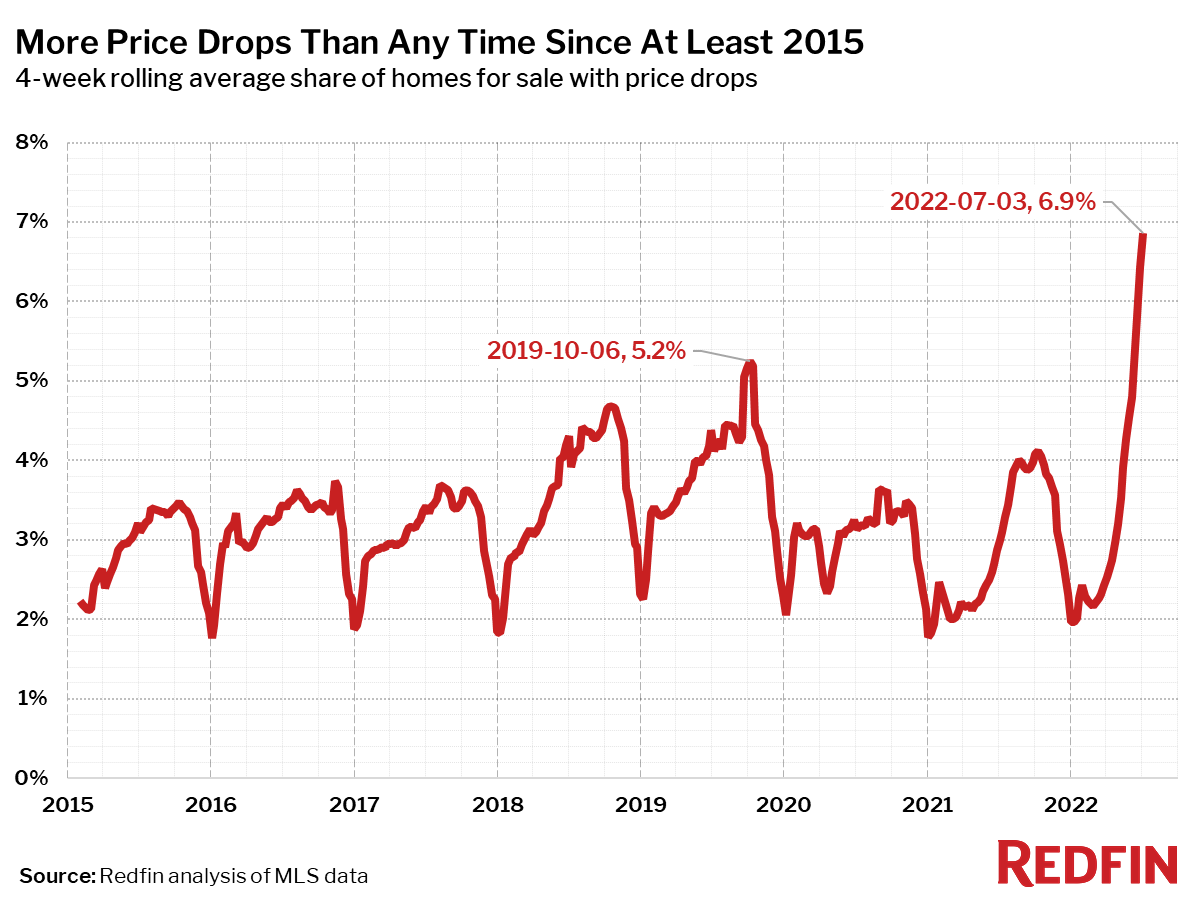
- On average, 7% of homes for sale each week had a price drop, a record high as far back as the data goes, through the beginning of 2015.
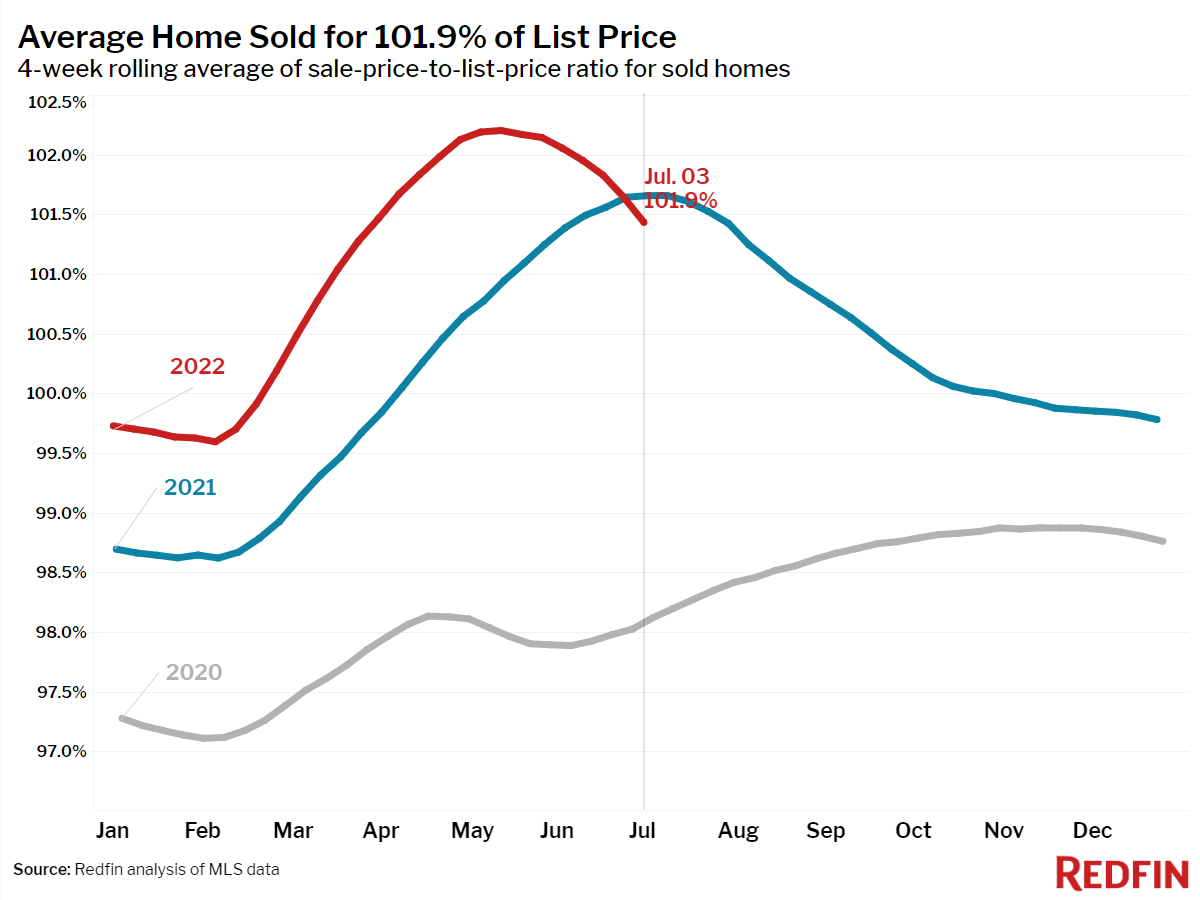
- The average sale-to-list price ratio, which measures how close homes are selling to their asking prices, declined to 101.9%. In other words, the average home sold for 1.9% above its asking price. This was down from 102.2% a year earlier.
Refer to our metrics definition page for explanations of all the metrics used in this report.