2024 is shaping up to be more active than 2023 for homebuyers and sellers, with mortgage applications and new listings rising. But Redfin economists believe demand and listings would be rising more if not for harsher-than-usual winter weather.
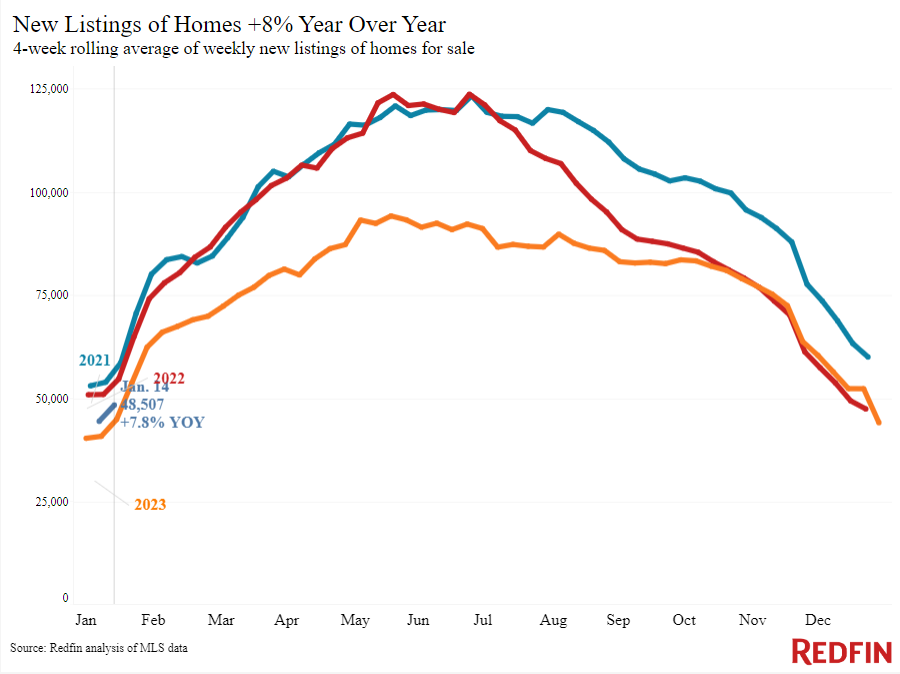
Homebuyers and sellers are gradually becoming more active as the calendar flips further into 2024. Mortgage-purchase applications are up 8% from a month ago, and Redfin agents report that lower mortgage rates are piquing buyers’ interest. On the sell side, new listings increased 8% year over year during the four weeks ending January 14.
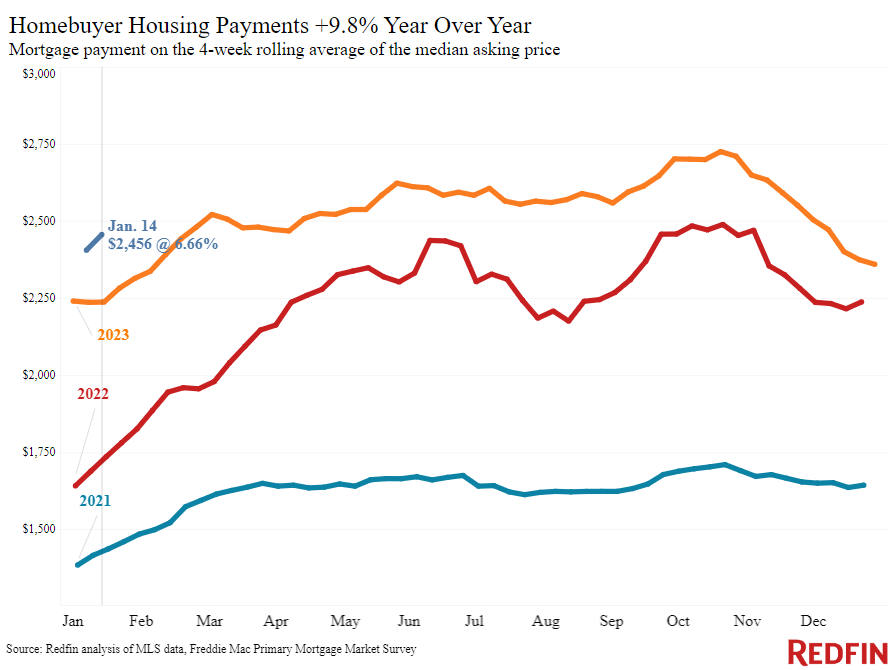
Buyers and sellers are making moves largely because mortgage rates are holding steady in the mid-6% range, down from 8% in October. The typical U.S. homebuyer’s monthly housing payment is $2,456 with this week’s average rate; while that’s up 10% year over year, it’s down from October’s record high of over $2,700.
Redfin economists say buyer demand and listings would likely be picking up more if not for the severe winter weather much of the country experienced over the last week. “We expected both buyers and sellers to react more strongly to last month’s drop in mortgage rates once the holidays passed, but frigid weather and snowstorms have halted a lot of buying and selling plans,” said Redfin Economic Research Lead Chen Zhao. “As long as rates don’t shoot up, we expect the market to pick up as the spring season approaches.”
Redfin agents say weather conditions aside, buyers are feeling more optimistic. “People who were casually house hunting when rates were higher are getting serious now,” said Chicago Redfin Premier agent Dan Close. “Buyers are feeling more confident that they can get good value for their money, and many first-timers are jumping in because Chicago rents are still rising. Homeowners who were waiting for the holidays to be over and rates to come down before selling are getting ready to list. I have several listings prepped to hit the market, some as early as this week and some throughout the rest of the first quarter.”
Leading indicators
| Indicators of homebuying demand and activity | ||||
| Value (if applicable) | Recent change | Year-over-year change | Source | |
| Daily average 30-year fixed mortgage rate | 6.88% (Jan. 17) | Up slightly from 6.78% a week earlier | Up from 6.07% | Mortgage News Daily |
| Weekly average 30-year fixed mortgage rate | 6.66% (week ending Jan. 11) | Near lowest level since May | Up from 6.33% | Freddie Mac |
| Mortgage-purchase applications (seasonally adjusted) | Up 9% from a week earlier; up 8% from a month earlier (as of week ending Jan. 12) | Down 20% | Mortgage Bankers Association | |
| Google searches for “home for sale” | Up 10% from a month earlier (as of Jan. 16) | Down 13% | Google Trends | |
| We excluded Redfin’s Homebuyer Demand Index this week to ensure data accuracy | ||||
Key housing-market data
| U.S. highlights: Four weeks ending January 14, 2024
Redfin’s national metrics include data from 400+ U.S. metro areas, and is based on homes listed and/or sold during the period. Weekly housing-market data goes back through 2015. Subject to revision. |
|||
| Four weeks ending January 14, 2024 | Year-over-year change | Notes | |
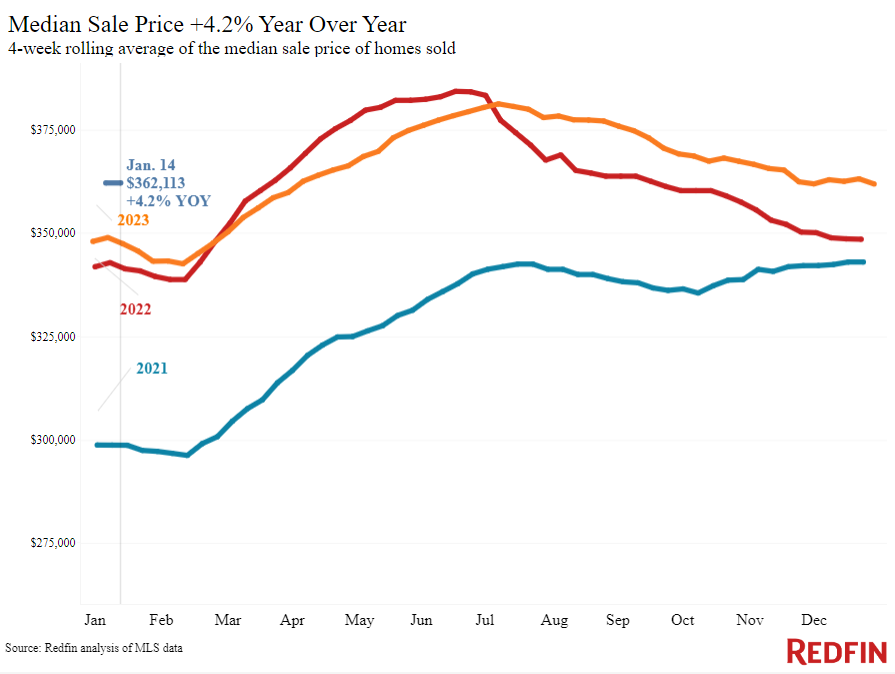
| Median sale price | $362,113 | 4.2% | |
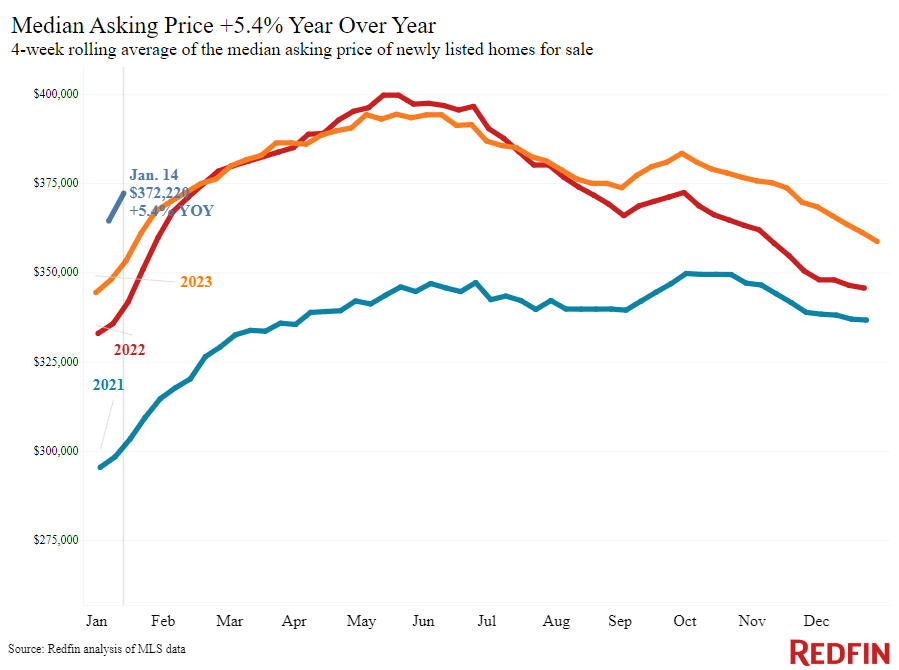
| Median asking price | $372,220 | 5.4% | |
| Median monthly mortgage payment | $2,456 at a 6.66% mortgage rate | 9.8% | Down nearly $300 from all-time high set during the four weeks ending Oct. 22 |
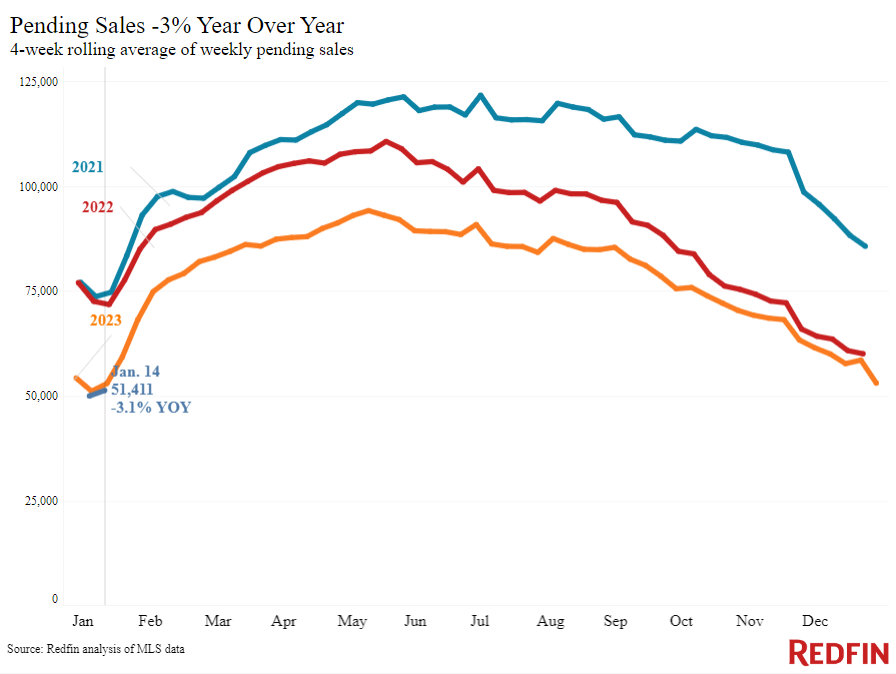
| Pending sales | 51,411 | -3.1% | |
| New listings | 48,507 | 7.8% | |
| Active listings | 762,737 | -2.4% | Smallest decline since June |
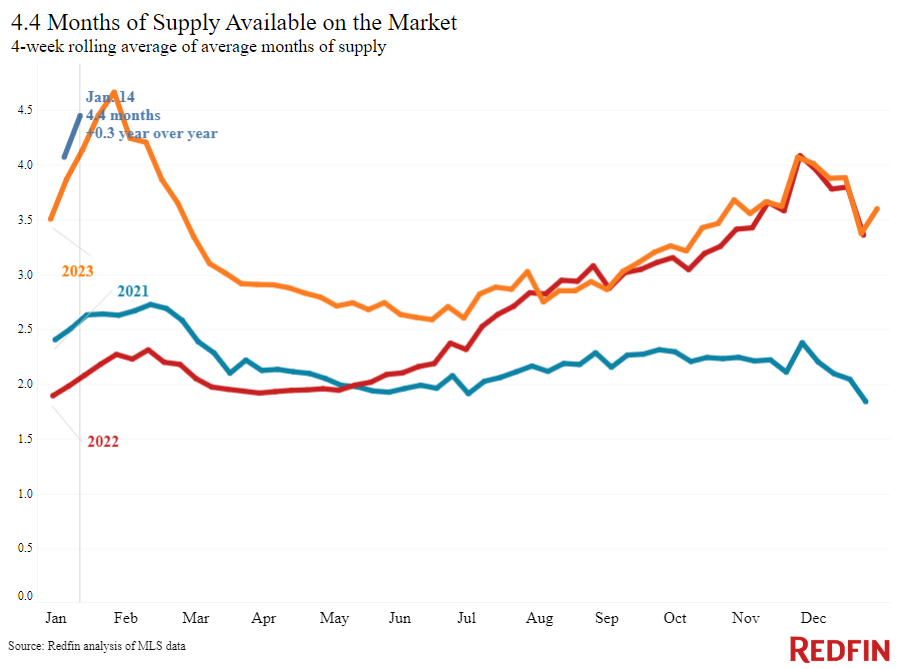
| Months of supply | 4.4 months | +0.3 pts. | 4 to 5 months of supply is considered balanced, with a lower number indicating seller’s market conditions. |
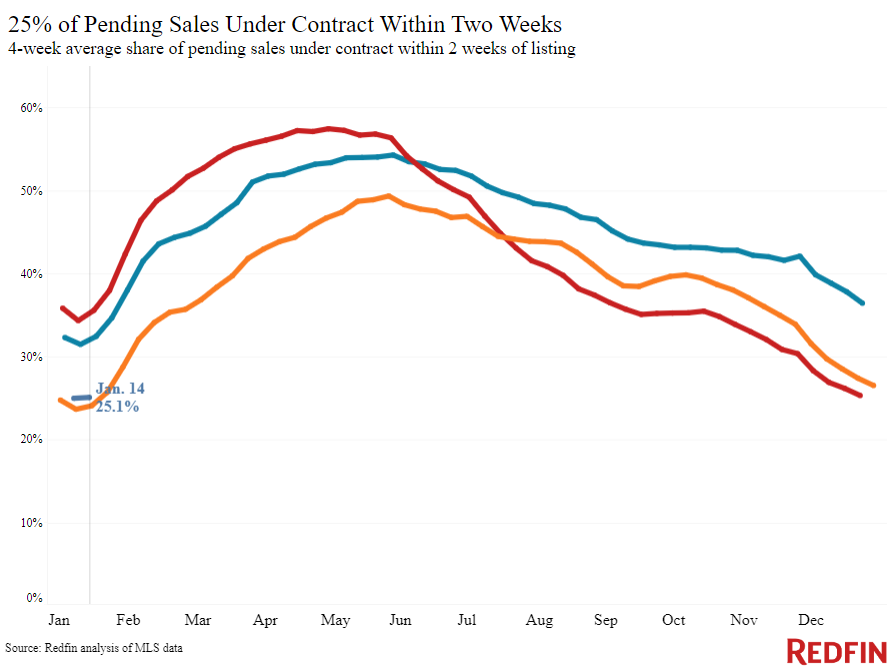
| Share of homes off market in two weeks | 25.1% | Unchanged | |
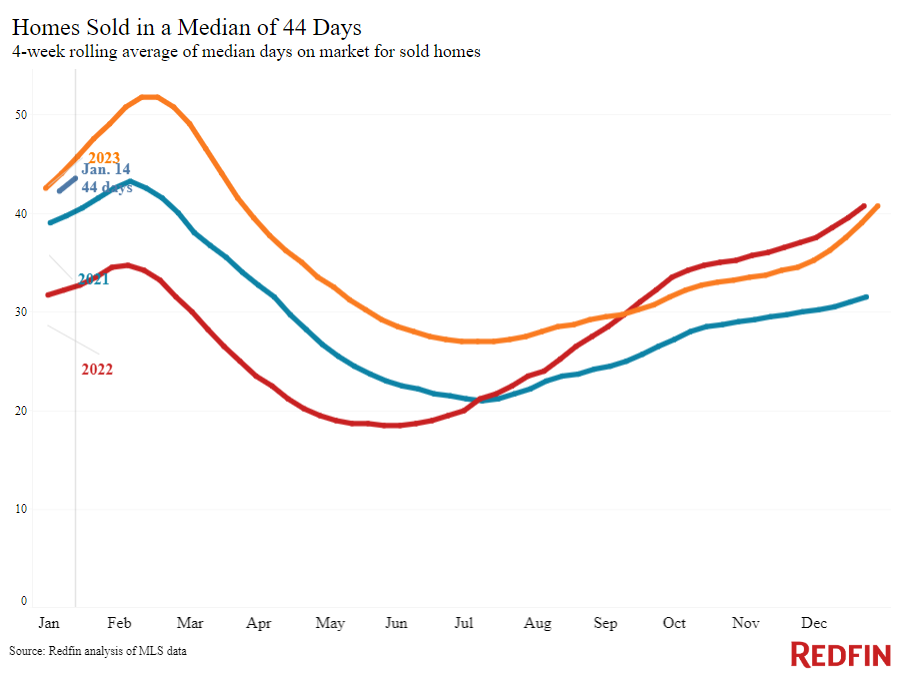
| Median days on market | 44 | -2 days | |
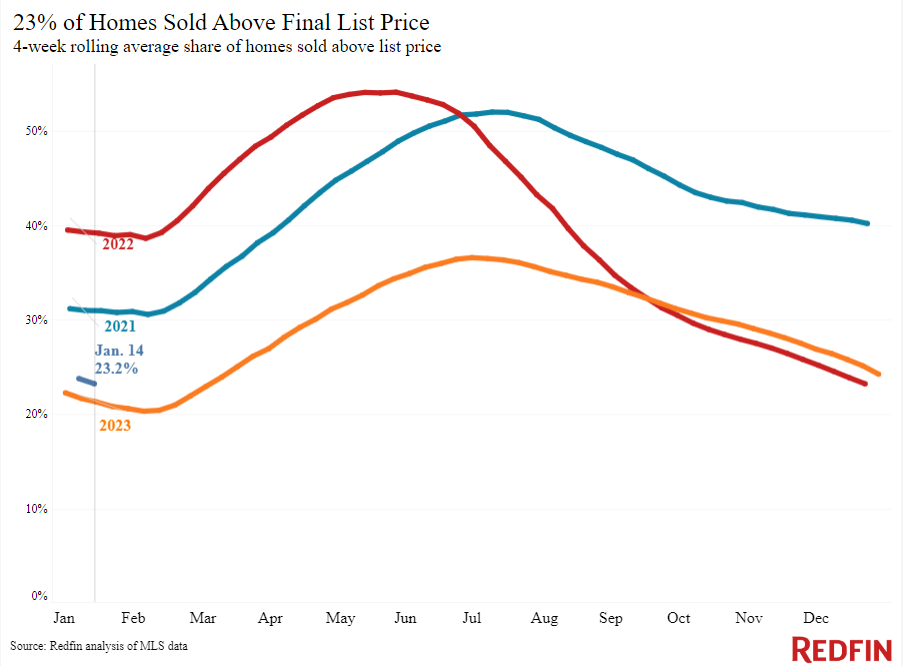
| Share of homes sold above list price | 23.2% | Up from 21% | |
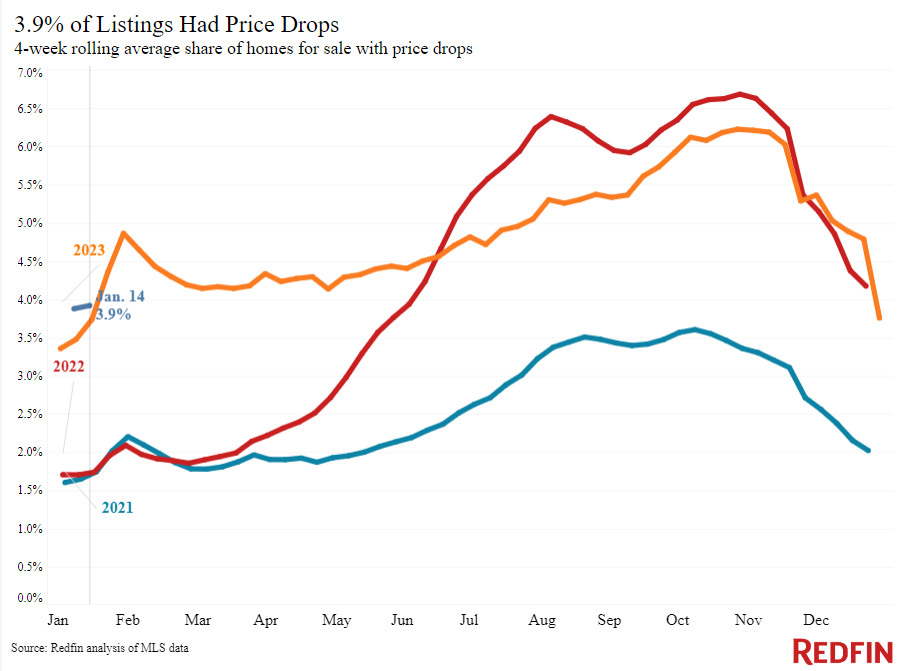
| Share of homes with a price drop | 3.9% | +0.2 pts. | |
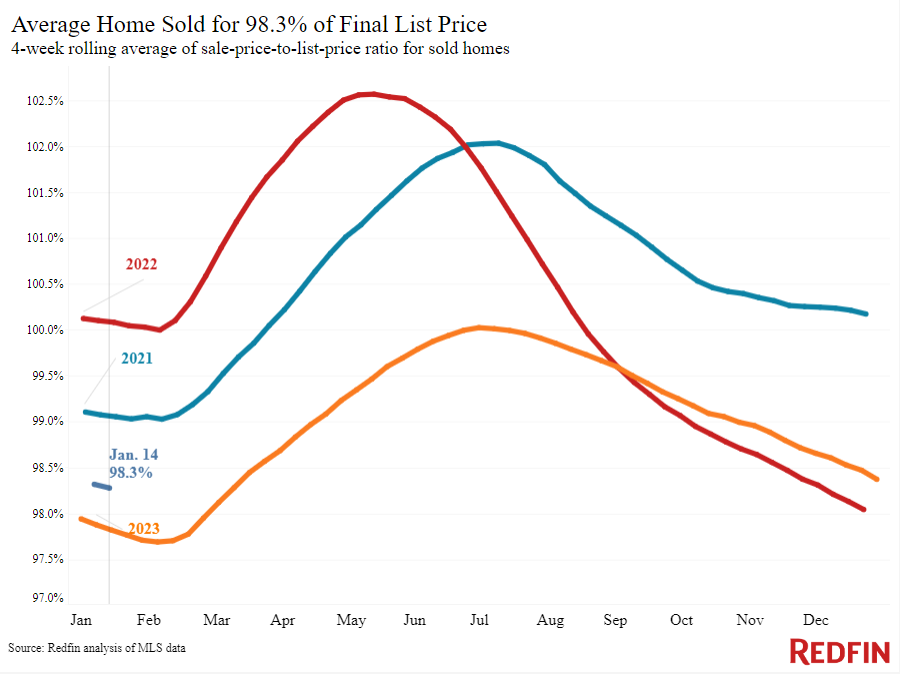
| Average sale-to-list price ratio | 98.3% | +0.5 pts. | |
|
Metro-level highlights: Four weeks ending January 14, 2024 Redfin’s metro-level data includes the 50 most populous U.S. metros. Select metros may be excluded from time to time to ensure data accuracy. |
|||
|---|---|---|---|
| Metros with biggest year-over-year increases | Metros with biggest year-over-year decreases | Notes | |
| Median sale price |
Anaheim, CA (16.6%) West Palm Beach, FL (14.8%) Newark, NJ (14.1%) Fort Lauderdale, FL (13.1%) Miami (12.8%) |
Oakland, CA (-3.4%) Austin, TX (-2.8%) Fort Worth, TX (-0.3%) San Antonio, TX (-0.1%) |
Declined in 4 metros |
| Pending sales | San Jose, CA (10.6%)
Detroit (9.5%) Milwaukee, WI (6.1%) Columbus, OH (5.6%) Pittsburgh, PA (4.7%) |
Newark, NJ (-14.3%)
New Brunswick, NJ (-13.9%) New York (-13.2%) San Diego (-12.2%) West Palm Beach, FL (-11.3%) |
Increased in 13 metros |
| New listings | Phoenix (24.4%)
Minneapolis, MN (22.1%) Pittsburgh, PA (19.1%) Houston (18.6%) San Antonio, TX (17.6%) |
Chicago (-13.8%)
Atlanta (-10.2%) Newark, NJ (-7.3%) Providence, RI (-7.1%) Portland, OR (-5.6%) |
Declined in 10 metros |
Refer to our metrics definition page for explanations of all the metrics used in this report.