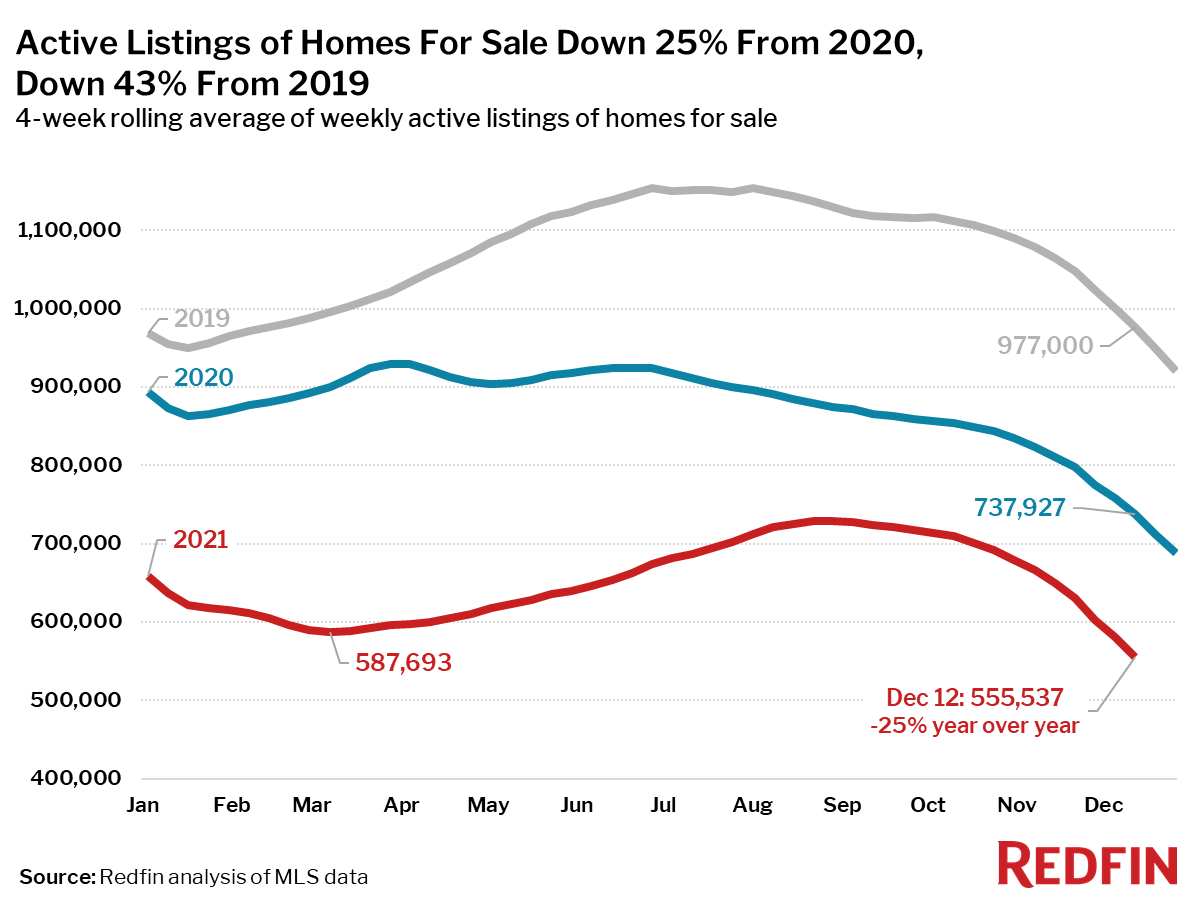
The number of homes for sale fell to an all-time low, down 25% from a year earlier.
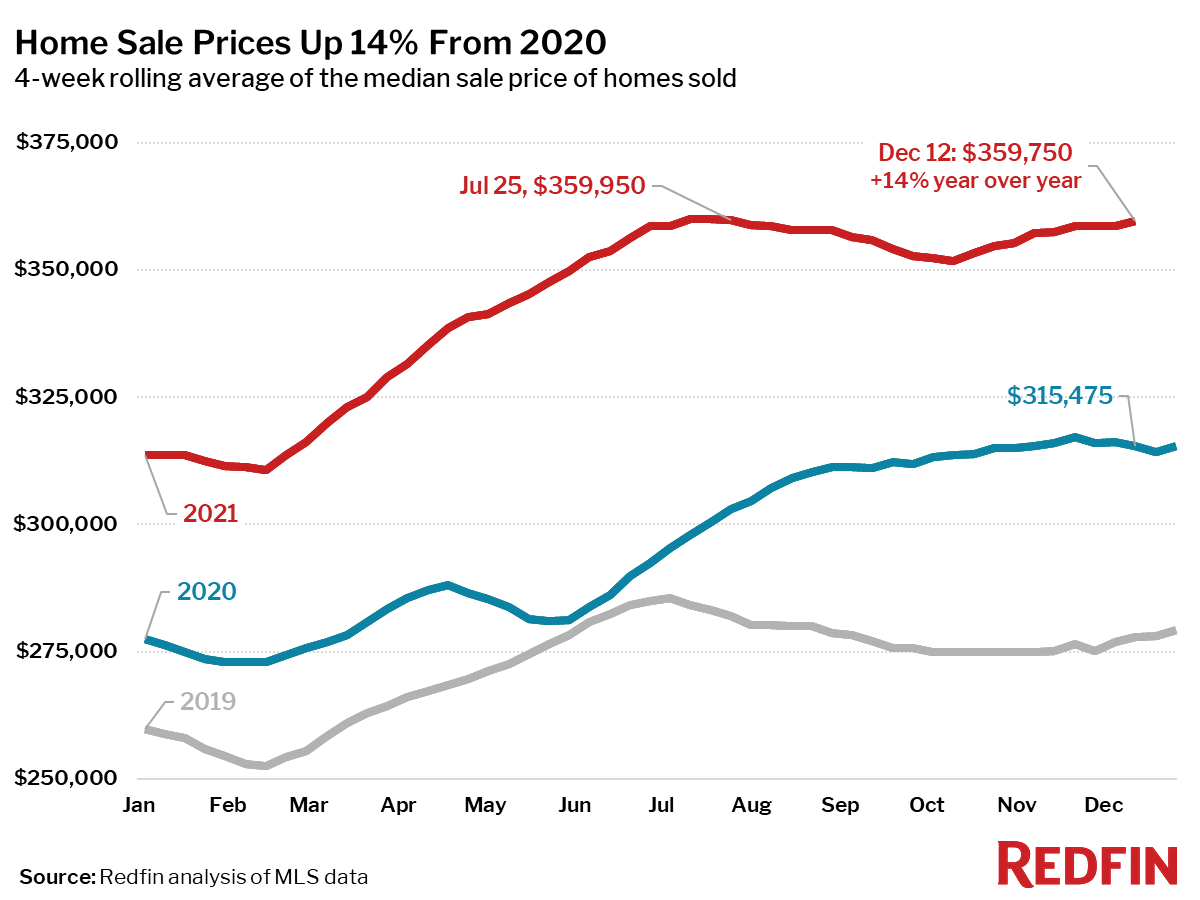
The median home sale price rose 14% year over year to $359,750, just shy of its all-time high, as the number of homes for sale fell to an all-time low during the four-week period ending December 12. Homebuying demand continued to outpace supply; the average home sold for more than its list price for the 39th straight week. Other housing market measures followed typical seasonal trends, slowing down as winter approaches. The median sale price in recent periods revised down slightly as more sales from those periods were recorded.
“Homebuyers are being hit particularly hard by this wave of inflation,” said Redfin Chief Economist Daryl Fairweather. “People who set out to buy a home in 2020 but delayed their plans or lost out in bidding wars may now find themselves priced out of homeownership. Right now the only thing likely to slow the rate of home-price growth is a mortgage-rate hike, which would be something of a Pyrrhic victory for homebuyers.”
Key housing market takeaways for 400+ U.S. metro areas:
Unless otherwise noted, the data in this report covers the four-week period ending December 12. Redfin’s housing market data goes back through 2012. Comparing today’s market with the pre-pandemic fall market of 2019 highlights how hot the market remains, even as most measures are settling into typical seasonal patterns.
Data based on homes listed and/or sold during the period:
- The median home-sale price hit $359,750, up 14% year over year and just shy of the all-time high of $359,950 in July This was up 29% from the same period in 2019.
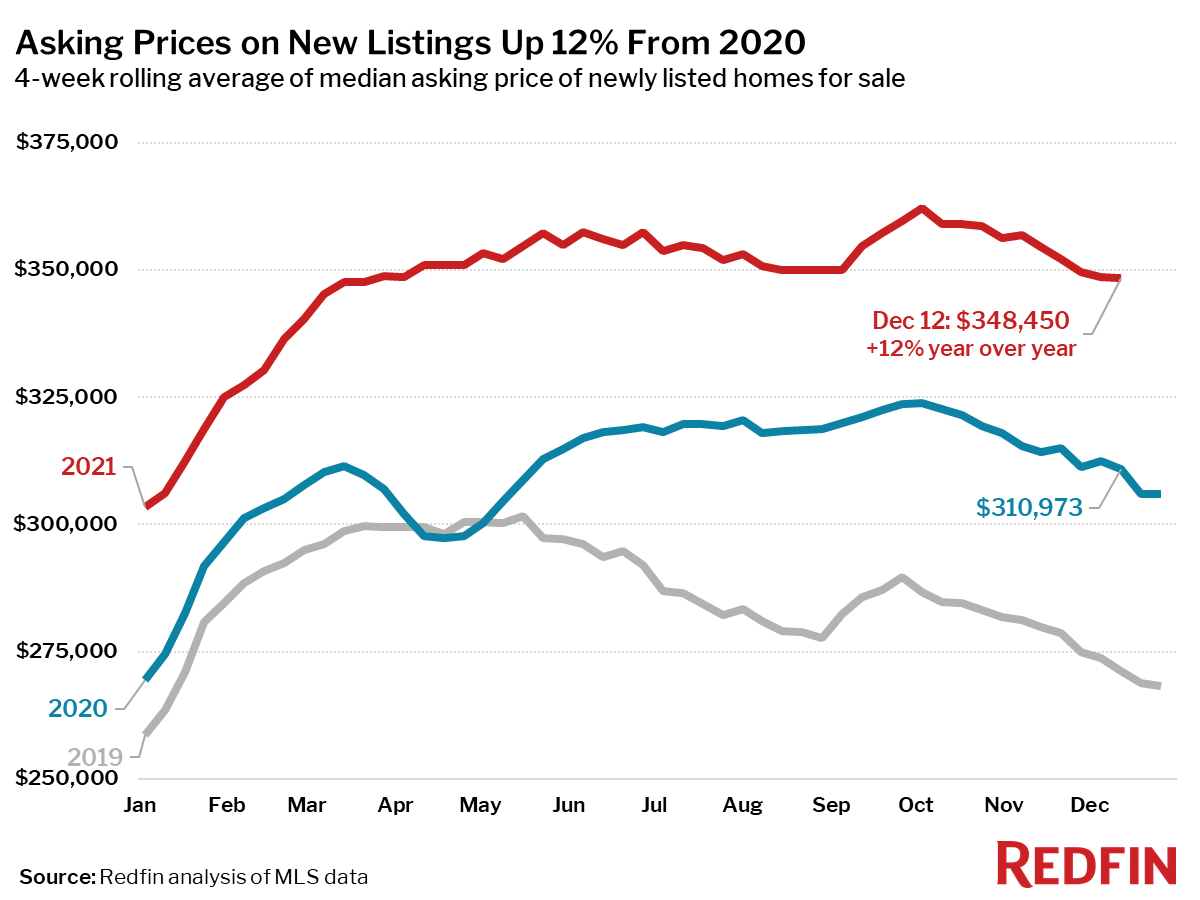
- Asking prices of newly listed homes were up 12% from the same time a year ago and up 28% from 2019 to a median of $348,450.
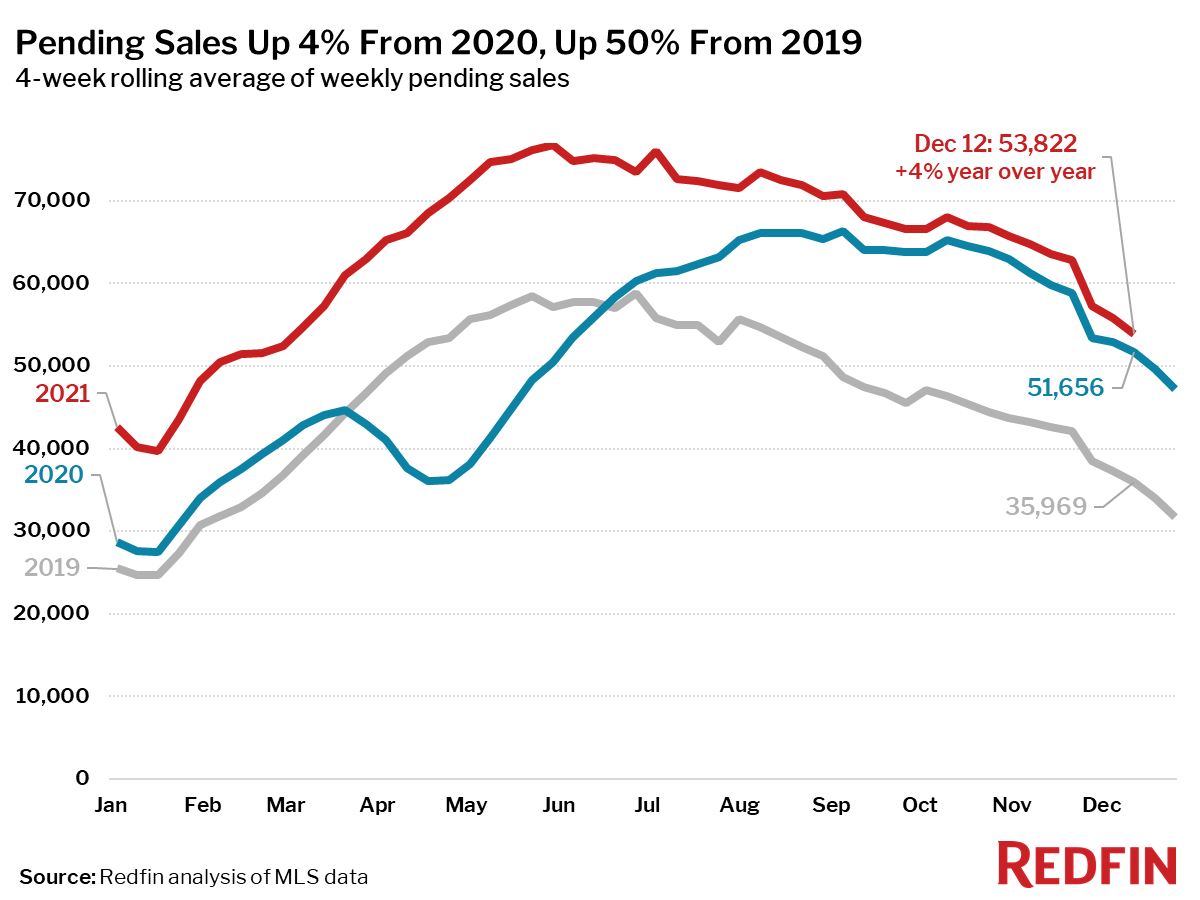
- Pending home sales were up 4% year over year, and up 50% compared to the same period in 2019.
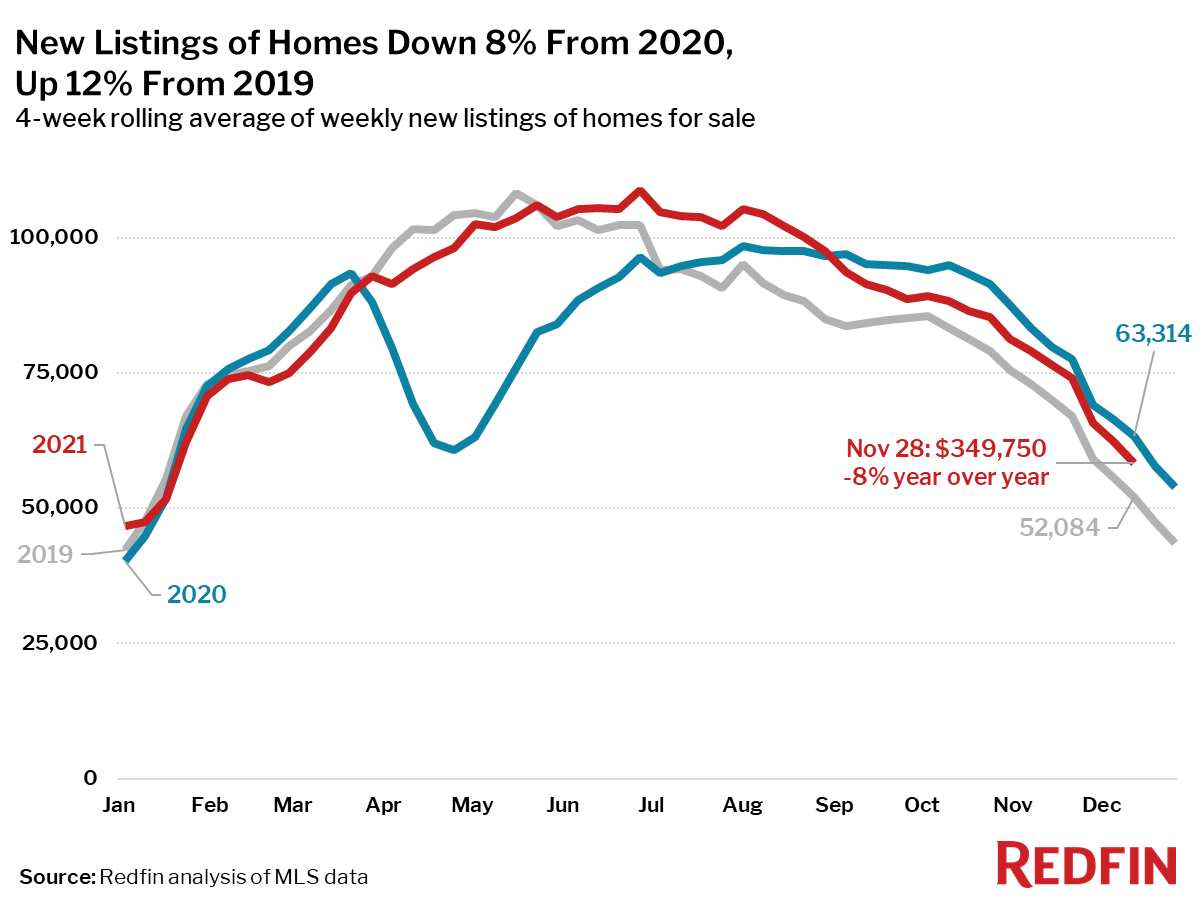
- New listings of homes for sale were down 8% from a year earlier, but up 12% from 2019.
- Active listings (the number of homes listed for sale at any point during the period) fell to a new all-time low, down 25% from 2020 and 43% from 2019.
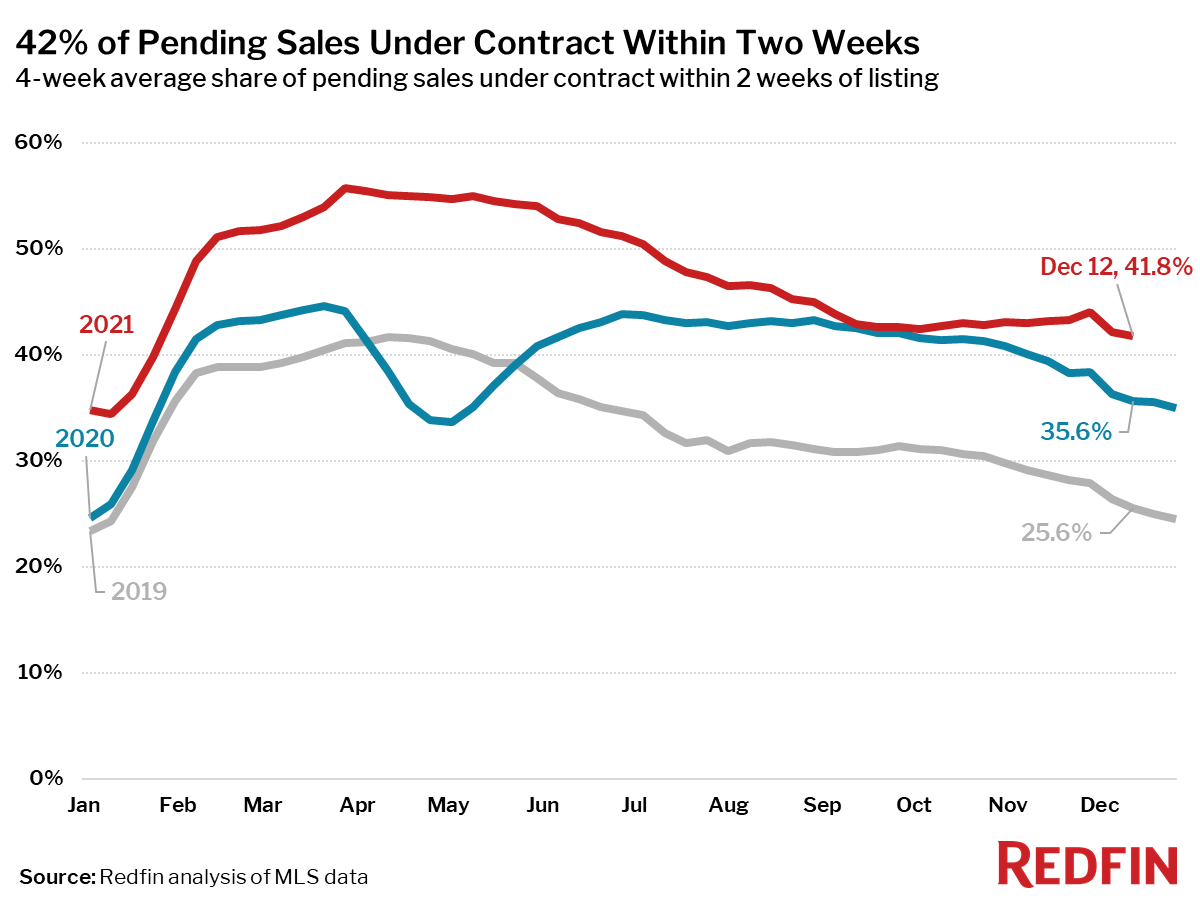
- The share of homes that went under contract that had an accepted offer within the first two weeks on the market was 42%, above the 36% rate of a year earlier and the 26% rate in 2019.
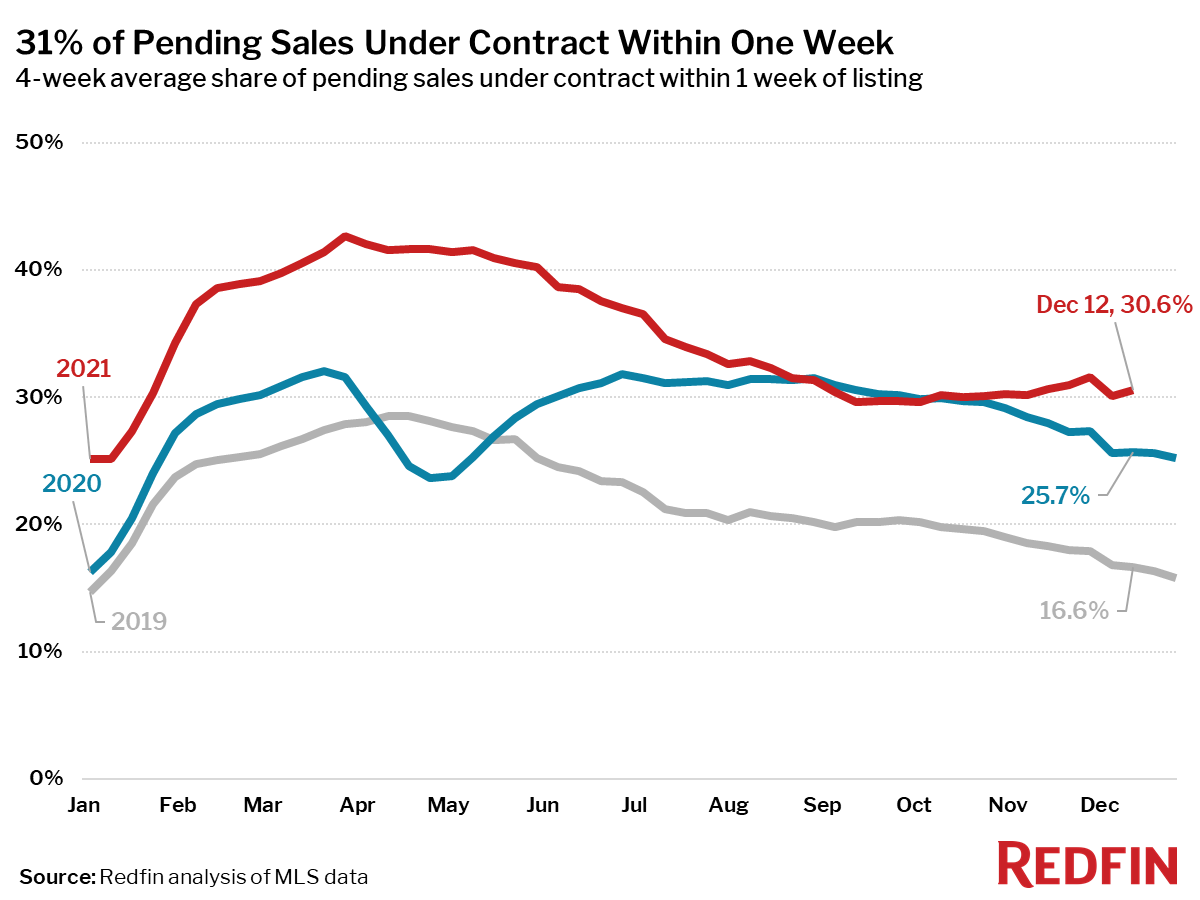
- 31% of homes that went under contract had an accepted offer within one week of hitting the market, up from 26% during the same period a year earlier and 17% in 2019.
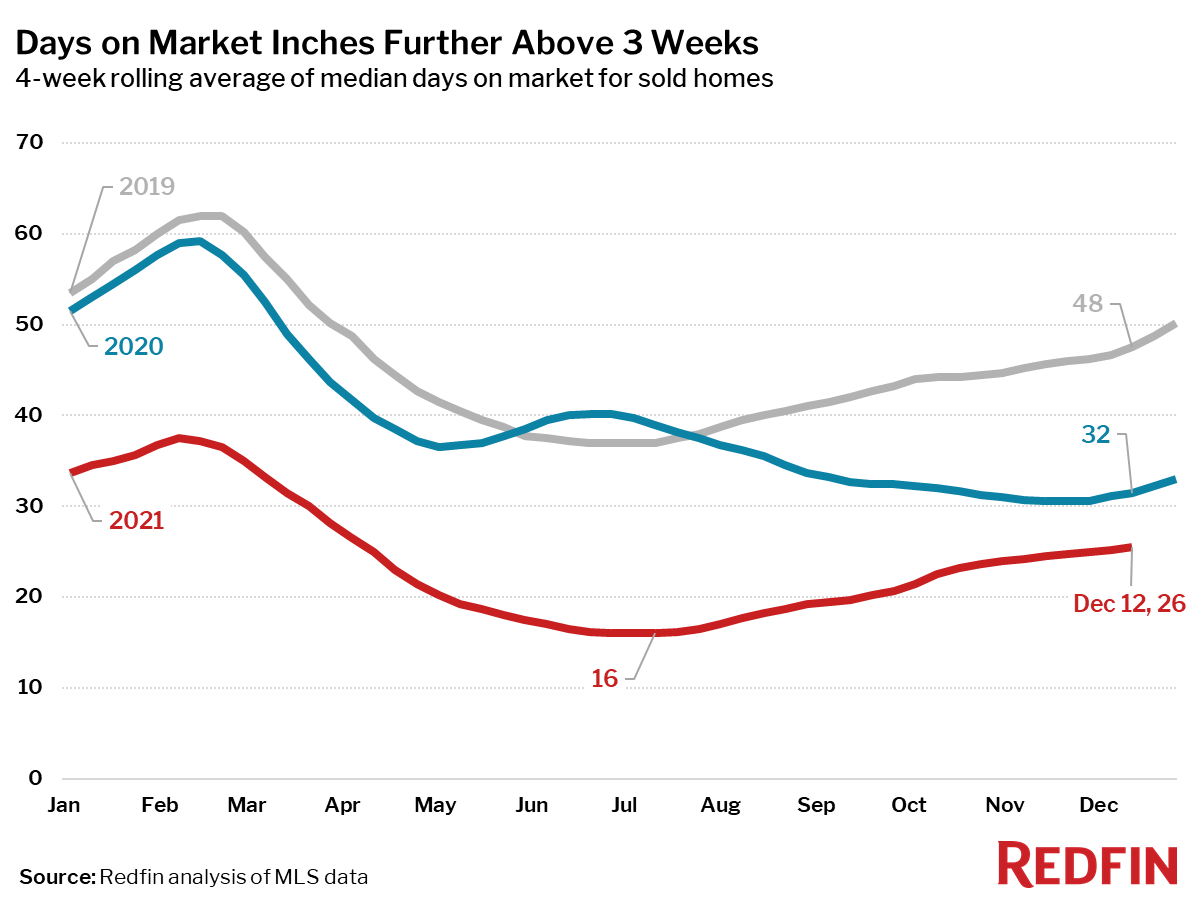
- Homes that sold were on the market for a median of 26 days, down from 32 days a year earlier and 48 days in 2019.
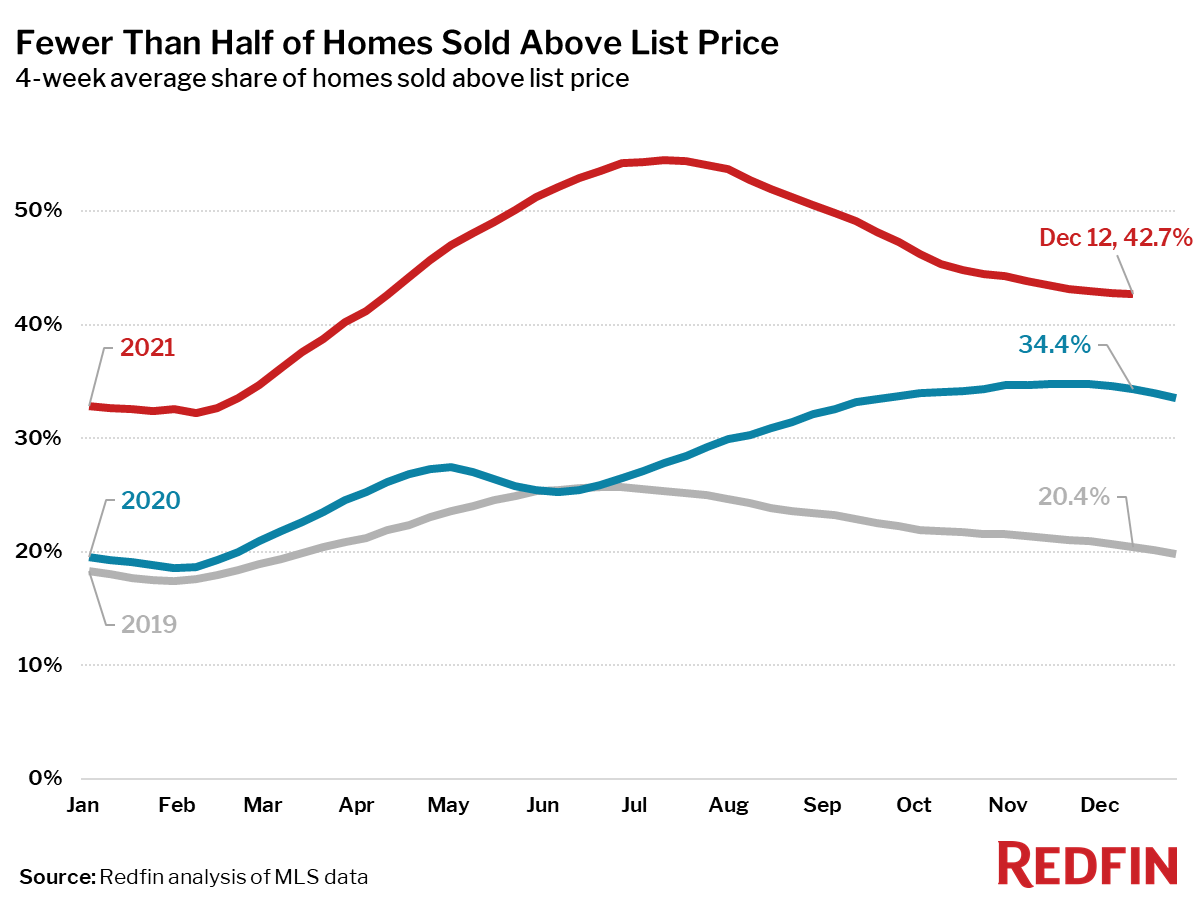
- 43% of homes sold above list price, up from 34% a year earlier and 20% in 2019.
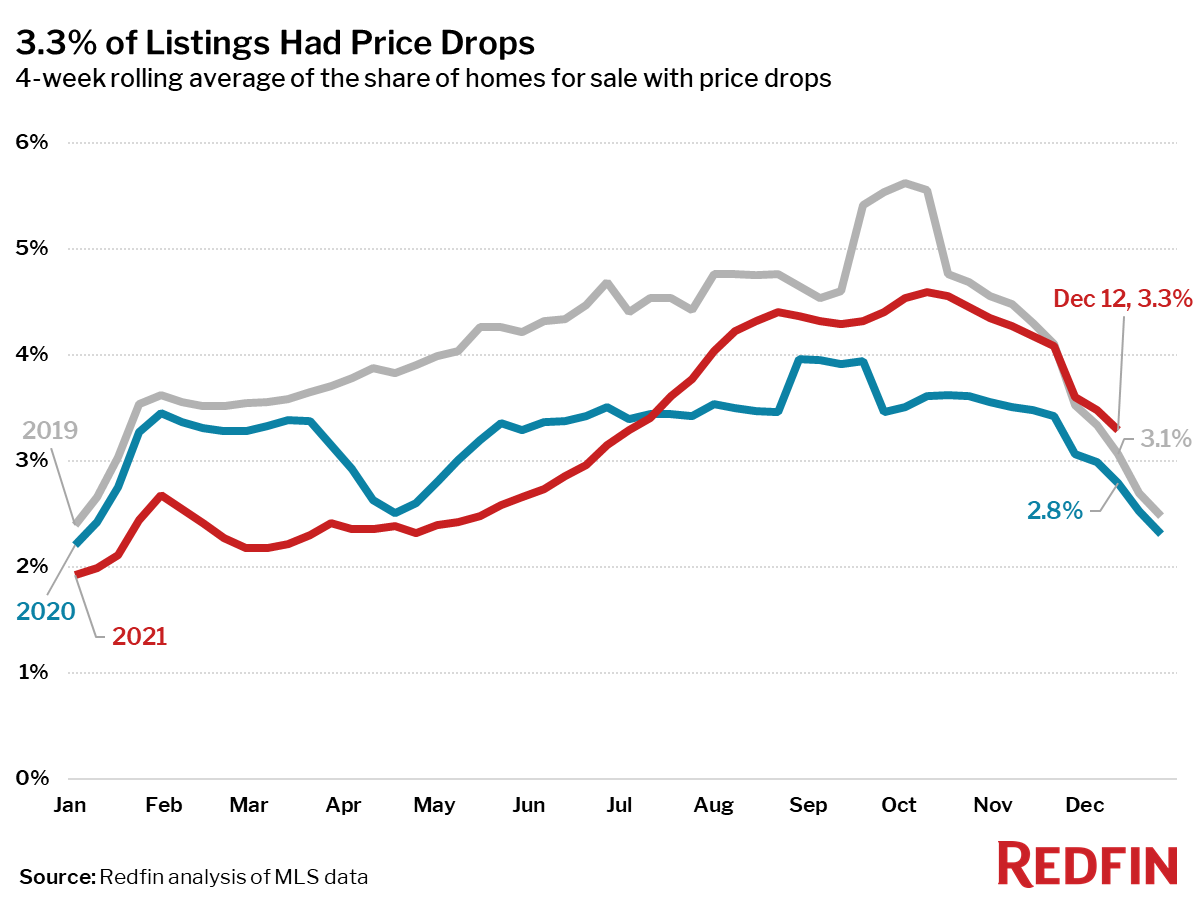
- On average, 3.3% of homes for sale each week had a price drop, up 0.5 percentage points from the same time in 2020 and up 0.2 points from this time in 2019.
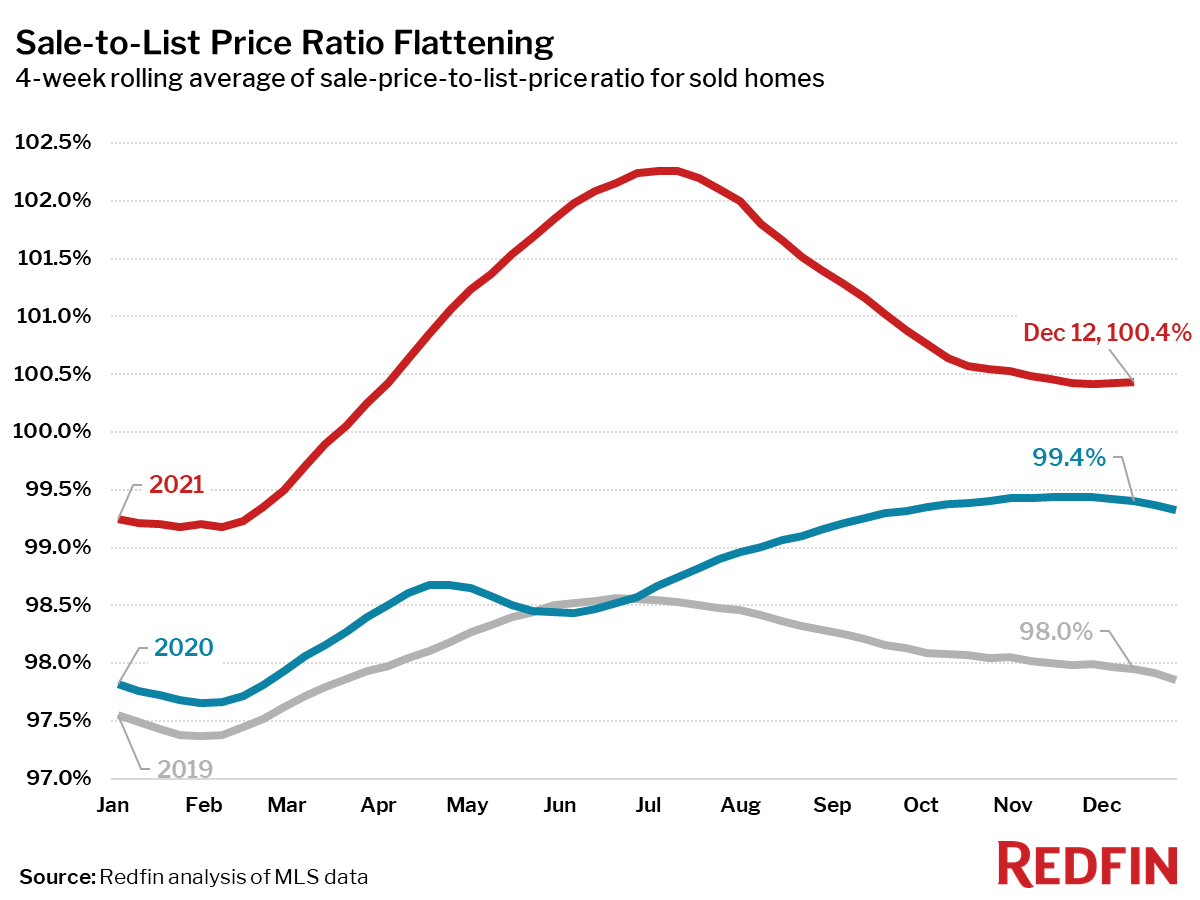
- The average sale-to-list price ratio, which measures how close homes are selling to their asking prices, was 100.4%. In other words, the average home sold for 0.4% above its asking price.
Other leading indicators of homebuying activity:
- Mortgage purchase applications increased 1% week over week (seasonally adjusted) during the week ending December 10. For the week ending December 9, 30-year mortgage rates were flat at 3.1%.
- Touring activity through December 12 was 2 percentage points behind 2019 relative to the first week of January according to home tour technology company ShowingTime.
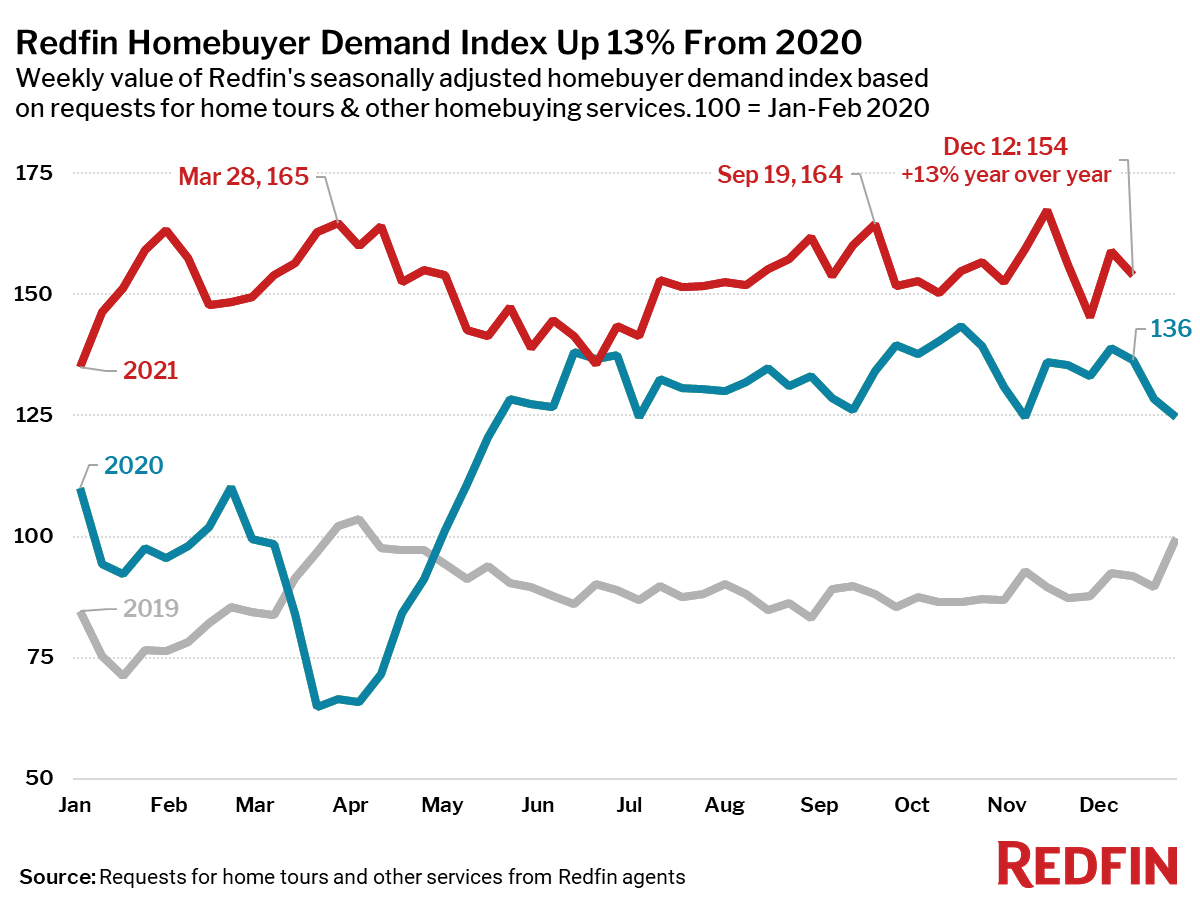
- The Redfin Homebuyer Demand Index fell 3% during the week ending December 12 and was up 13% from a year earlier. The seasonally adjusted Redfin Homebuyer Demand Index is a measure of requests for home tours and other home-buying services from Redfin agents.
Refer to our metrics definition page for explanations of all the metrics used in this report.