Listing consults with Redfin agents have risen significantly since rates began to fall last month. Our economists expect buyers will take advantage of lower rates and more listings in the new year, after the typical holiday slowdown.
This week’s falling mortgage rates, sizable year-over-year increases in both new listings and listing consults with Redfin agents, and surge in housing starts all suggest that 2023’s frozen housing market is thawing. Sales are likely to climb after the typical holiday lull.
Monthly mortgage payments are dropping. Daily average mortgage rates dropped to 6.64% this week, their lowest level since May and down from a two-decade high of 8% in late October. The median U.S. monthly mortgage payment was $2,472 during the four weeks ending December 17, down $264 from the October peak but up 11% year over year. Rates declined quickly last week because the Fed shifted its tone, signaling more interest-rate cuts sooner than expected as the latest data points to a soft landing for the economy.
There are more homes to choose from. Redfin has seen a double-digit annual increase this week in homeowners contacting its real estate agents for help selling their homes, and new listings are up 9% from a year ago–the biggest annual increase since July 2021. The uptick is partly due to falling rates, with homeowners feeling less locked in by rates in the 3% to 4% range.
Mortgage applications are up from their low point, but home sales are still falling. Mortgage-purchase applications are up 18% from their early-November low point. But that early-stage demand hasn’t yet translated into homebuying contracts: Pending home sales are down 7% year over year, similar to declines we’ve seen over the last few months, but it’s worth noting that the holidays are typically a slow season for the housing market. “The last week of economic news and data makes it more likely than not that mortgage rates have peaked,” said Redfin Economic Research Lead Chen Zhao. “Buyers will return from the holidays with more homes to choose from, and they should still see rates in the mid-6% range. But because the Fed is erring on the side of caution, there’s still a chance that rates could go back up.”
Anecdotally, dropping rates are piquing buyers’ interest. Although sales aren’t yet improving, Redfin agents and mortgage brokers are reporting that buyers are starting to act on lower rates:
- “I’m seeing an uptick in applications, an uptick in clients who had disappeared reaching back out, and an uptick in refinances.” –Mona Edick, manager at Bay Equity Home Loans, a Redfin company
- “The recent dip in rates is bringing optimism to buyers, but that’s up against a normal seasonal slowdown here in the New England market. One example of the impact of falling rates: I just put a small condo that was originally listed in early November back on the market. It attracted much more attention this time, and my seller just accepted an offer.” –Scott Driscoll, Redfin Premier agent in the Boston area
- “Buyers are excited about falling rates. Inventory in Seattle is still low right now–and not due to increase until the new year–so there’s not much for buyers to tour right now, but they’re raring to go.” –Shoshana Godwin, Redfin Premier agent in Seattle
Leading indicators
| Indicators of homebuying demand and activity | ||||
| Value (if applicable) | Recent change | Year-over-year change | Source | |
| Daily average 30-year fixed mortgage rate | 6.64% (Dec. 20) | Lowest level since May | Up from 6.31% | Mortgage News Daily |
| Weekly average 30-year fixed mortgage rate | 6.95% (week ending Dec. 14) | Lowest level since August. Down from two-decade high of 7.79% two months earlier | Up from 6.33% | Freddie Mac |
| Mortgage-purchase applications (seasonally adjusted) | Down 1% from a week earlier (as of week ending Dec. 15) | Down 18% | Mortgage Bankers Association | |
| Redfin Homebuyer Demand Index (seasonally adjusted) | Up 5% from a month earlier (as of the week ending Dec. 17) | Down 7% | Redfin Homebuyer Demand Index, a measure of requests for tours and other homebuying services from Redfin agents | |
| Google searches for “home for sale” | Down 7% from a month earlier (as of Dec. 16) | Essentially unchanged | Google Trends | |
| Touring activity | Down 38% from the start of the year (as of Dec. 14) | At this time last year, it was down 45% from the start of 2022 | ShowingTime, a home touring technology company | |
Key housing-market data
| U.S. highlights: Four weeks ending December 17, 2023
Redfin’s national metrics include data from 400+ U.S. metro areas, and is based on homes listed and/or sold during the period. Weekly housing-market data goes back through 2015. Subject to revision. |
|||
| Four weeks ending December 17, 2023 | Year-over-year change | Notes | |
| Median sale price | $363,628 | 4.2% | Biggest increase since Oct. 2022. Prices are up partly because rapidly rising mortgage rates were hampering prices during this time last year |
| Median asking price | $366,019 | 5.5% | |
| Median monthly mortgage payment | $2,472 at a 6.95% mortgage rate | 11.4% | Down $264 (-10%) from all-time high set during the four weeks ending Oct. 22. Lowest level since April. |
| Pending sales | 56,405 | -7% | |
| New listings | 53,936 | 9.4% | Biggest uptick since July 2021. The increase is partly because new listings were falling at this time last year. |
| Active listings | 830,914 | -4.5% | Smallest decline since June. |
| Months of supply | 4 months | +0.2 pts. | 4 to 5 months of supply is considered balanced, with a lower number indicating seller’s market conditions. |
| Share of homes off market in two weeks | 28.5% | Up from 26% | |
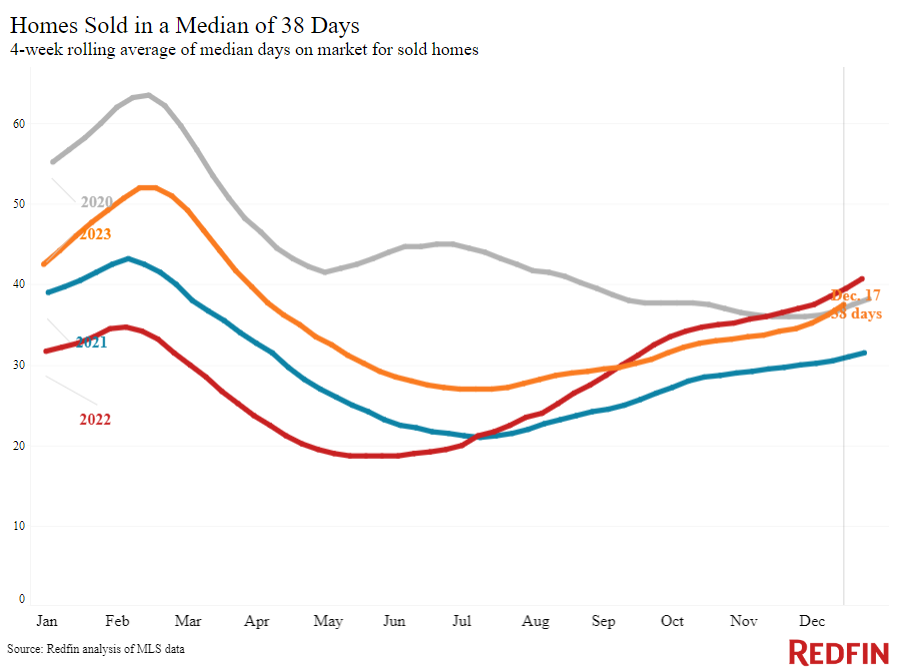
| Median days on market | 38 | -2 days | |
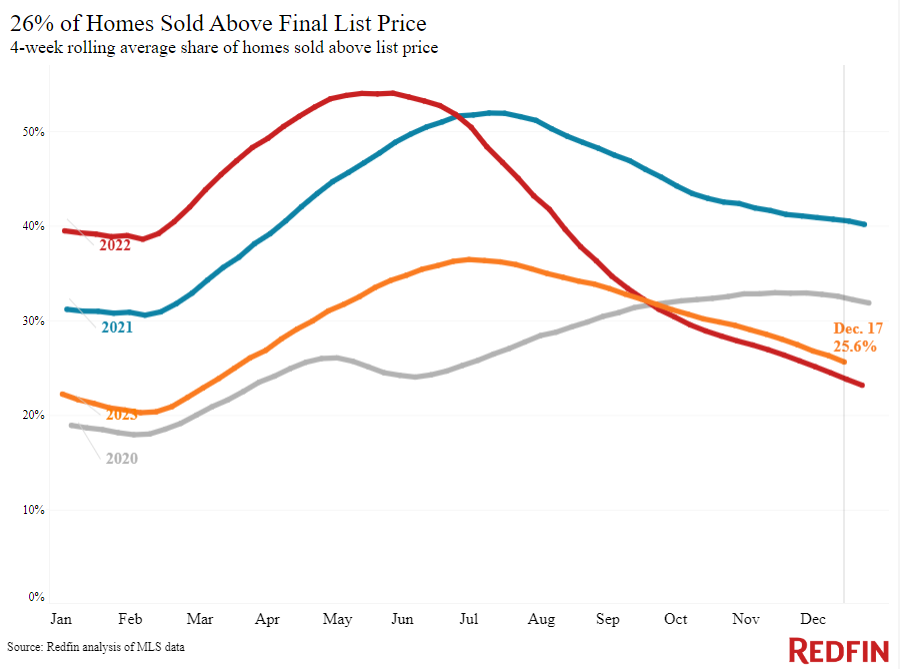
| Share of homes sold above list price | 25.6% | Up from 24% | |
| Share of homes with a price drop | 5.1% | +0.7 pts. | |
| Average sale-to-list price ratio | 98.6% | +0.5 pts. | |
| Metro-level highlights: Four weeks ending December 17, 2023
Redfin’s metro-level data includes the 50 most populous U.S. metros. Select metros may be excluded from time to time to ensure data accuracy. |
|||
| Metros with biggest year-over-year increases | Metros with biggest year-over-year decreases | Notes | |
| Median sale price | Anaheim, CA (16.1%)
Newark, NJ (15%) Fort Lauderdale, FL (12.5%) Miami (11.8%) Nassau County, NY (11%) |
Austin, TX (-4.5%)
San Antonio, TX (-3%) Houston (-1.2%) Fort Worth, TX (-0.2%) |
Declined in 4 metros |
| Pending sales | Milwaukee (5.8%)
Philadelphia (5.1%) Dallas (2.5%) Austin, TX (2.2%) Detroit (1.7%) |
Providence, RI (-17.6%)
Jacksonville, FL (-17.4%) Newark, NJ (-14.4%) New Brunswick, NJ (-12.4%) Oakland, CA (-12.2%) |
Increased in 8 metros |
| New listings | Phoenix (25.3%)
Orlando, FL (23.1%) Miami (21.4%) San Antonio, TX (20%) Montgomery County, PA (17.3%) |
San Francisco (-28.6%)
Atlanta (-13.9%) Indianapolis, IN (-11.1%) Virginia Beach, VA (-5.4%) Oakland, CA (-5.1%) |
Declined in 11 metros |
Refer to our metrics definition page for explanations of all the metrics used in this report.