Redfin’s Homebuyer Demand Index fell for the first time since June, and the share of home sellers dropping their asking price was the highest in five months.
Homebuyer demand softened further over the last several weeks as a typical slump in buying and selling over Easter and Passover weekend amplified a recent slowdown triggered by surging mortgage rates and housing costs.
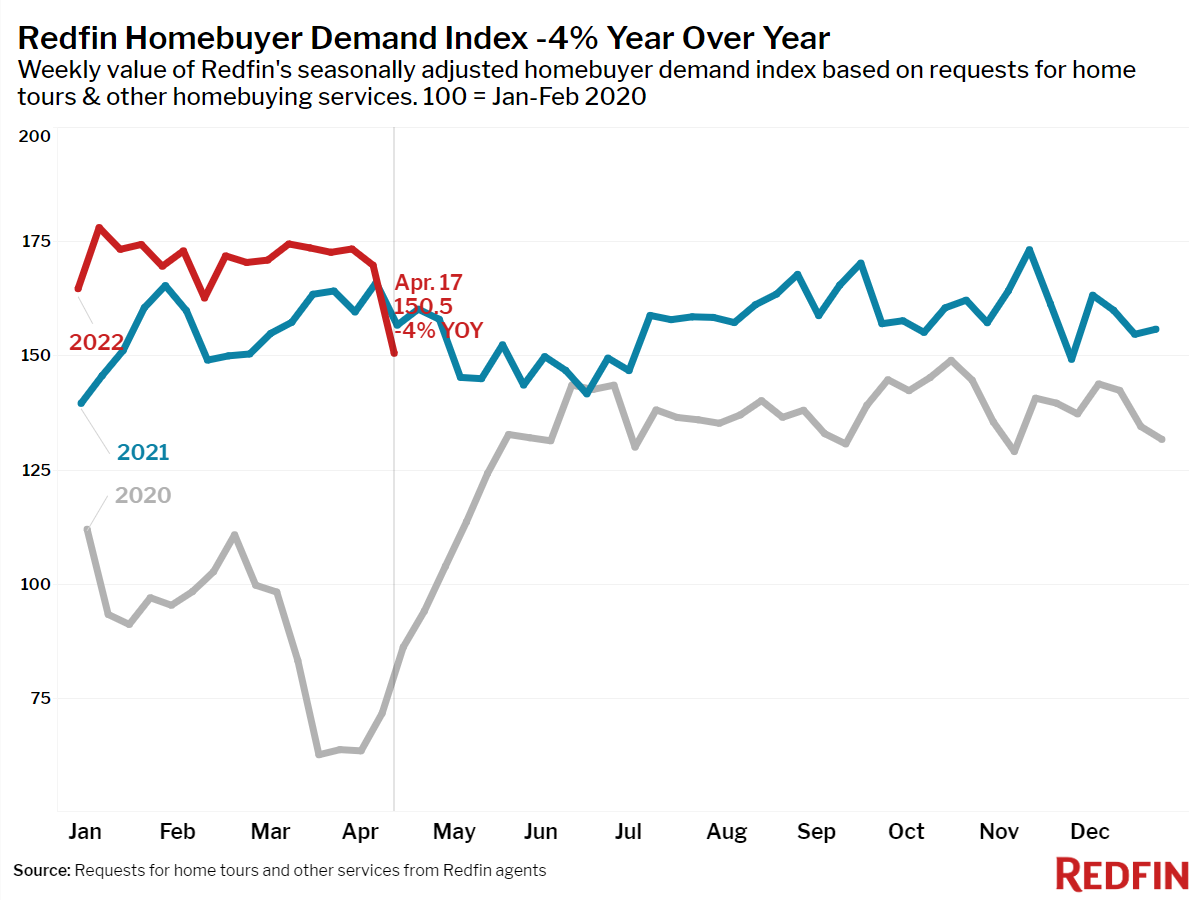
Roughly 1 in 8 sellers cut their list prices during the four weeks ending April 17—the highest share in five months—and asking prices declined slightly from the previous four-week period. Redfin’s Homebuyer Demand Index—a measure of requests for home tours and other home-buying services from Redfin agents—fell 4% year over year during the holiday week in its first drop since June. Mortgage applications and online searches for “homes for sale” also slumped.
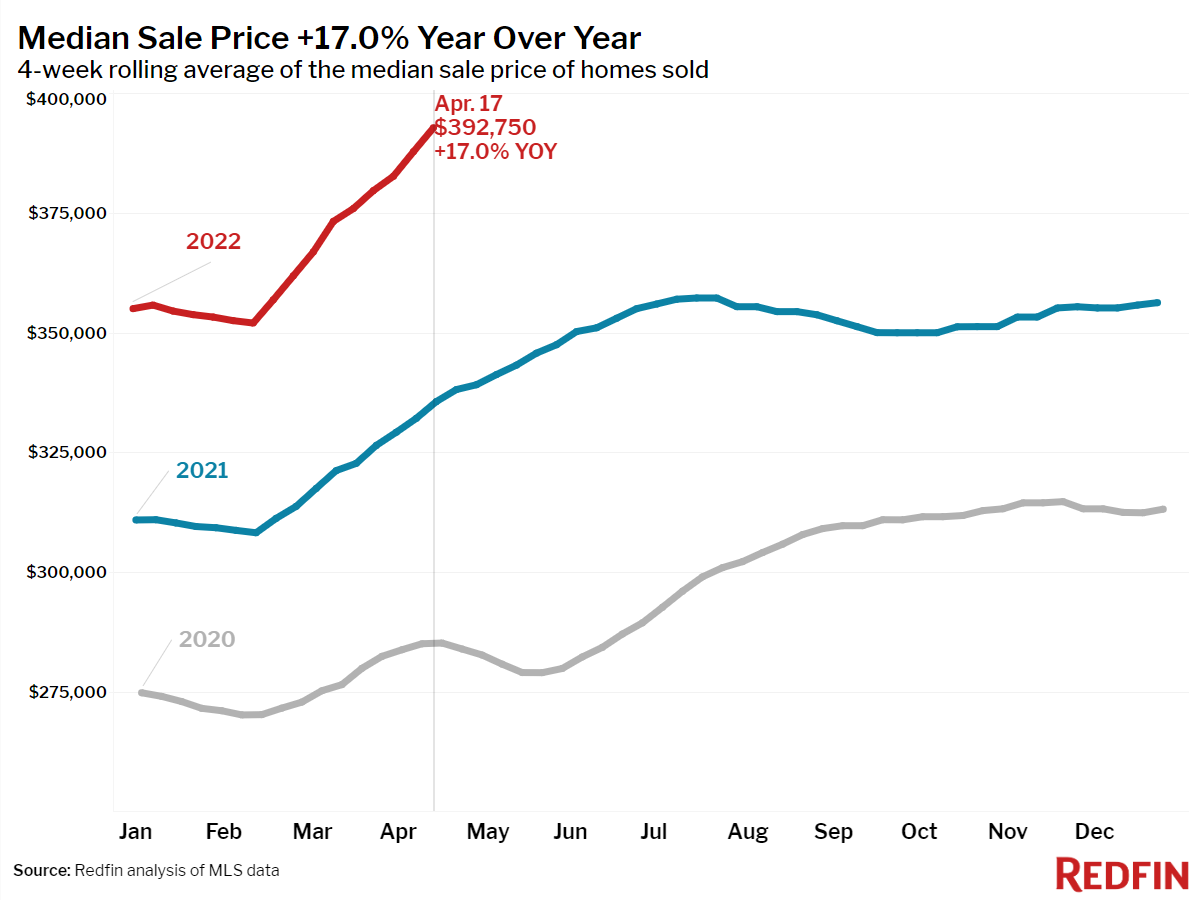
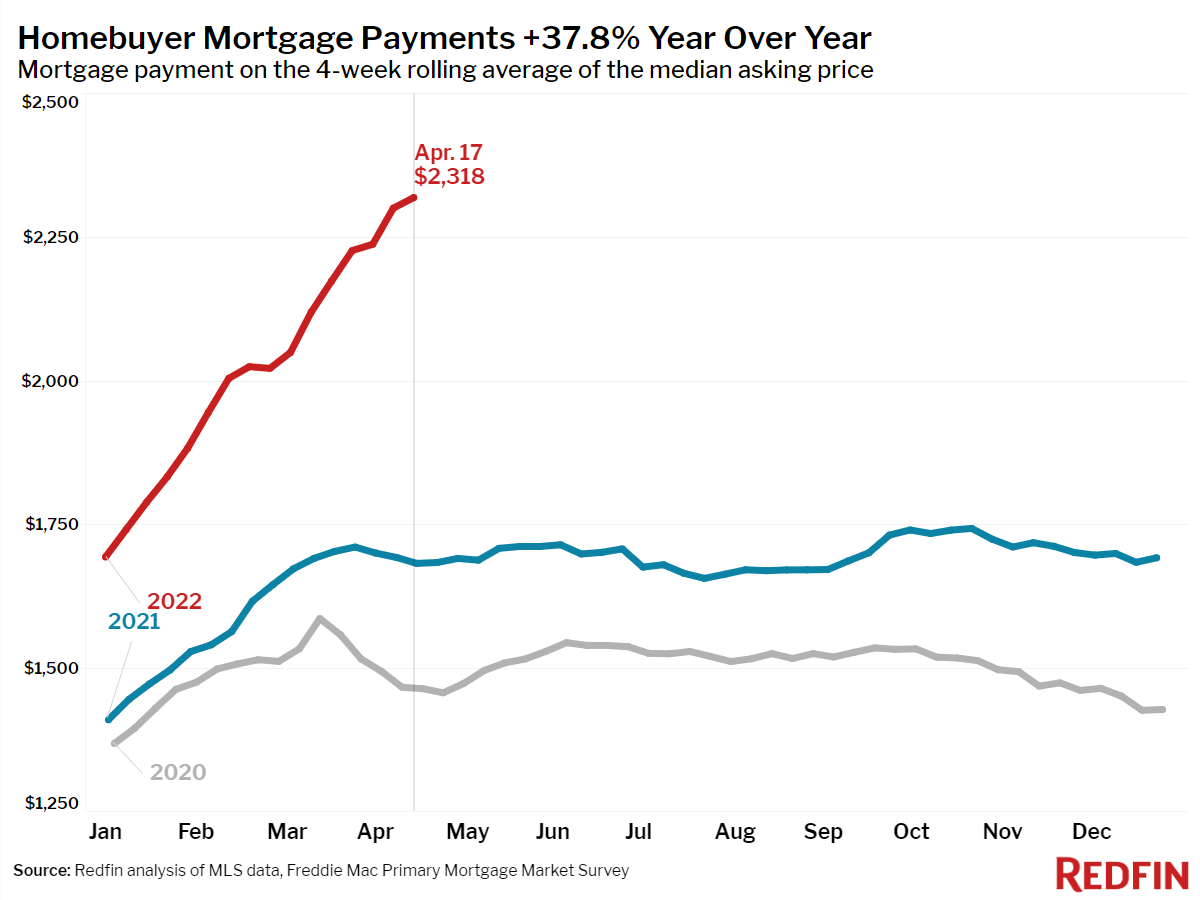
More buyers have moved to the sidelines as home prices have hit historic highs and mortgage rates have jumped past 5%. The median home-sale price is up 17% year over year to a record $392,750 and mortgage rates are now at the highest level since April 2010, sending the typical homebuyer’s monthly payment up 38% to an all-time high of $2,318. Still, some measures of competition, including the share of homes selling above list price and the share selling in one week, continue to hit new records.
“The lull in homebuying and selling activity that we saw over Easter and Passover is likely to continue well past the holiday weekend,” said Redfin Chief Economist Daryl Fairweather. “The forces causing many homebuyers to pump the brakes are still in place—increasing mortgage rates and record-high home prices. We expect price increases to slow and buyers in bidding wars to face fewer competing offers, but substantial relief for homebuyers is unfortunately still well beyond the horizon since the housing market is still tilted further in sellers’ favor than at any time in history.”
Leading indicators of homebuying activity:
Most metrics in this section measure a one-week period that includes Easter and Passover. Year-over-year declines are amplified due to the fact that the same period one year earlier was a non-holiday week.
- Fewer people searched for “homes for sale” on Google—searches during the week ending April 16 were down 8% from a year earlier.
- The seasonally-adjusted Redfin Homebuyer Demand Index—a measure of requests for home tours and other home-buying services from Redfin agents—fell 4% year over year during the week ending April 17—the first annual decline since June. It dropped 13% in the past four weeks alone, compared with a 4% decrease during the same period a year earlier.
- Touring activity from the first week of January through April 10 was 45 percentage points behind the same period in 2021, according to home tour technology company ShowingTime.
- Mortgage purchase applications were down 14% from a year earlier, while the seasonally-adjusted index decreased 3% week over week during the week ending April 15.
- For the week ending April 21, 30-year mortgage rates rose to 5.11%—the highest level since April 2010. This was up from 5% the prior week.
While sellers still have the upper hand, buyers are beginning to wield a bit more power, according to Redfin Los Angeles real estate agent Heidi Ludwig.
“Buyers are becoming more discerning. They’re less willing to overpay because now they’re only facing three or four competitive offers instead of dozens. Sellers may get frustrated if home-price growth starts to slow, but they should still be able to command excellent prices for their home as long as they price appropriately and put the work in to make their home as appealing as possible. This means staging, deep cleaning, a fresh paint job and landscaping—things that were not as necessary when the market was white-hot.”
Key housing market takeaways for 400+ U.S. metro areas:
Unless otherwise noted, the data in this report covers the four-week period ending April 17. Redfin’s housing market data goes back through 2012.
Data based on homes listed and/or sold during the period:
- The median home sale price was up 17% year over year to a record $392,750—the biggest increase since August.
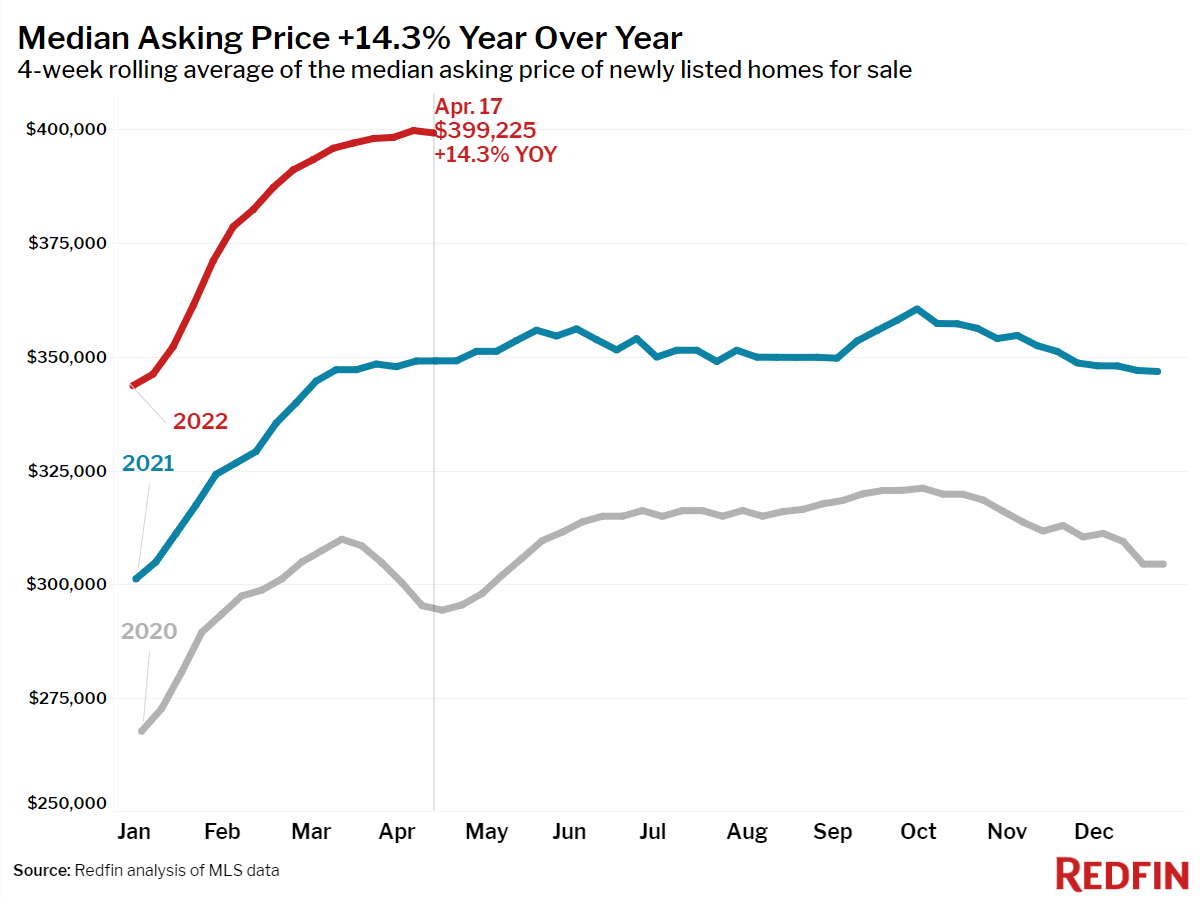
- The median asking price of newly listed homes increased 14% year over year to $399,225, down slightly from the record high set during the four-week period ending April 10.
- The monthly mortgage payment on the median asking price home rose to a record high of $2,318 at the current 5.11% mortgage rate. This was up 38% from a year earlier, when mortgage rates were 2.97%.
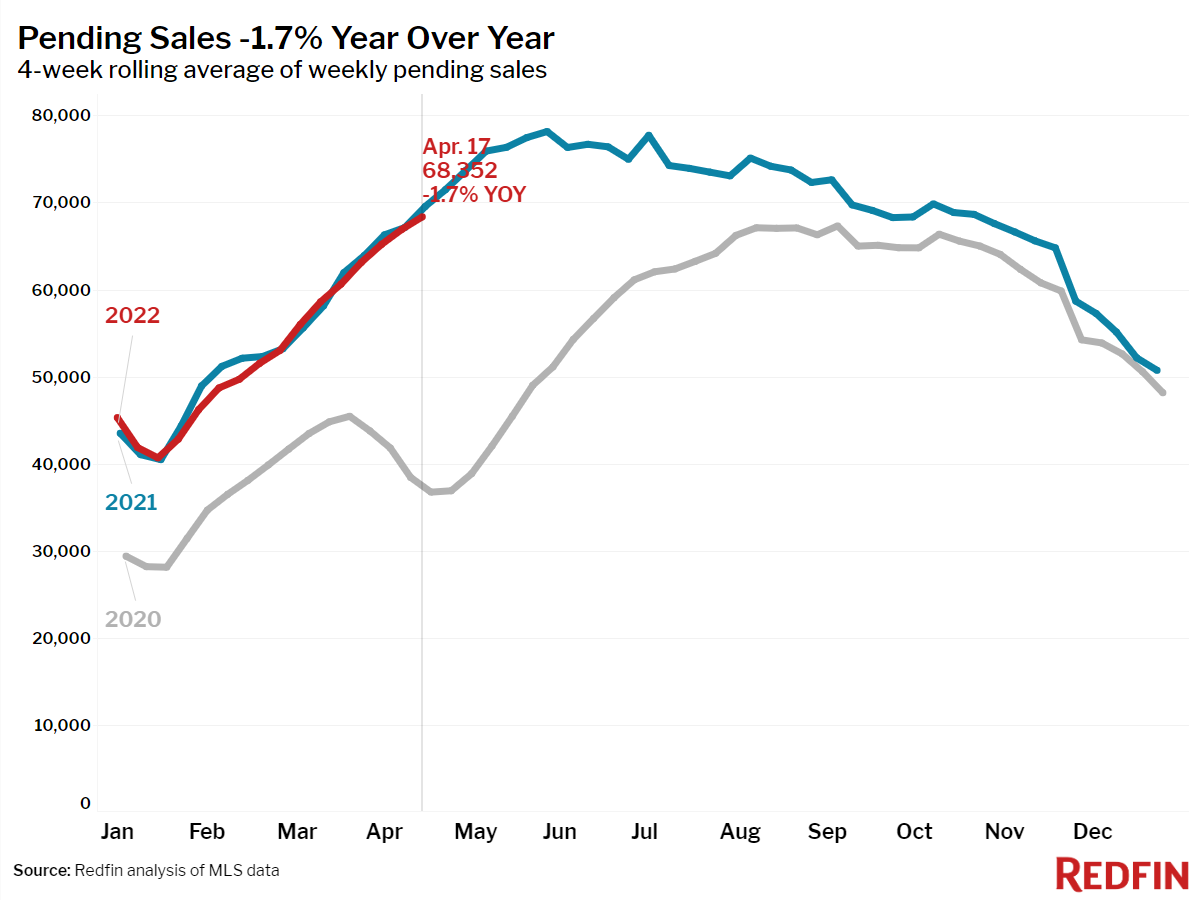
- Pending home sales were down 2% year over year.
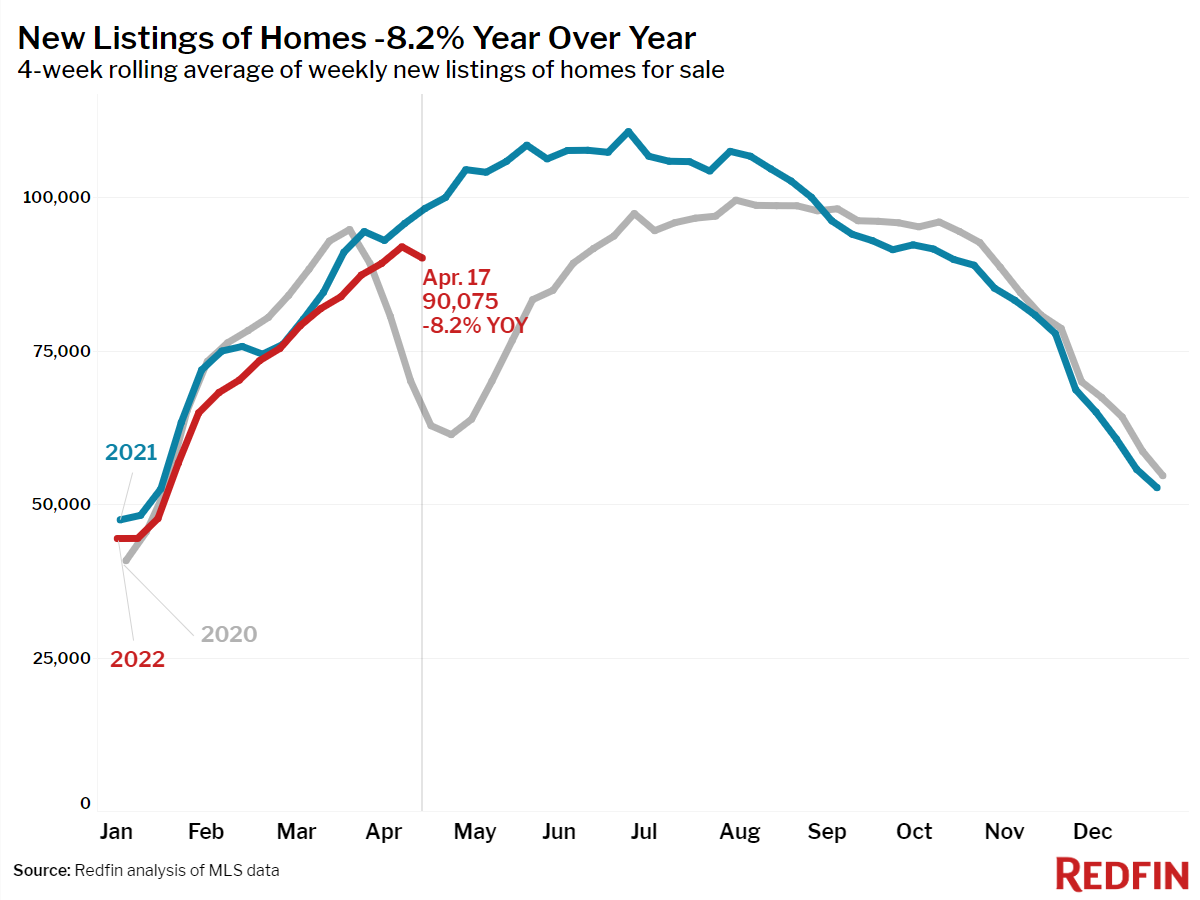
- New listings of homes for sale were down 8% from a year earlier, the 22nd-straight annual decline and the biggest drop since early February.
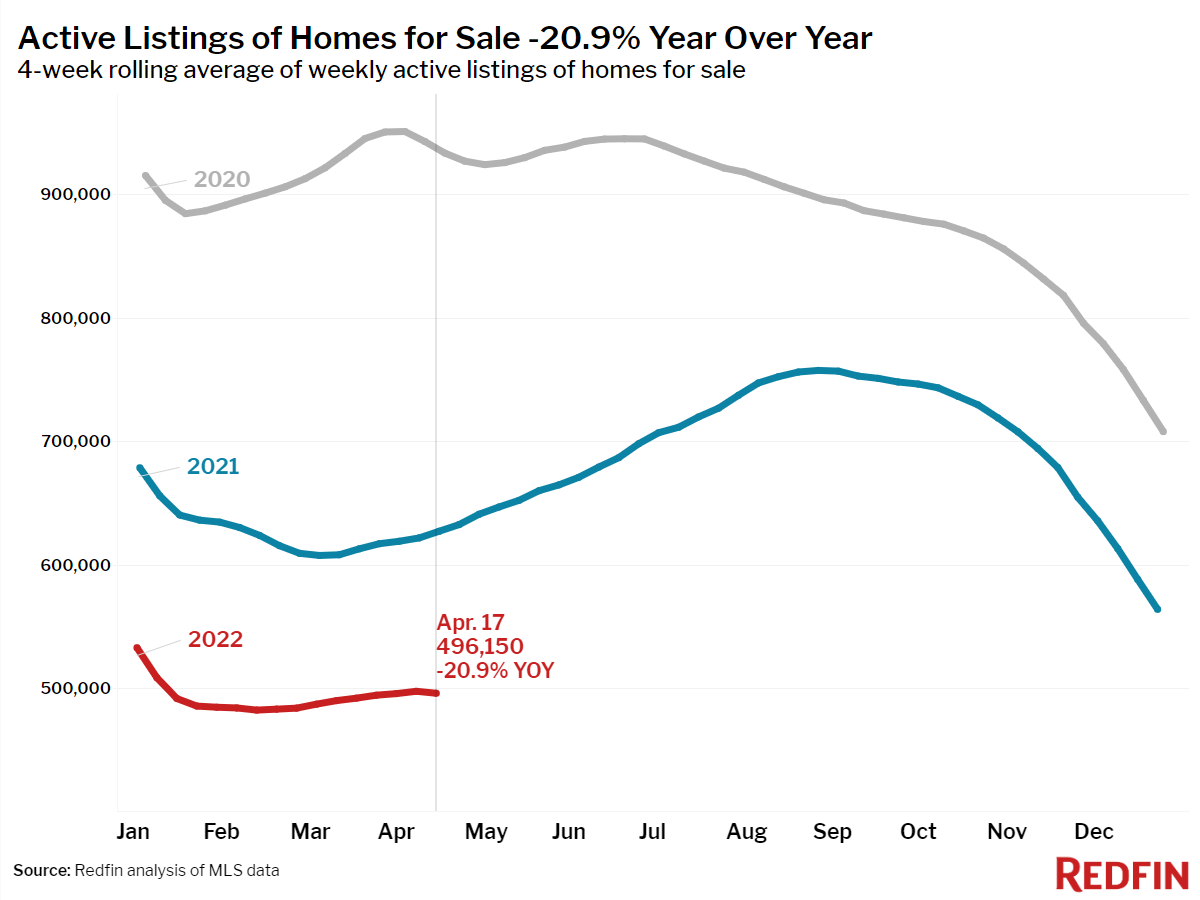
- Active listings (the number of homes listed for sale at any point during the period) fell 21% year over year.
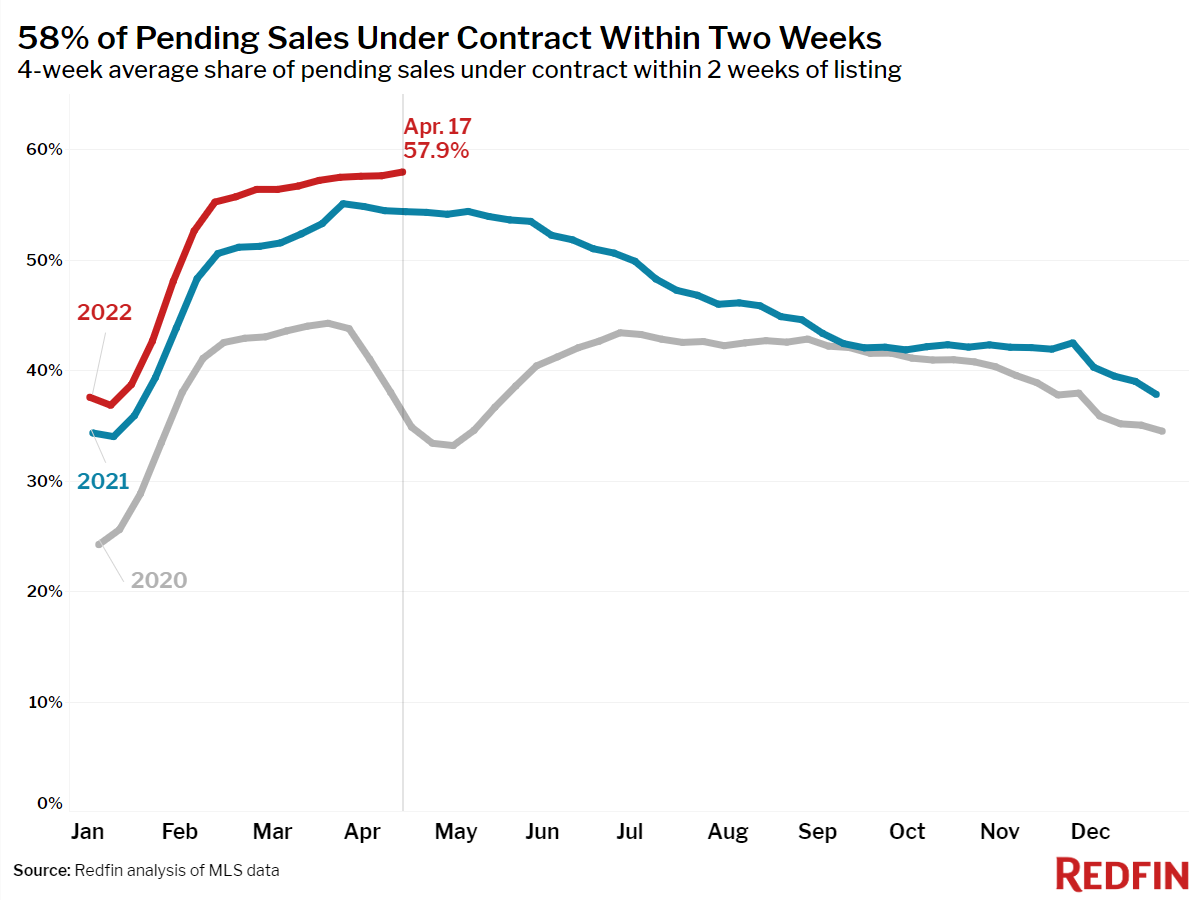
- A record 58% of homes that went under contract had an accepted offer within the first two weeks on the market, up from 54% a year earlier.
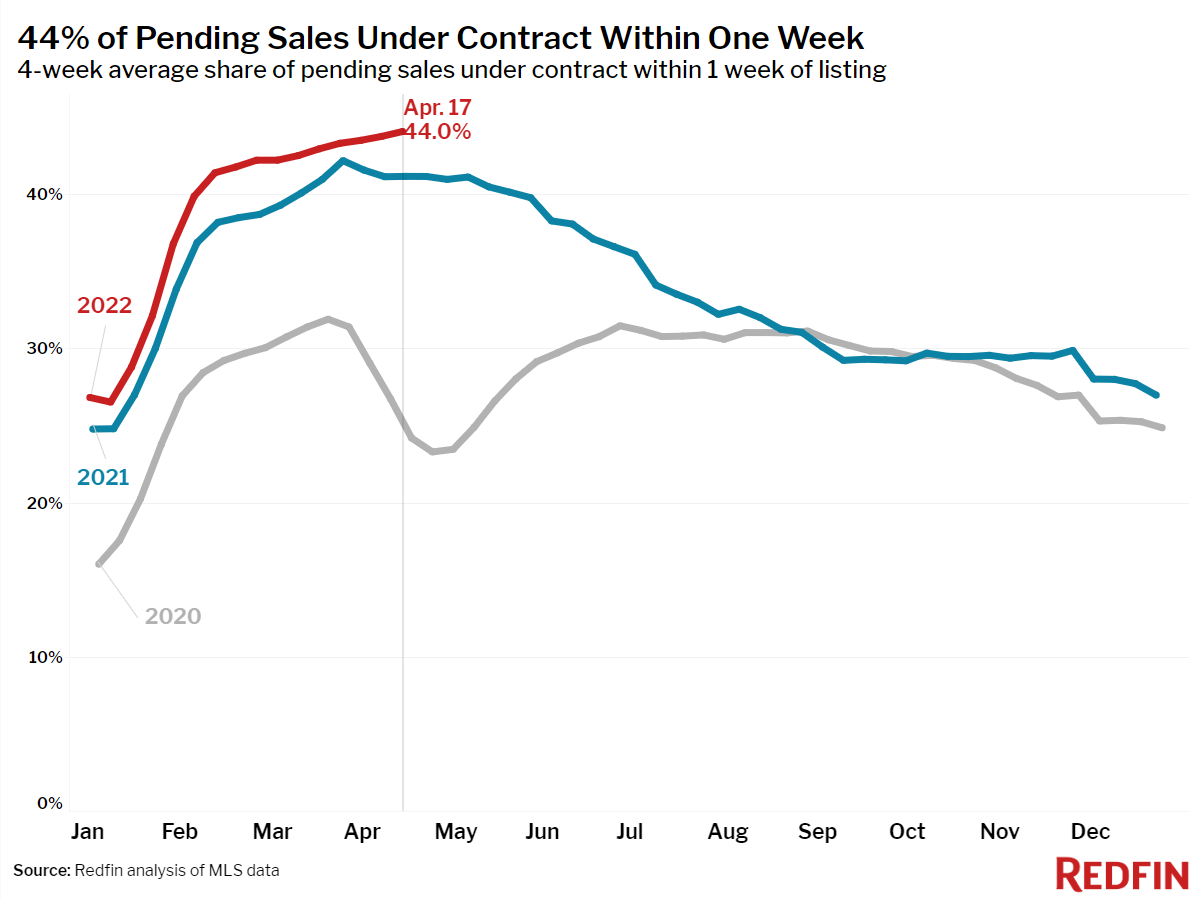
- A record 44% of homes that went under contract had an accepted offer within one week of hitting the market, up from 41% a year earlier.
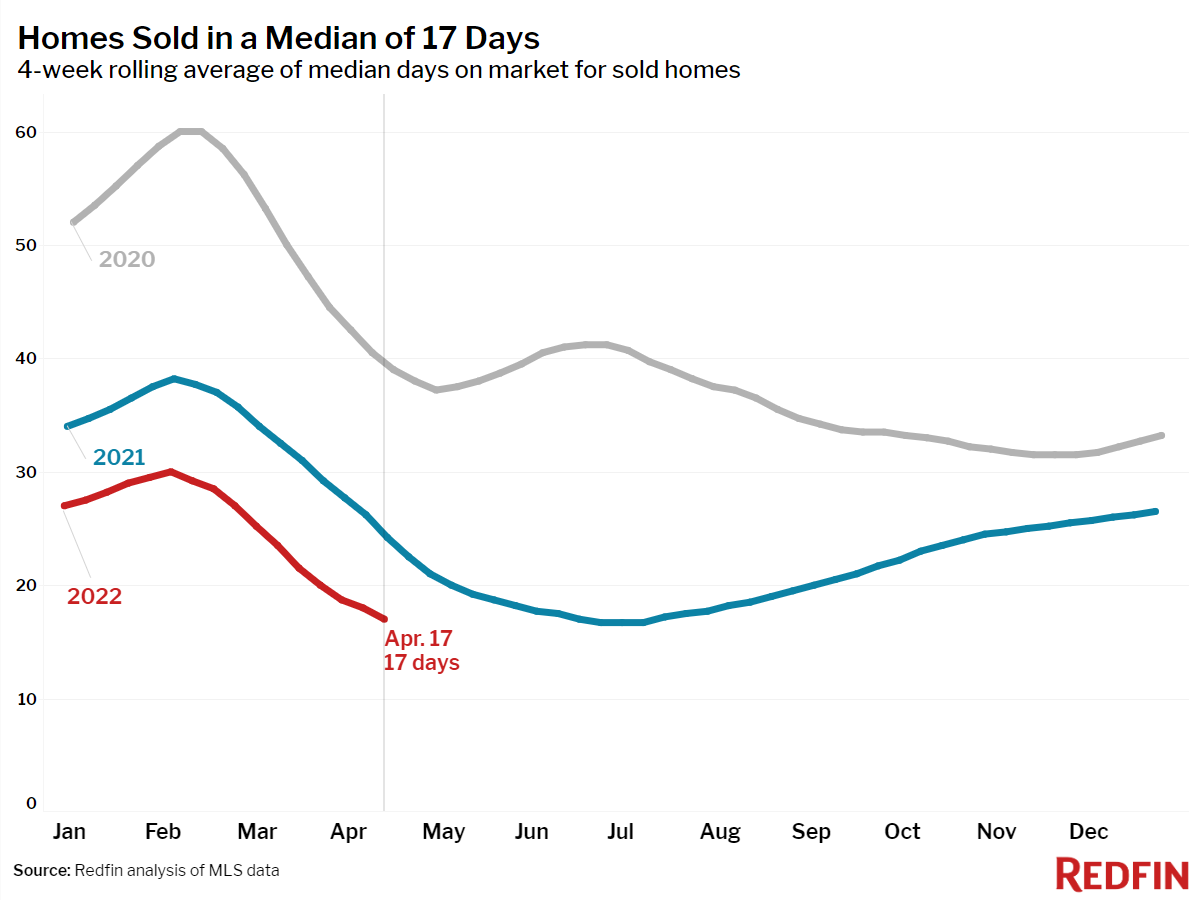
- Homes that sold were on the market for a median of 17 days, down from 24 days a year earlier.
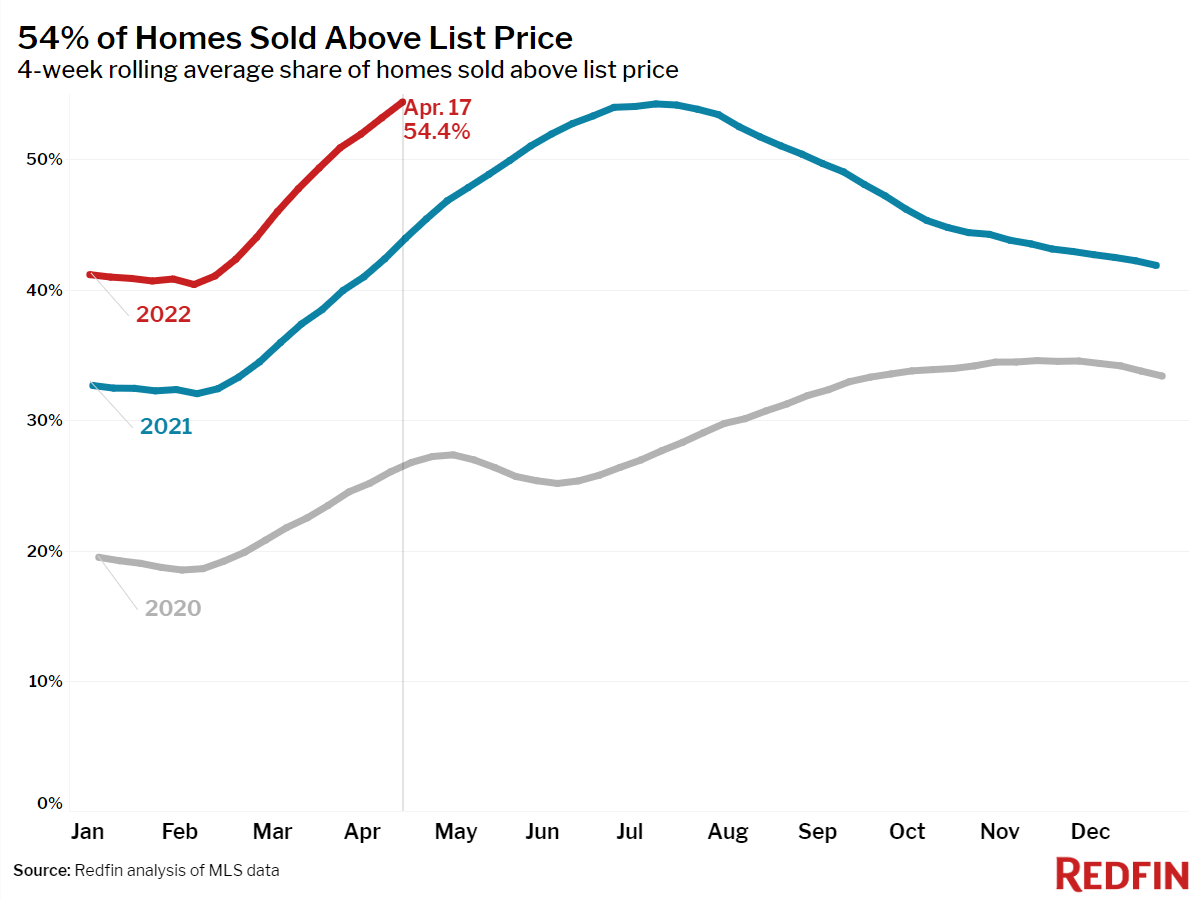
- A record 54% of homes sold above list price, up from 44% a year earlier.
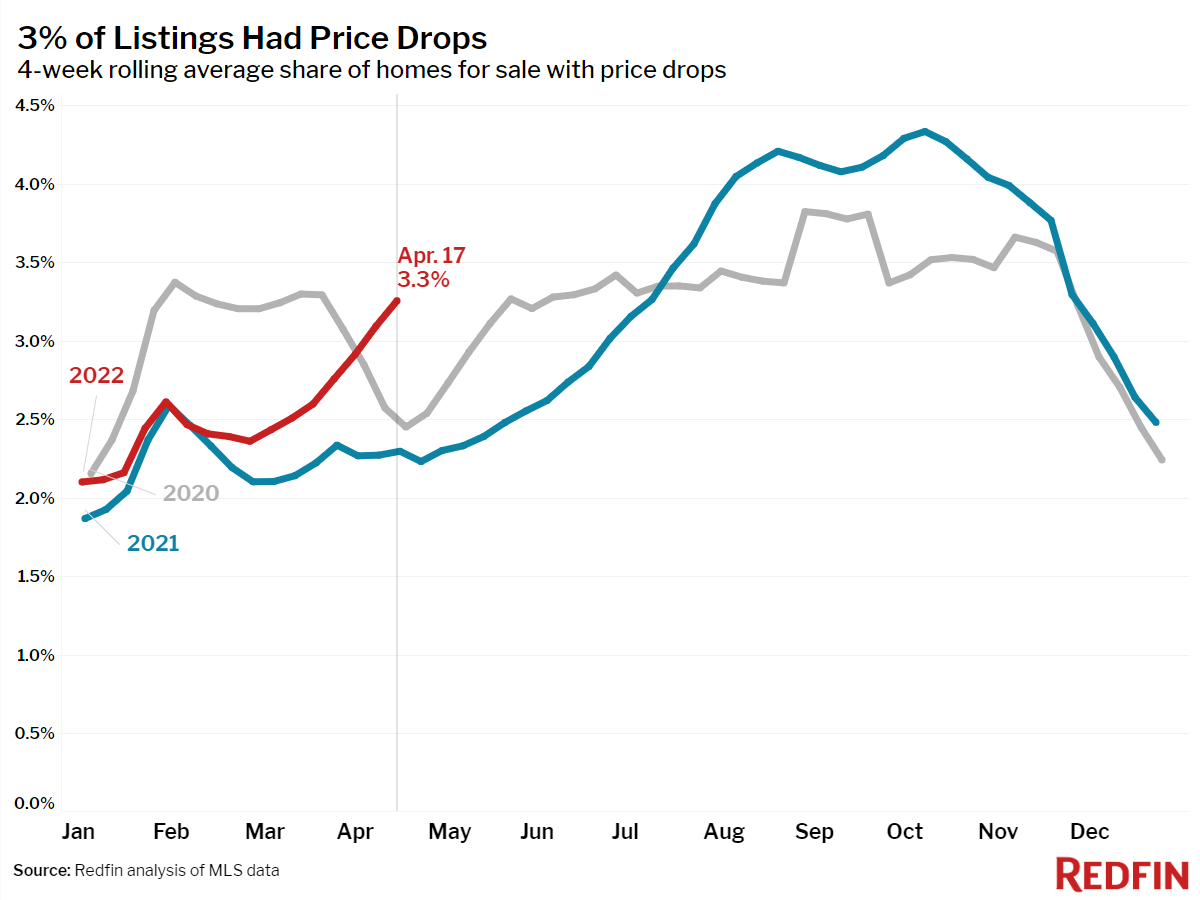
- On average, 3.3% of homes for sale each week had a price drop. Overall, 13% dropped their price in the past four weeks, up from 10% a month earlier and 9% a year ago. This was the highest share since the end of November.
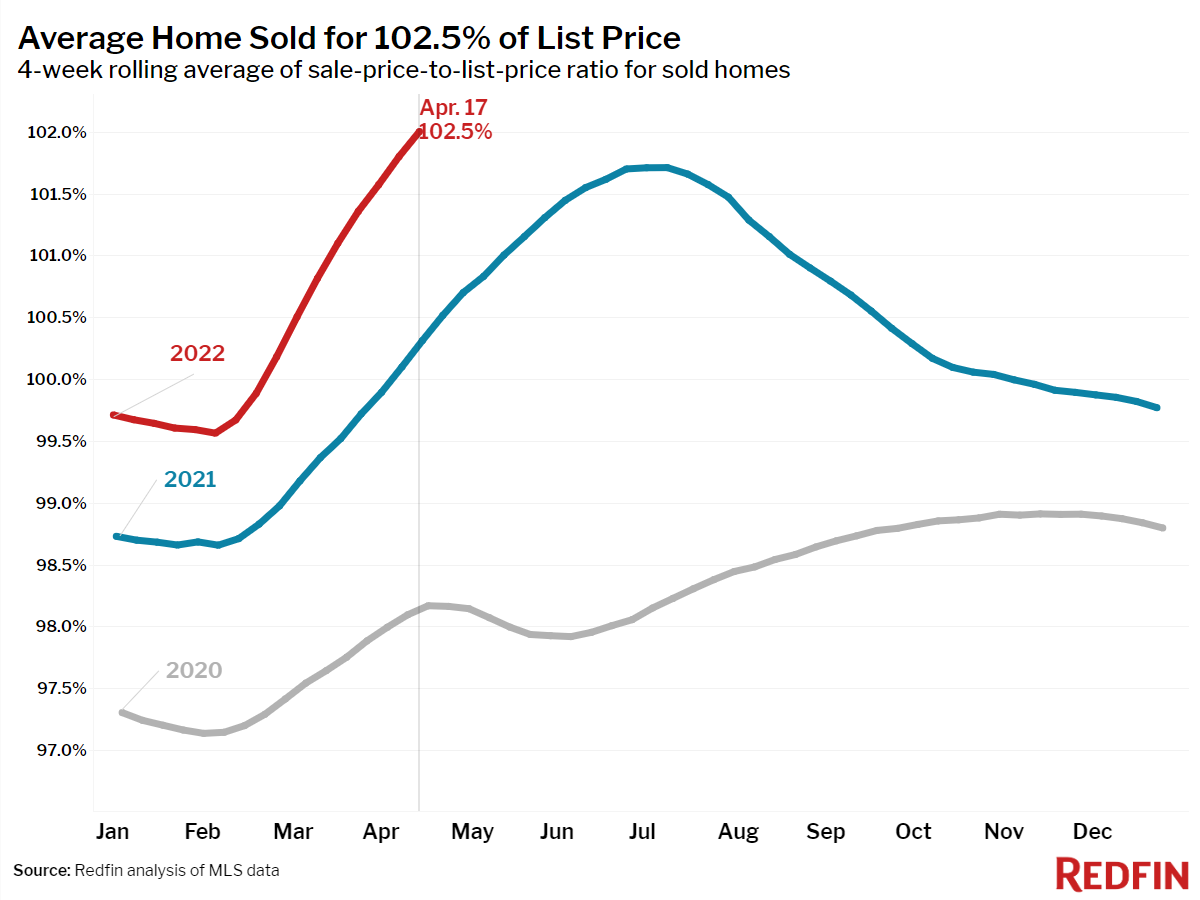
- The average sale-to-list price ratio, which measures how close homes are selling to their asking prices, rose to an all-time high of 102.5%. In other words, the average home sold for 2.5% above its asking price. This was up from 100.8% a year earlier.
Refer to our metrics definition page for explanations of all the metrics used in this report.