Mortgage rates rose above 3% for the first time since June and asking prices set a record high, but homebuyers aren’t slowing down.
The average homebuyer’s monthly mortgage payment rose $50 over the last six weeks as sellers’ median asking price increased 12% year over year to a new record-high and mortgage rates surpassed 3%. Despite rapidly declining affordability, many homes are still selling very quickly—nearly half find a buyer within 2 weeks. Although homes are still selling for about 1% above asking price on average, the share of listings with price drops is increasing, suggesting that price increases may be easing just slightly.
“Mortgage rates and asking prices are both on the rise, which translates to higher housing costs,” said Redfin Chief Economist Daryl Fairweather. “For now, mortgage rates are still hovering near 3% and demand remains strong. However, we are likely to see rates tick up into the winter months, and that could slow demand just like it did in late 2018. As that happens, sellers will have a harder time getting buyers to bite on their sky-high asking prices.”
Key housing market takeaways for 400+ U.S. metro areas:
Unless otherwise noted, the data in this report covers the four-week period ending October 3. Redfin’s housing market data goes back through 2012. Except where indicated otherwise, the housing market is generally experiencing seasonal cooling trends, similar to what was seen during this same period in 2019.
Data based on homes listed and/or sold during the period:
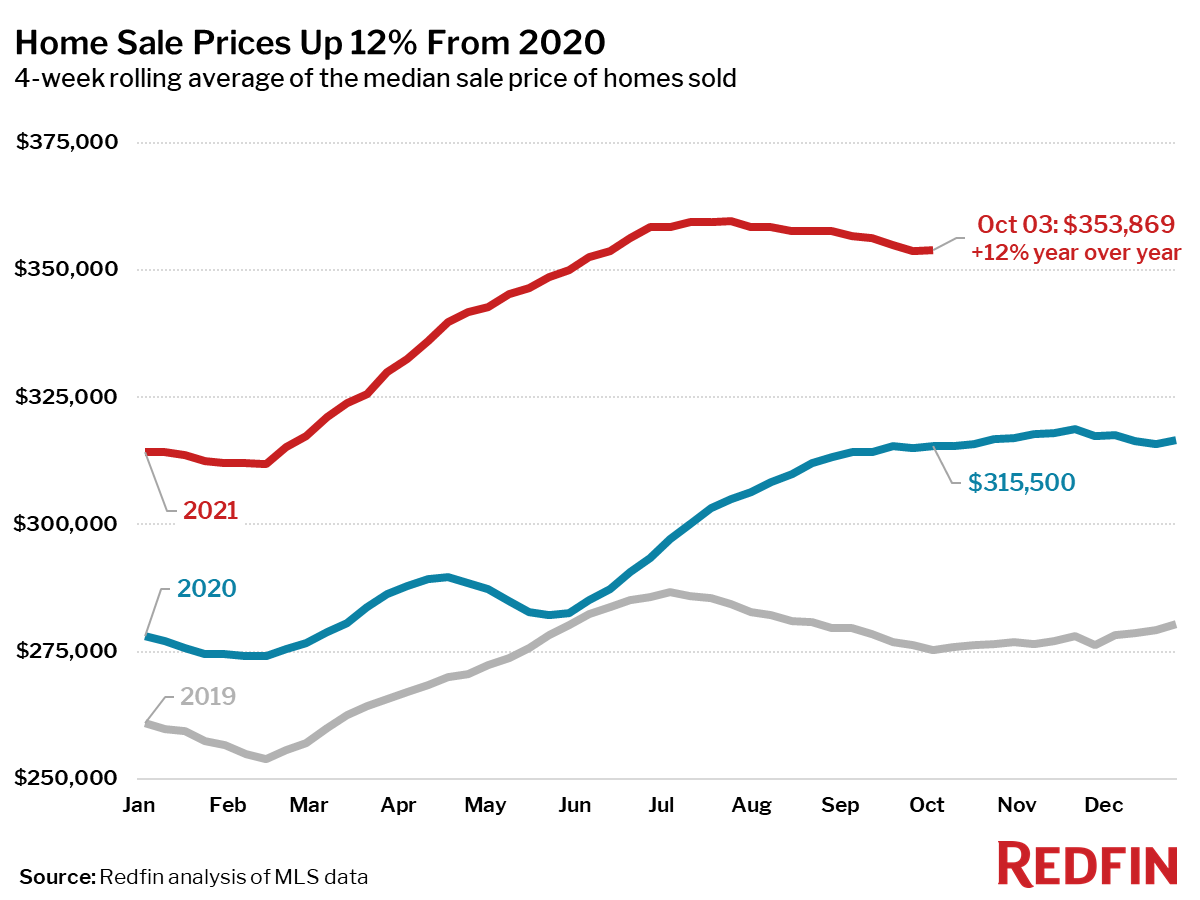
- The median home-sale price increased 12% year over year to $353,869.
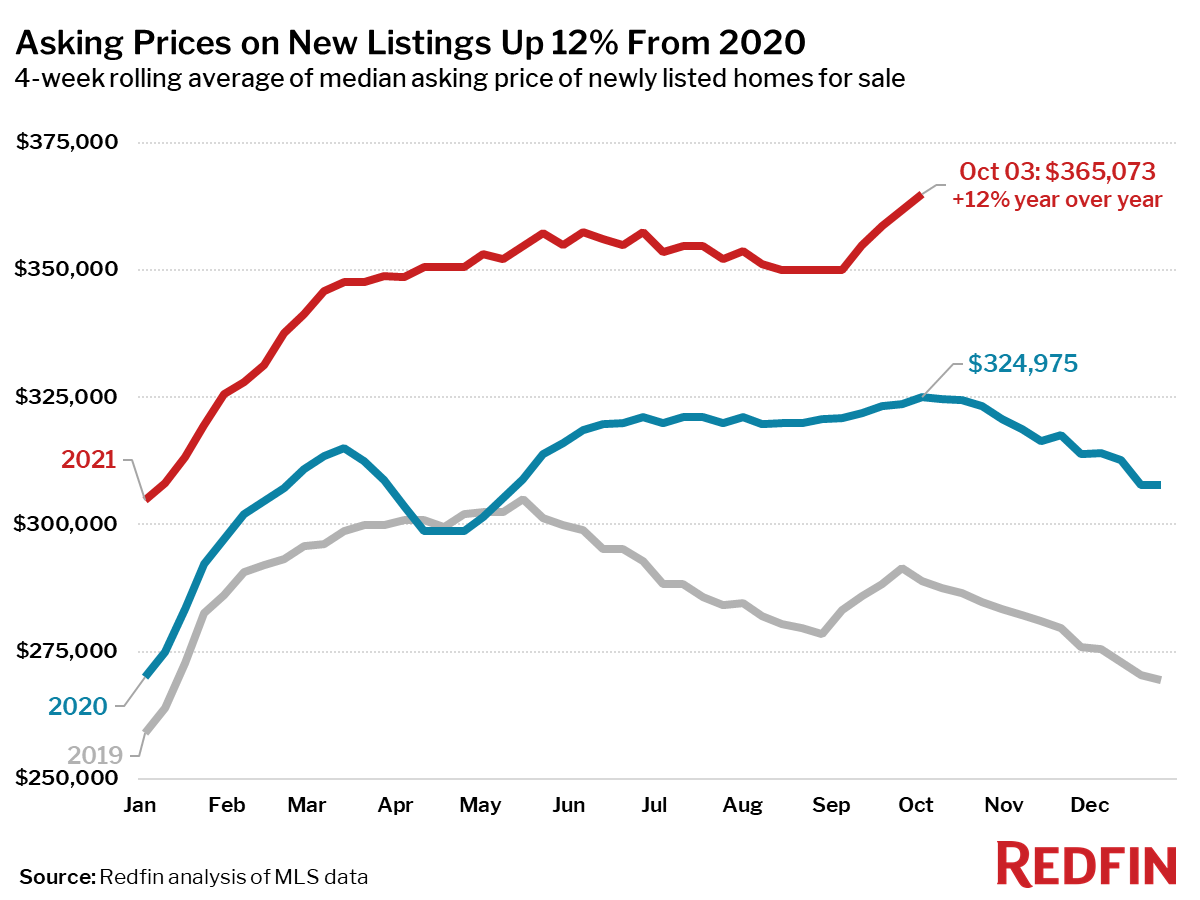
- Asking prices of newly listed homes were up 12% from the same time a year ago to a median of $365,073, an all-time high. Asking prices rose throughout the month of September, in a typical late-summer seasonal uptick.
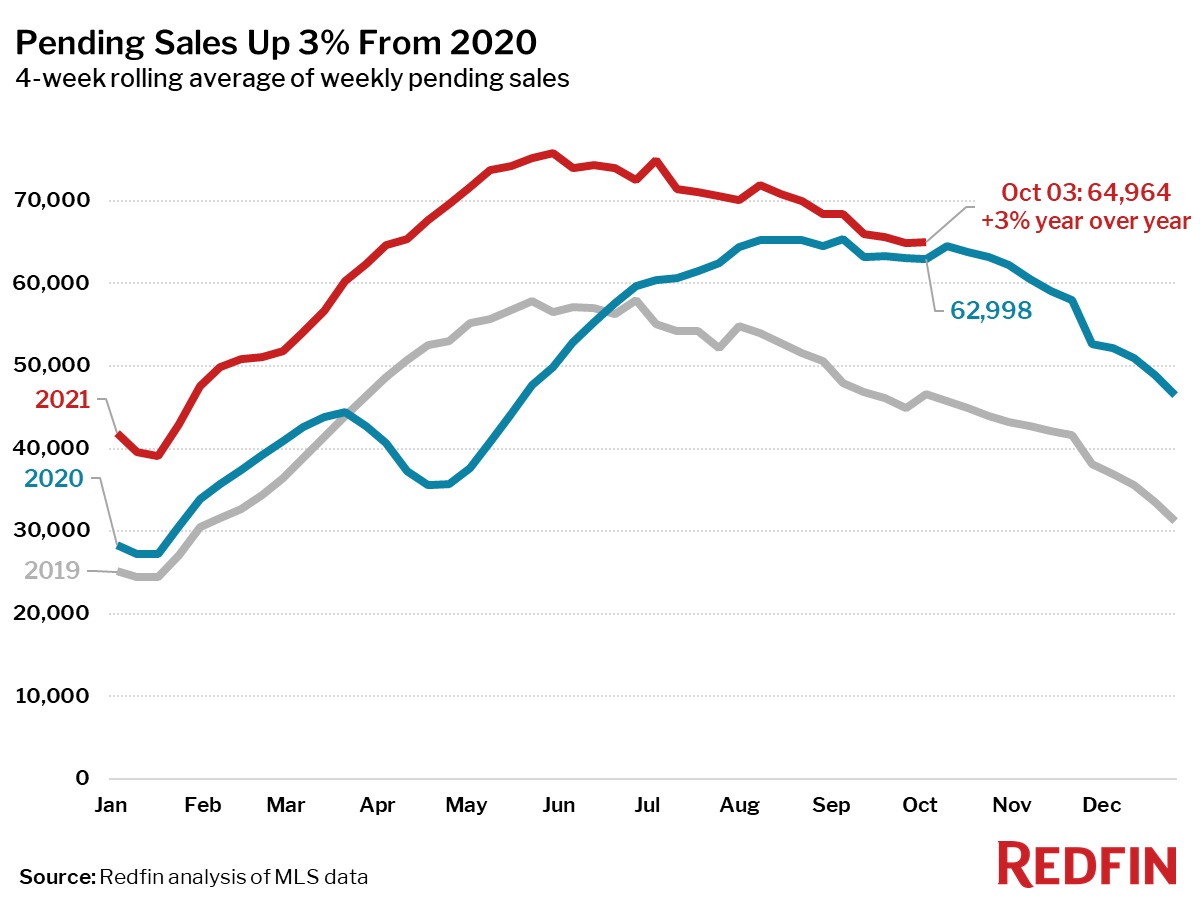
- Pending home sales were up 3% year over year, the smallest year-over-year increase since June of 2020.
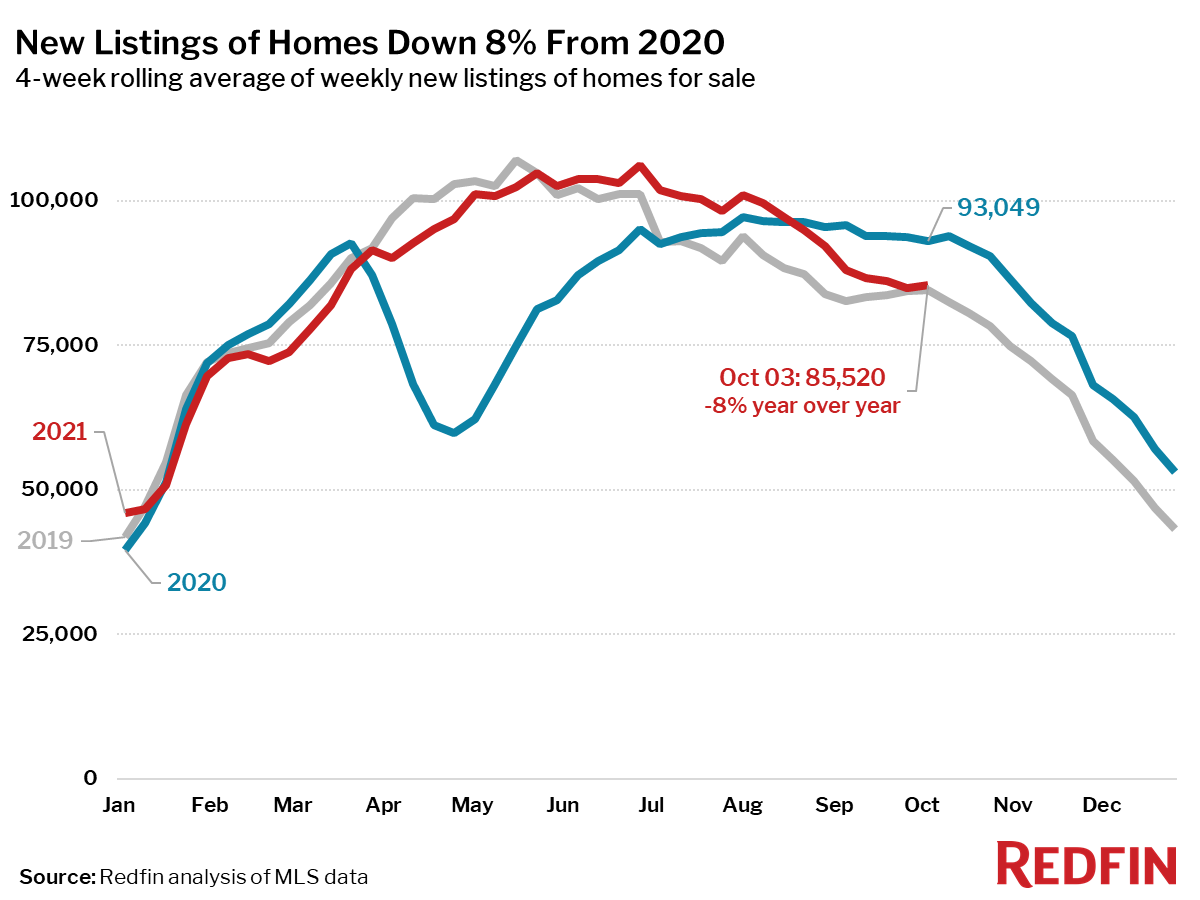
- New listings of homes for sale were down 8% from a year earlier. New listings have been below 2020 levels since the four-week period ending August 22.
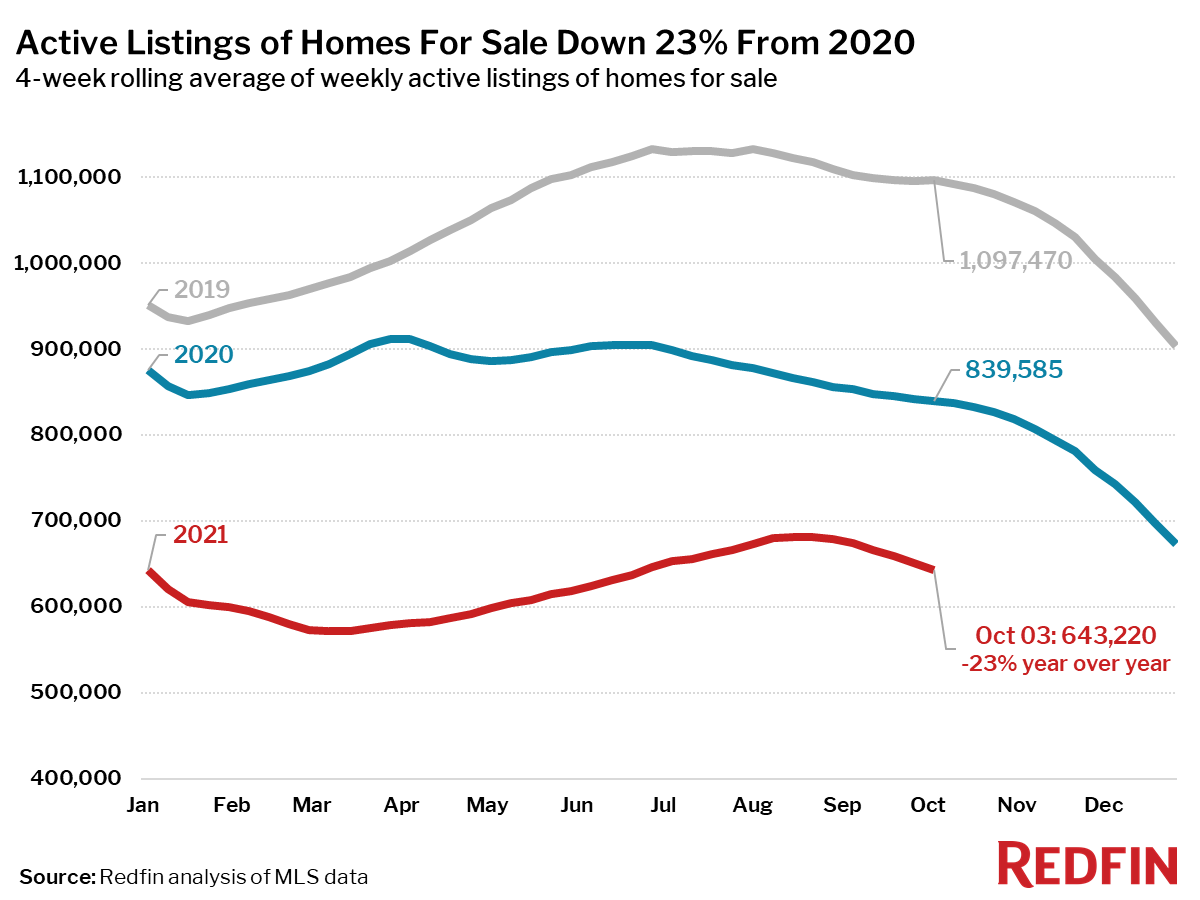
- Active listings (the number of homes listed for sale at any point during the period) fell 23% from 2020.
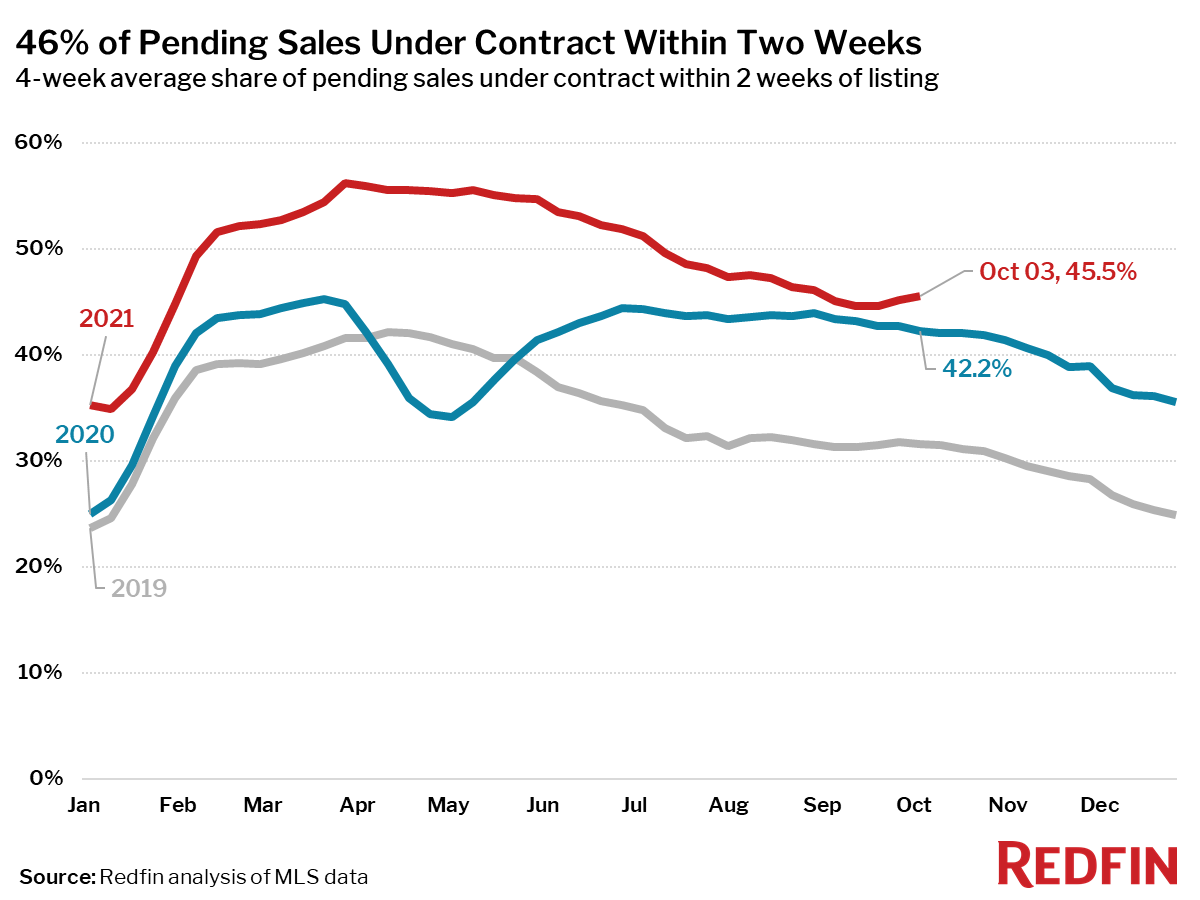
- 46% of homes that went under contract had an accepted offer within the first two weeks on the market, above the 42% rate of a year earlier.
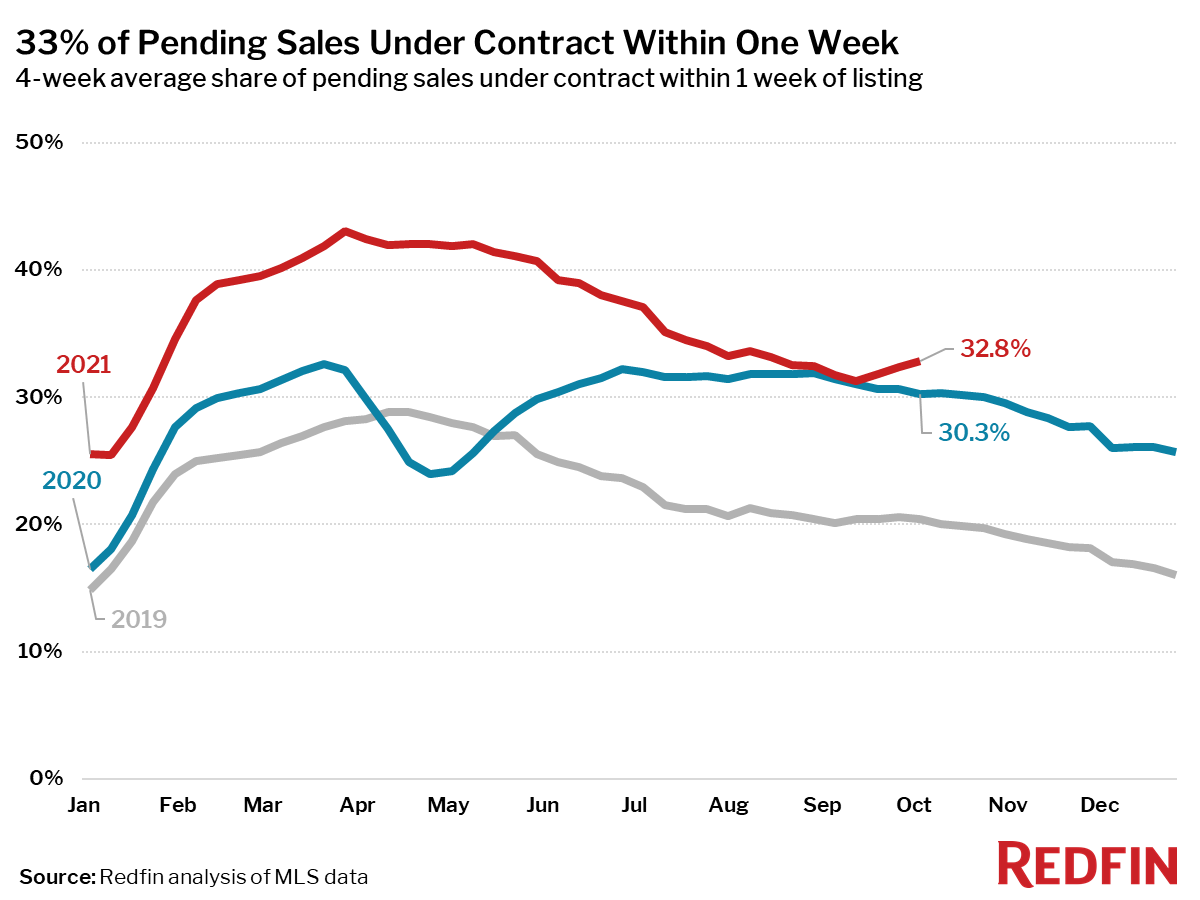
- 33% of homes that went under contract had an accepted offer within one week of hitting the market, up from 30% during the same period a year earlier.
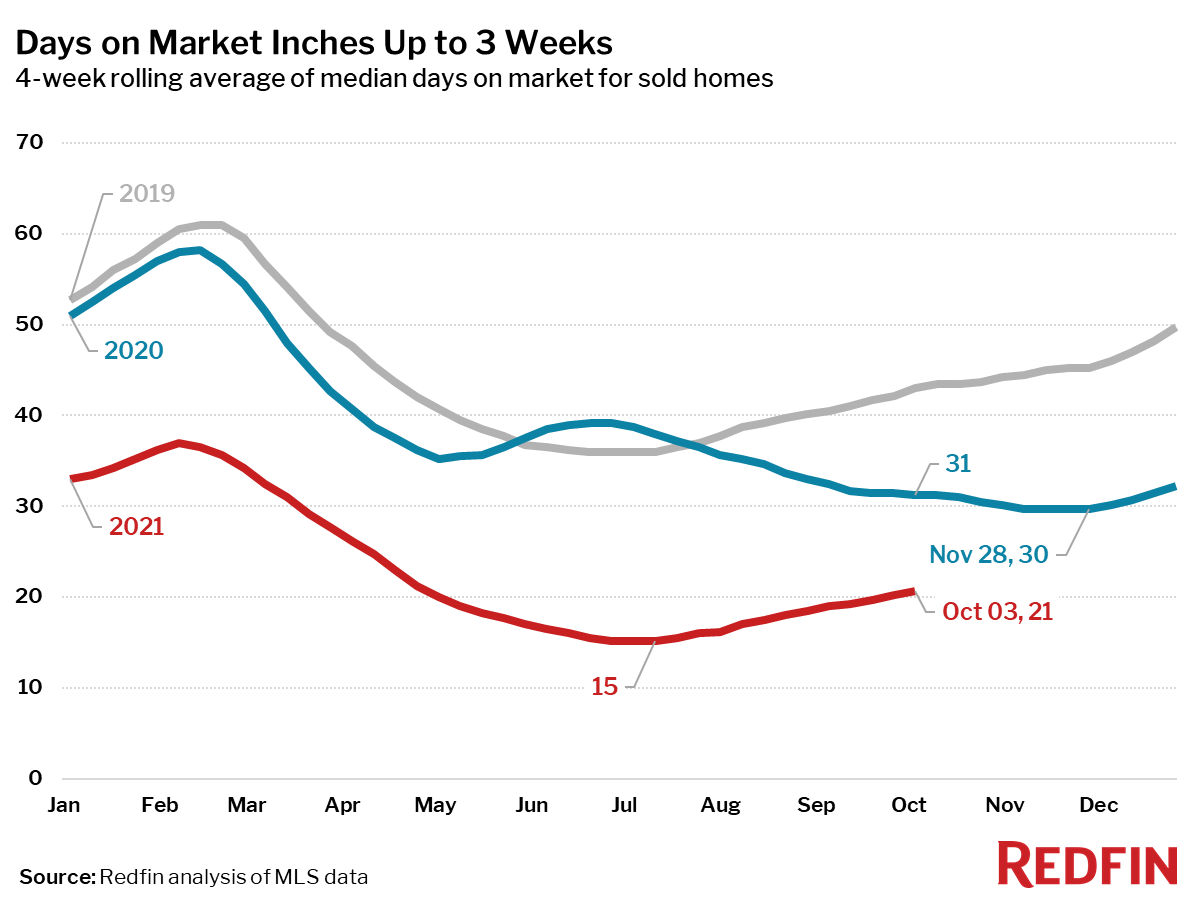
- Homes that sold were on the market for a median of 21 days, nearly a week longer than the all-time low of 15 days seen in late June and July, and down from 31 days a year earlier.
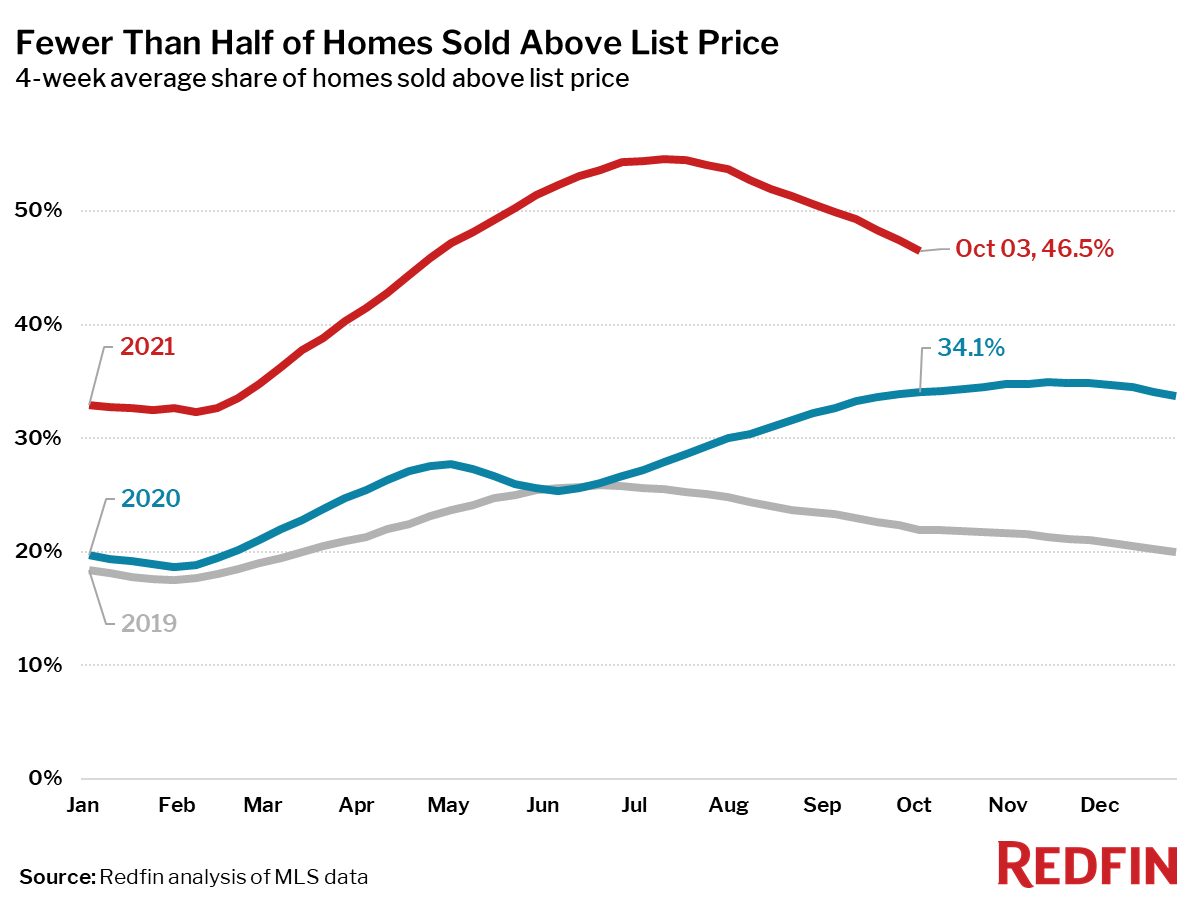
- 47% of homes sold above list price, up from 34% a year earlier, but the smallest share since April.
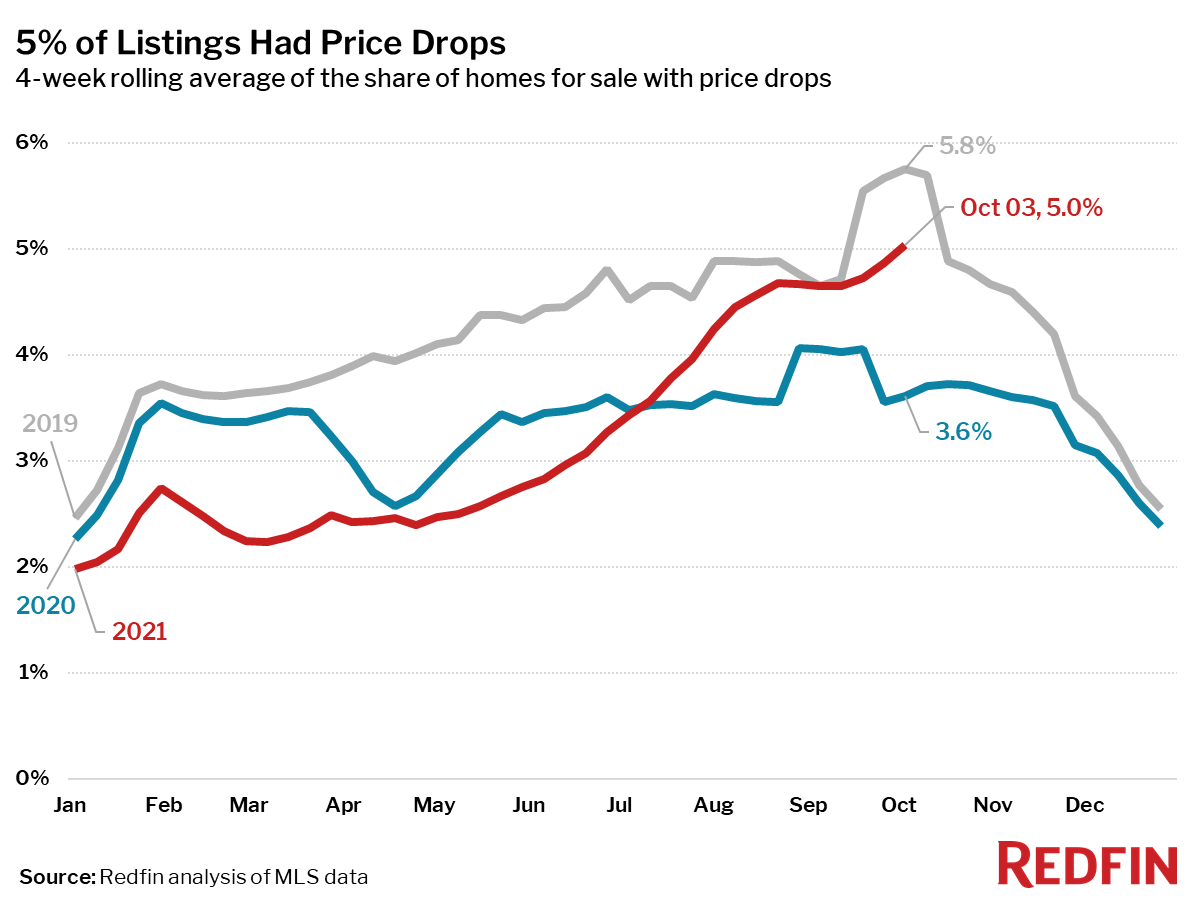
- On average, 5% of homes for sale each week had a price drop, up 1.4 percentage points from the same time in 2020, and the highest level since the four-week period ending October 13, 2019.
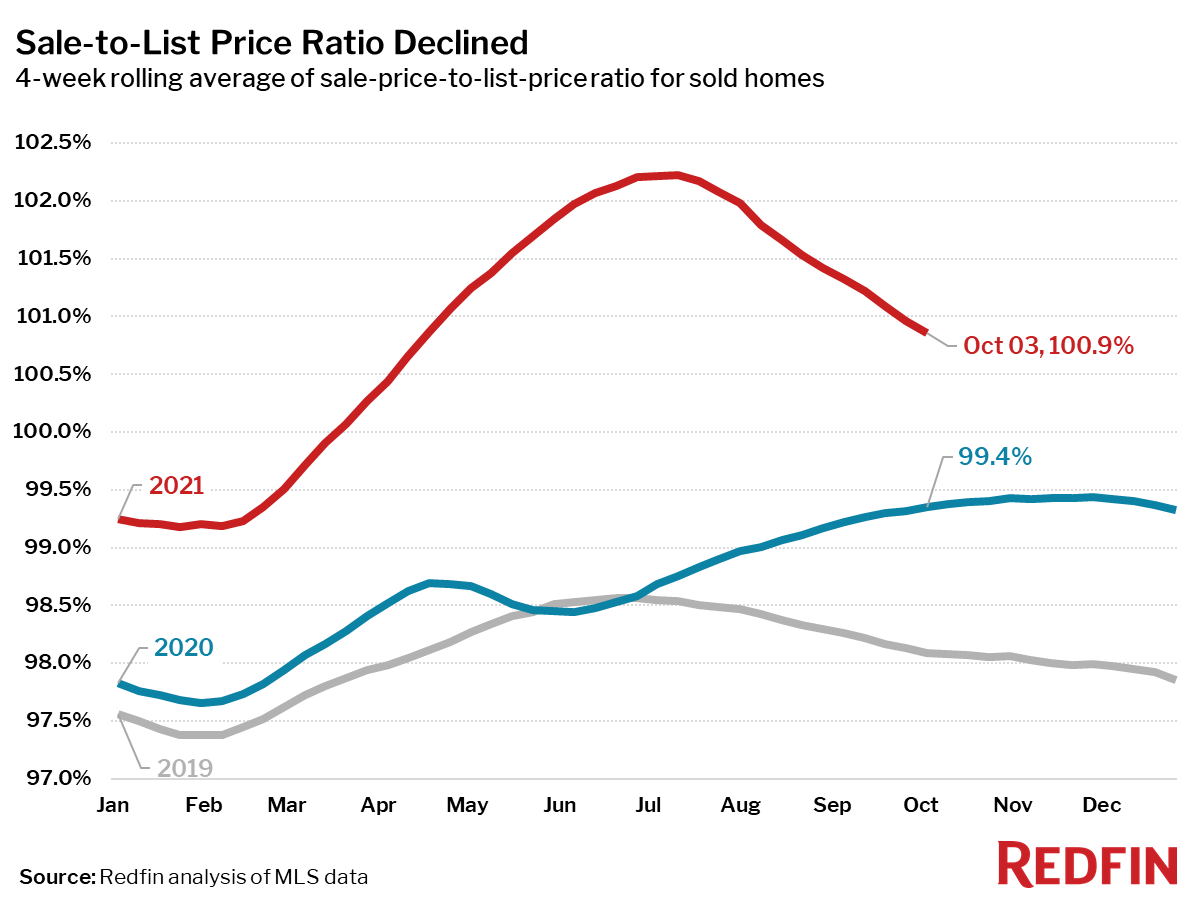
- The average sale-to-list price ratio, which measures how close homes are selling to their asking prices, decreased to 100.9%, the first time it has been below 101% since April. In other words, the average home sold for 0.9% above its asking price.
Other leading indicators of homebuying activity:
- Mortgage purchase applications decreased 2% week over week (seasonally adjusted) during the week ending October 1. For the week ending September 30, 30-year mortgage rates rose to 3.01%, the first time since June rates have been over 3%.
- From January 1 to October 3, home tours were up 8%, compared to a 27% increase over the same period last year, according to home tour technology company ShowingTime.
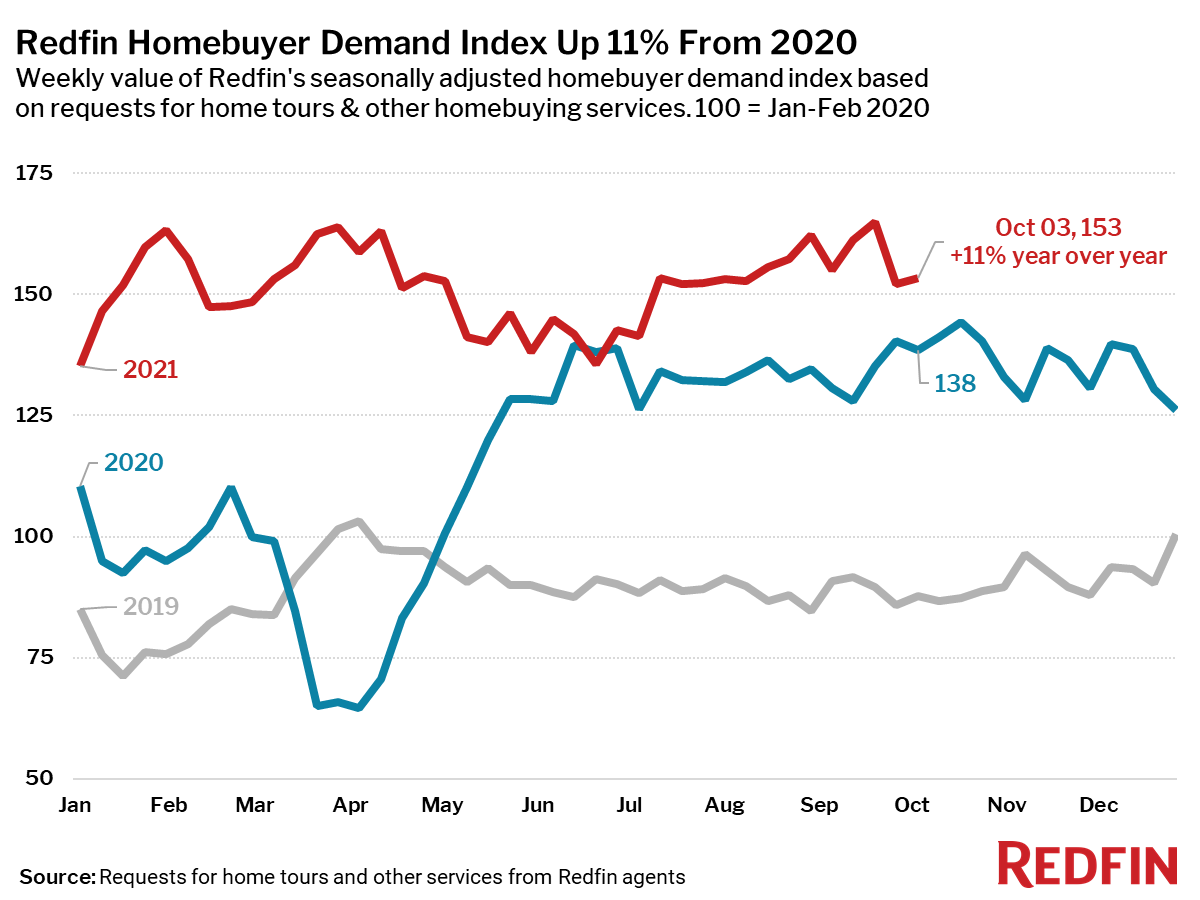
- The Redfin Homebuyer Demand Index rose 2 points during the week ending October 3, and was up 11% from a year earlier. The seasonally adjusted Redfin Homebuyer Demand Index is a measure of requests for home tours and other home-buying services from Redfin agents.
Refer to our metrics definition page for explanations of all the metrics used in this report.