Home prices keep soaring as pending sales and new listings start a typical seasonal decline.
Key housing market takeaways for 400+ U.S. metro areas:
Unless otherwise noted, this data covers the four-week period ending May 23.
Note: At this time last year, pandemic stay-at-home orders halted homebuying and selling, which makes year-over-year comparisons unreliable for select housing metrics. As such, we have broken this report into two sections: metrics for which a year-over-year comparison remains most relevant, and metrics for which it makes more sense to compare to the same period in 2019.
Metrics to compare to 2020:
Each of the metrics highlighted in the following list set a new housing record going back at least as far as 2012, when Redfin’s data began.
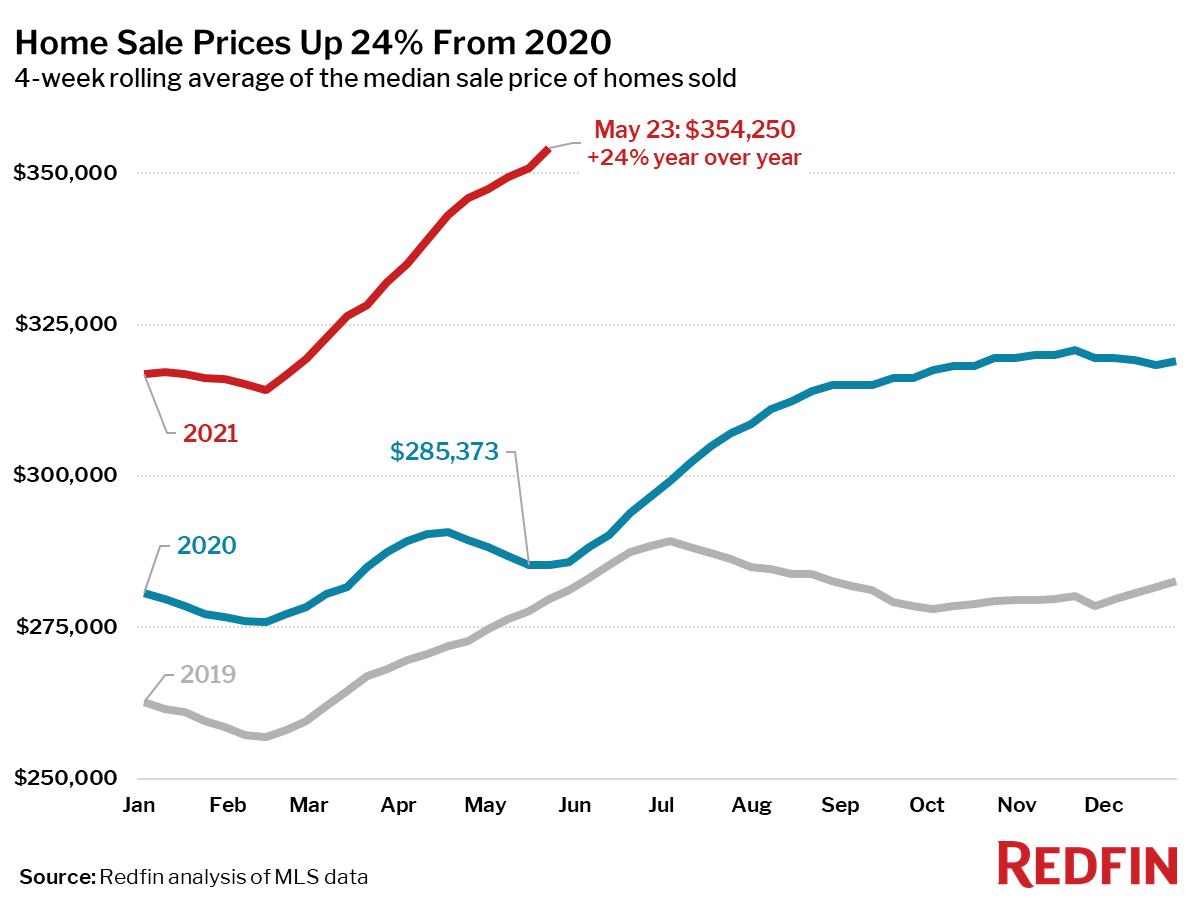
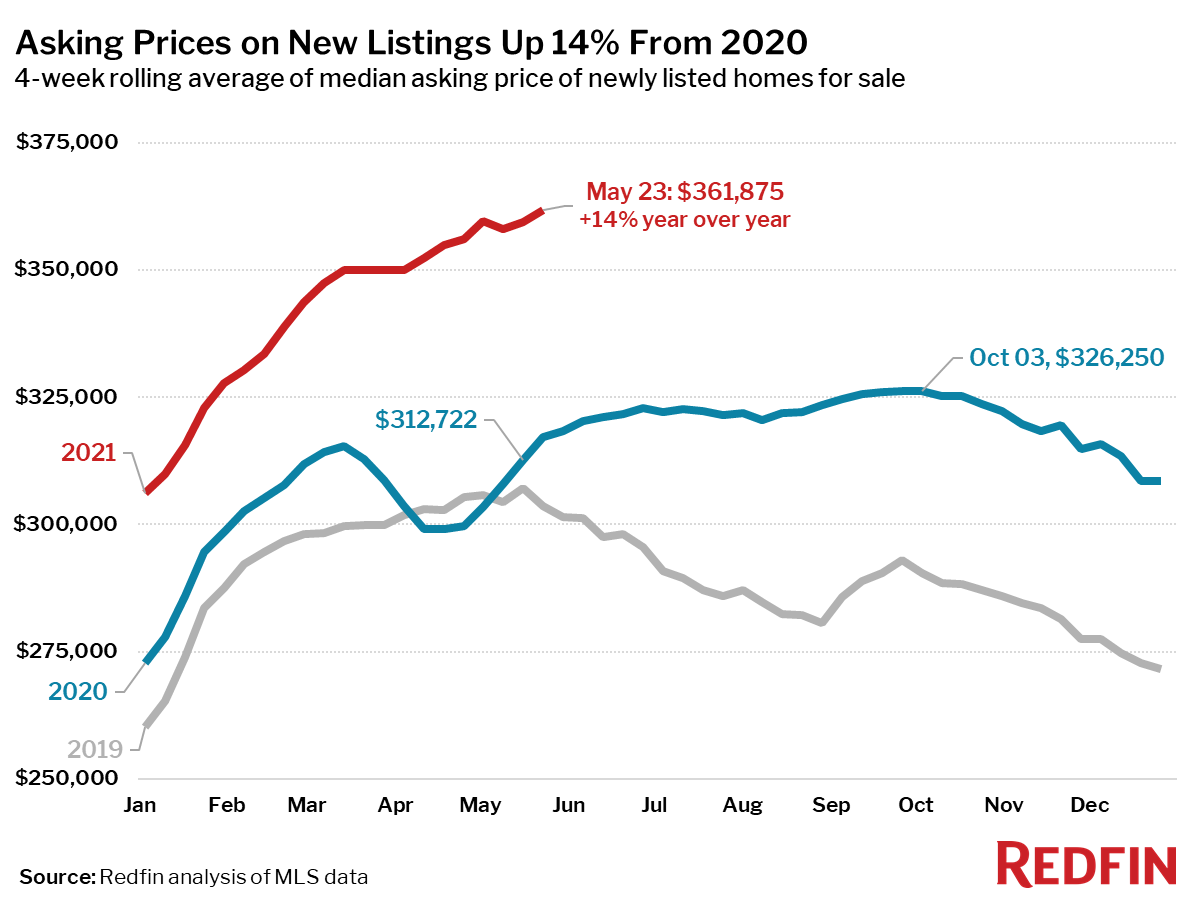
- A record-high median home sale price of $354,250 and were up 24% year over year, also a record. Asking prices reached a median $361,875, also a record high.
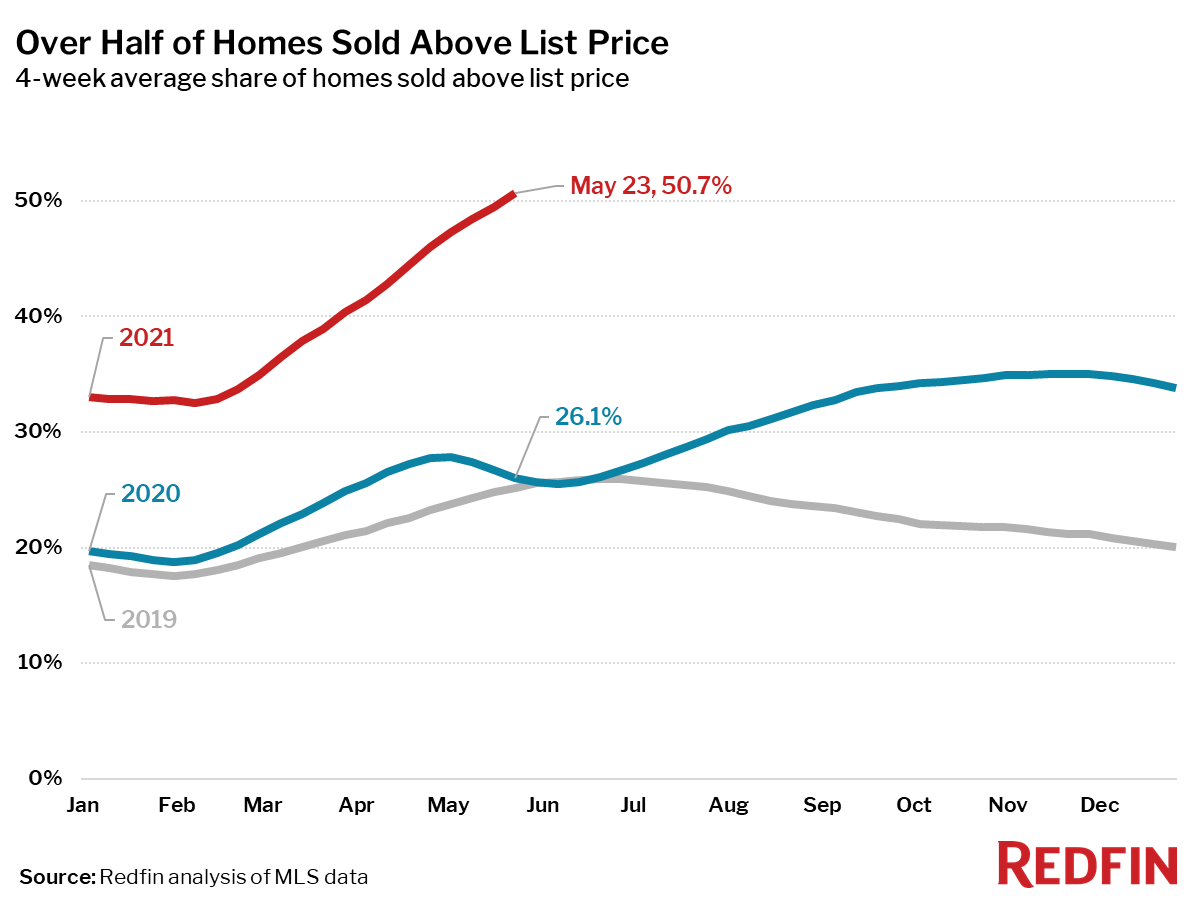
- A record high of 51% of homes sold for more than their list price, up from 26% the same period a year earlier.
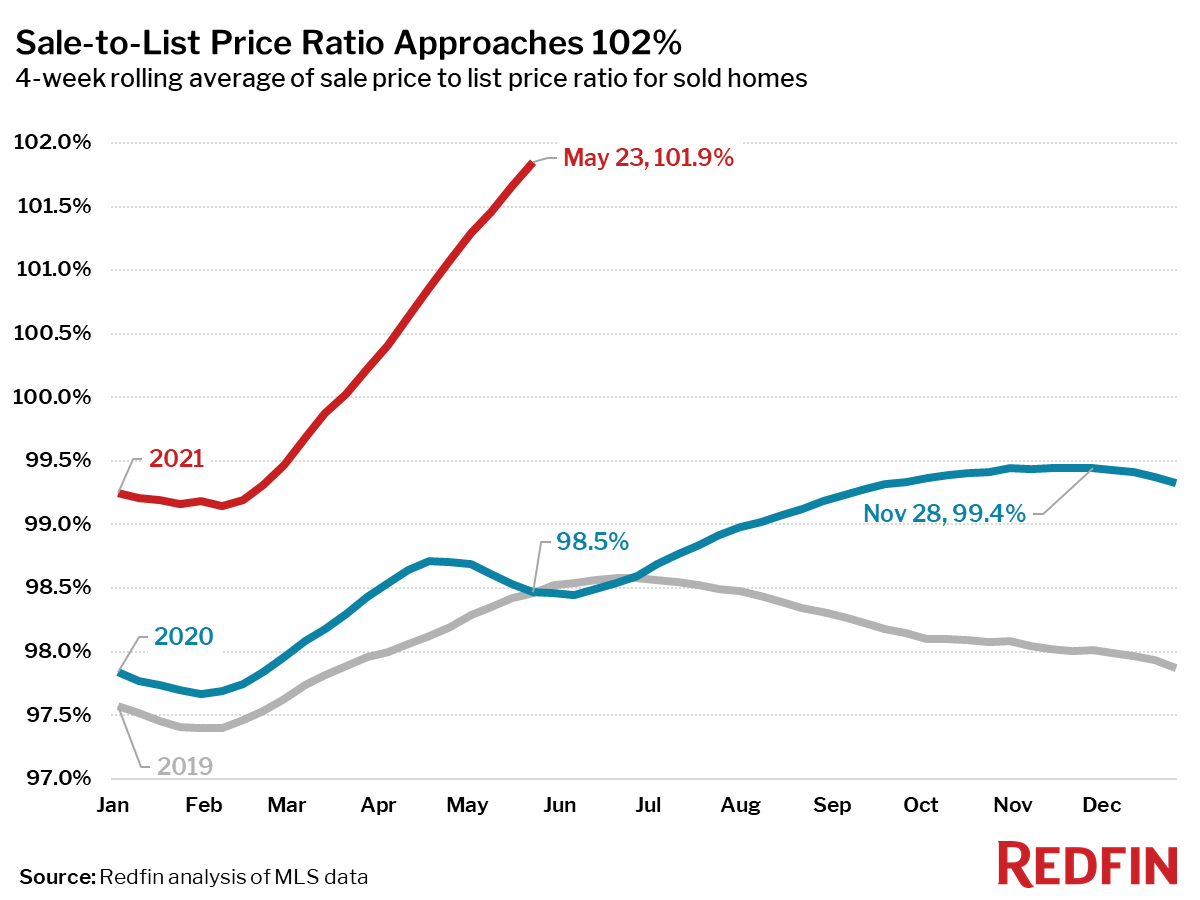
- A record-high 101.9% average sale-to-list price ratio, which measures how close homes are selling to their asking prices, up 3.4 percentage points year over year. This means that the average home sold for 1.9% more than its asking price.
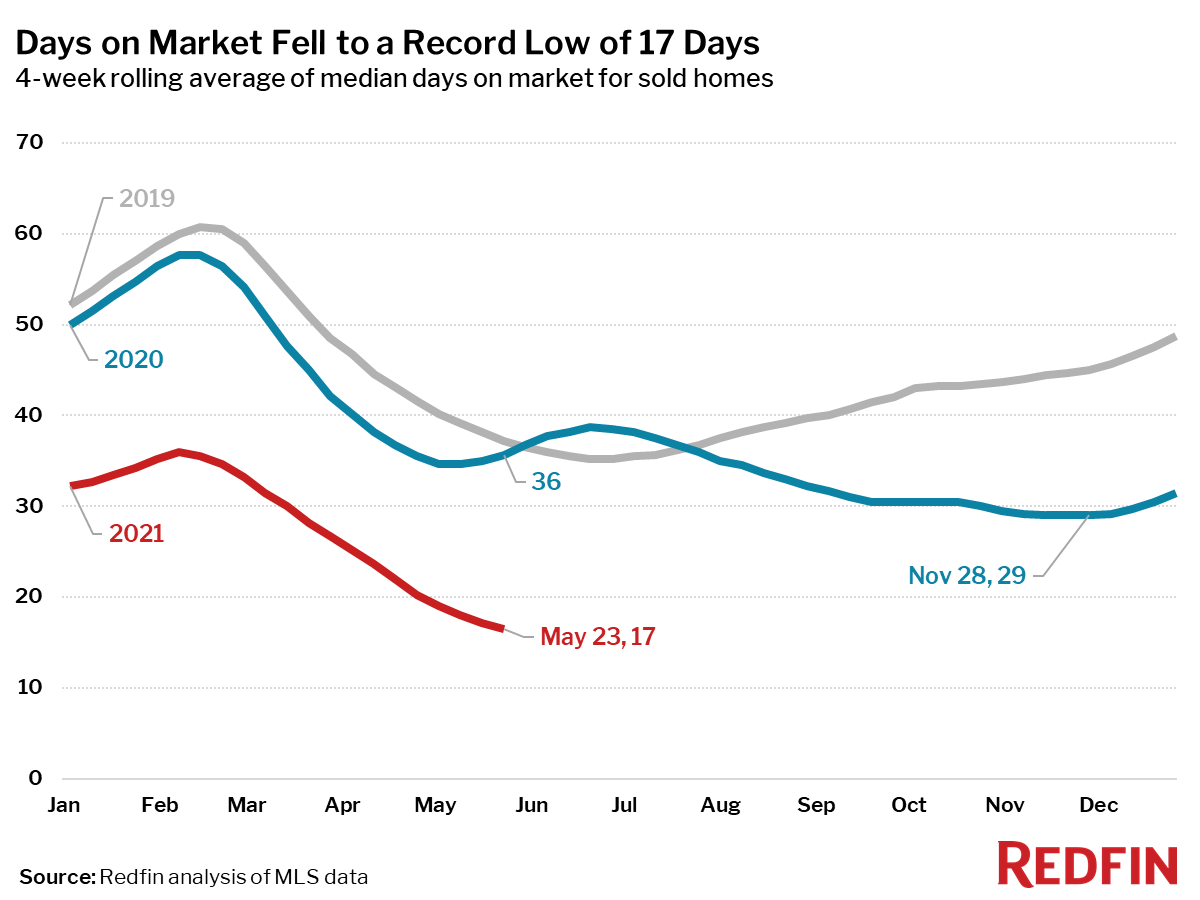
- A record low of 17 days on market for homes that sold during the period, down from 36 days from the same period in 2020.
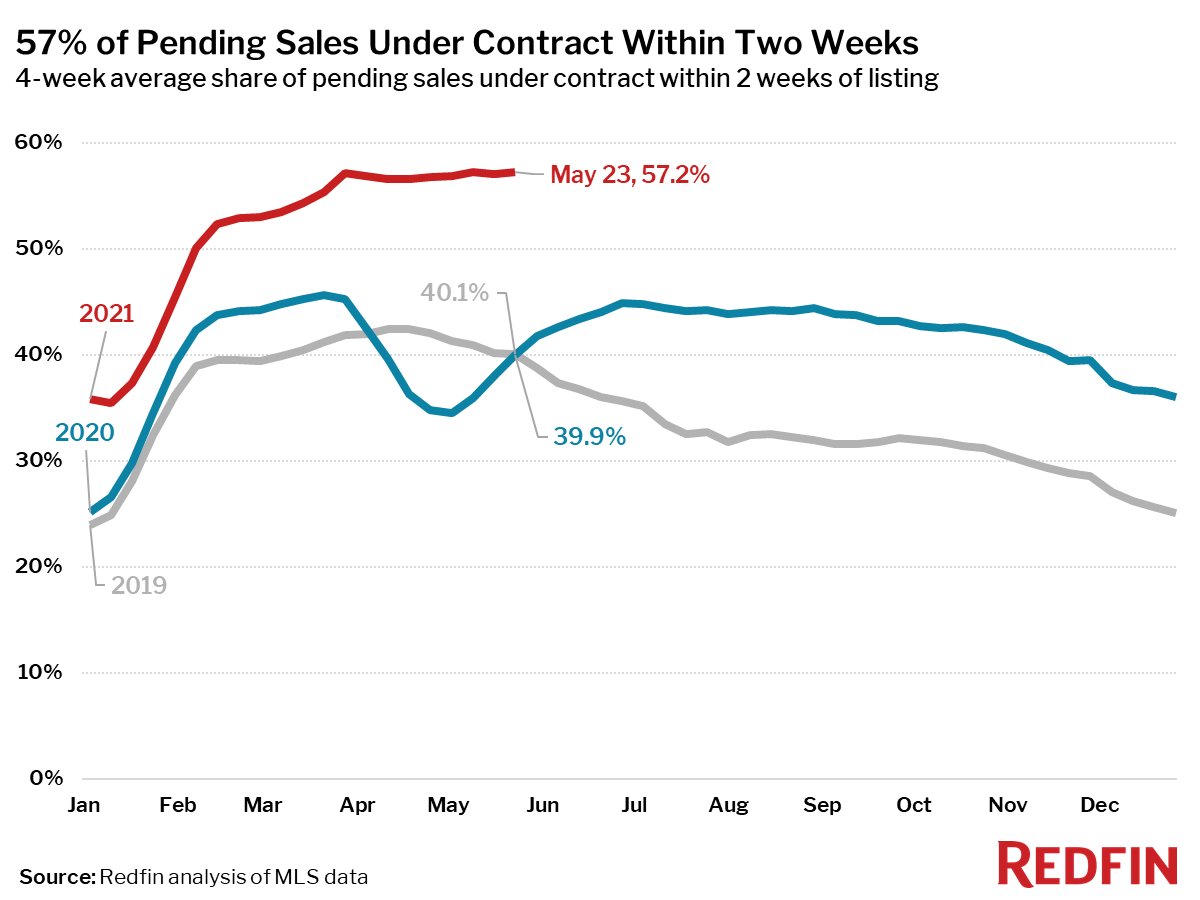
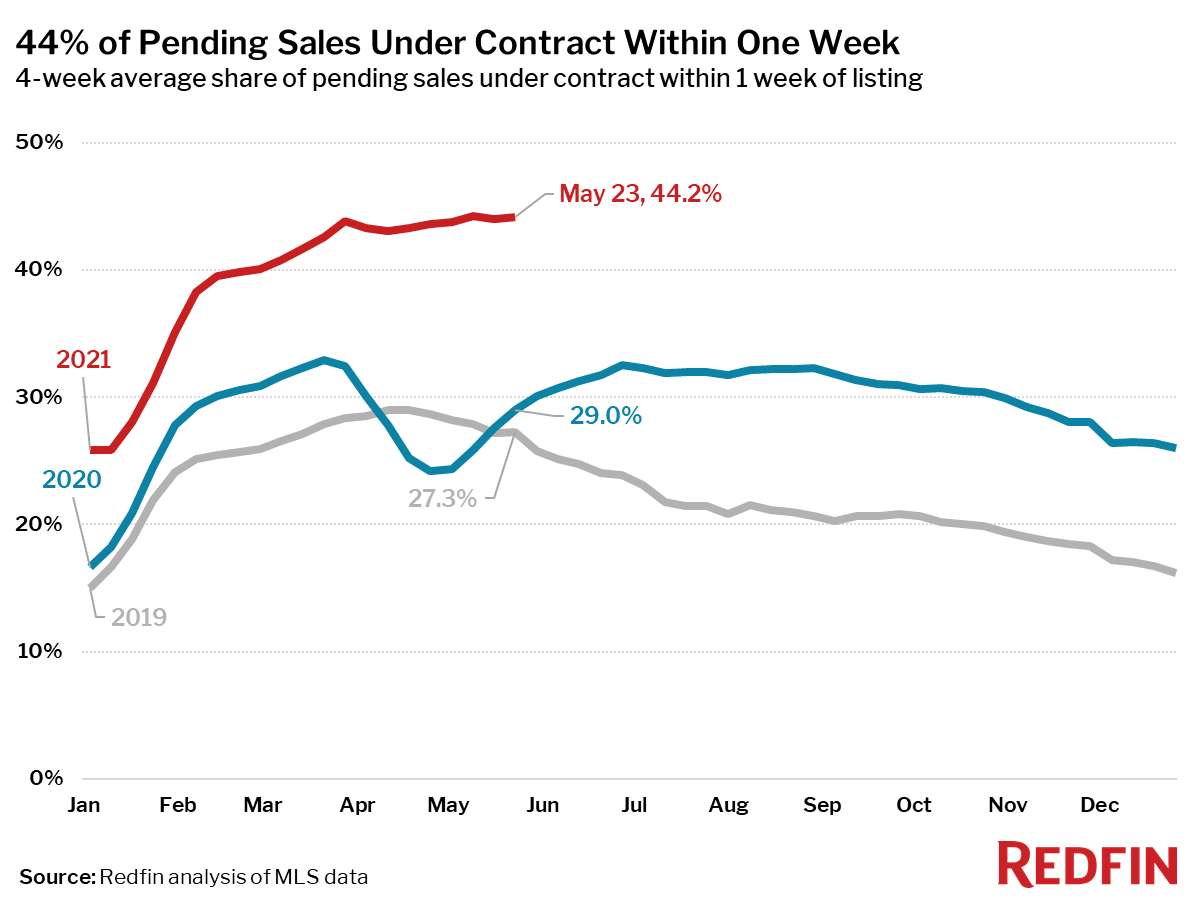
The share of homes sold in one or two weeks are both just shy of their record high level, which was set during the four-week period ending May 9.
- 57% of homes that went under contract had an accepted offer within the first two weeks on the market.
- 44% of homes that went under contract had an accepted offer within one week of hitting the market.
Metrics to compare to 2019:
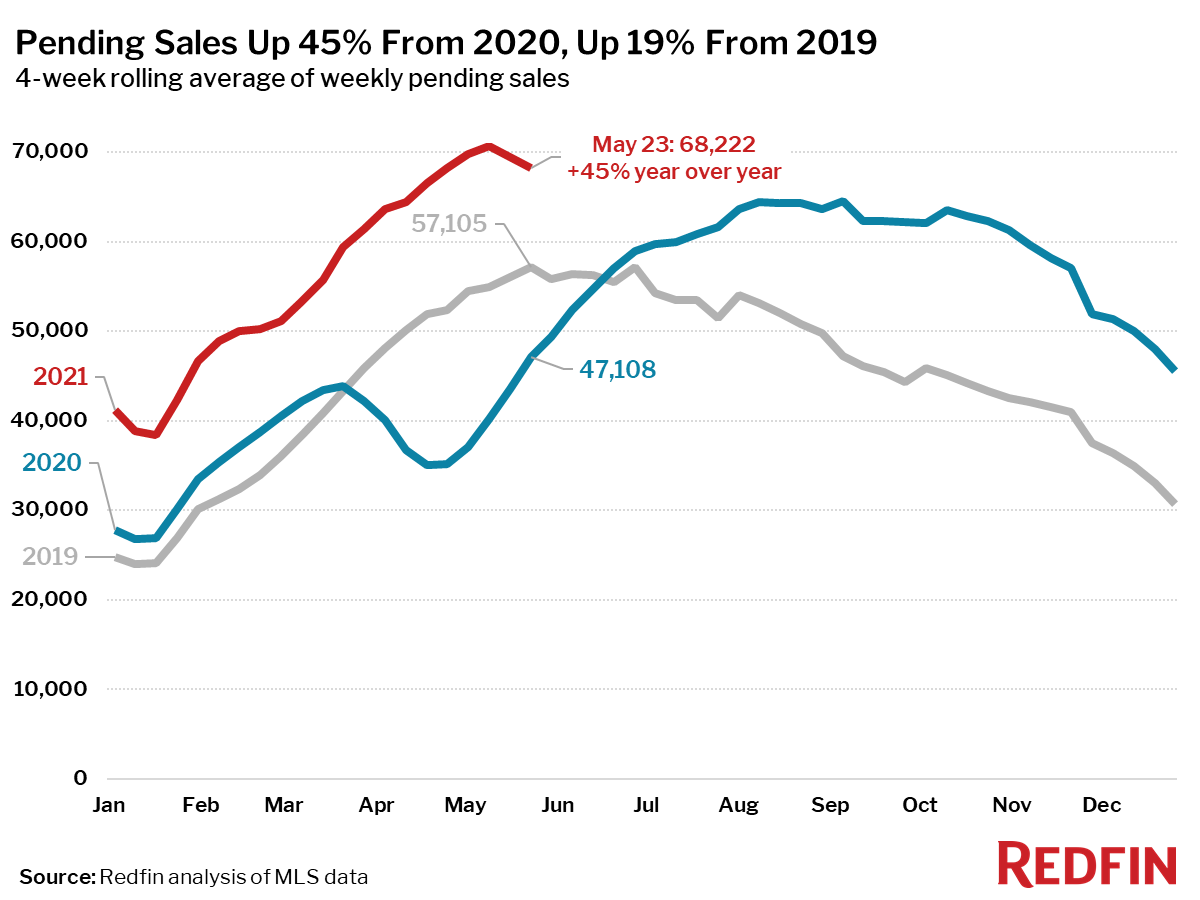
- Pending home sales were up 19% from the same period in 2019, but are down 3% from the four-week period ending May 9.
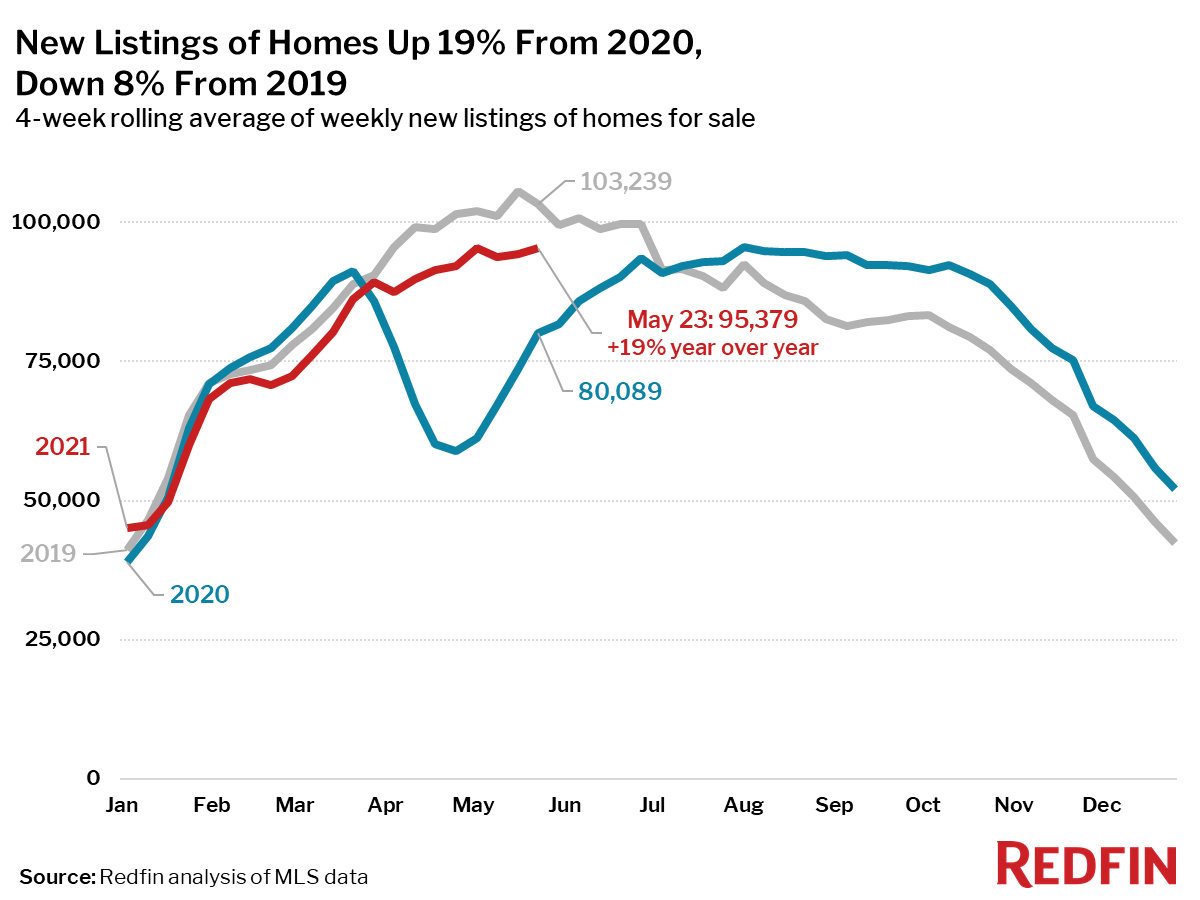
- New listings of homes for sale were down 8% from the same period in 2019, and are down slightly from the 2021 high, which was set during the four-week period ending May 2.
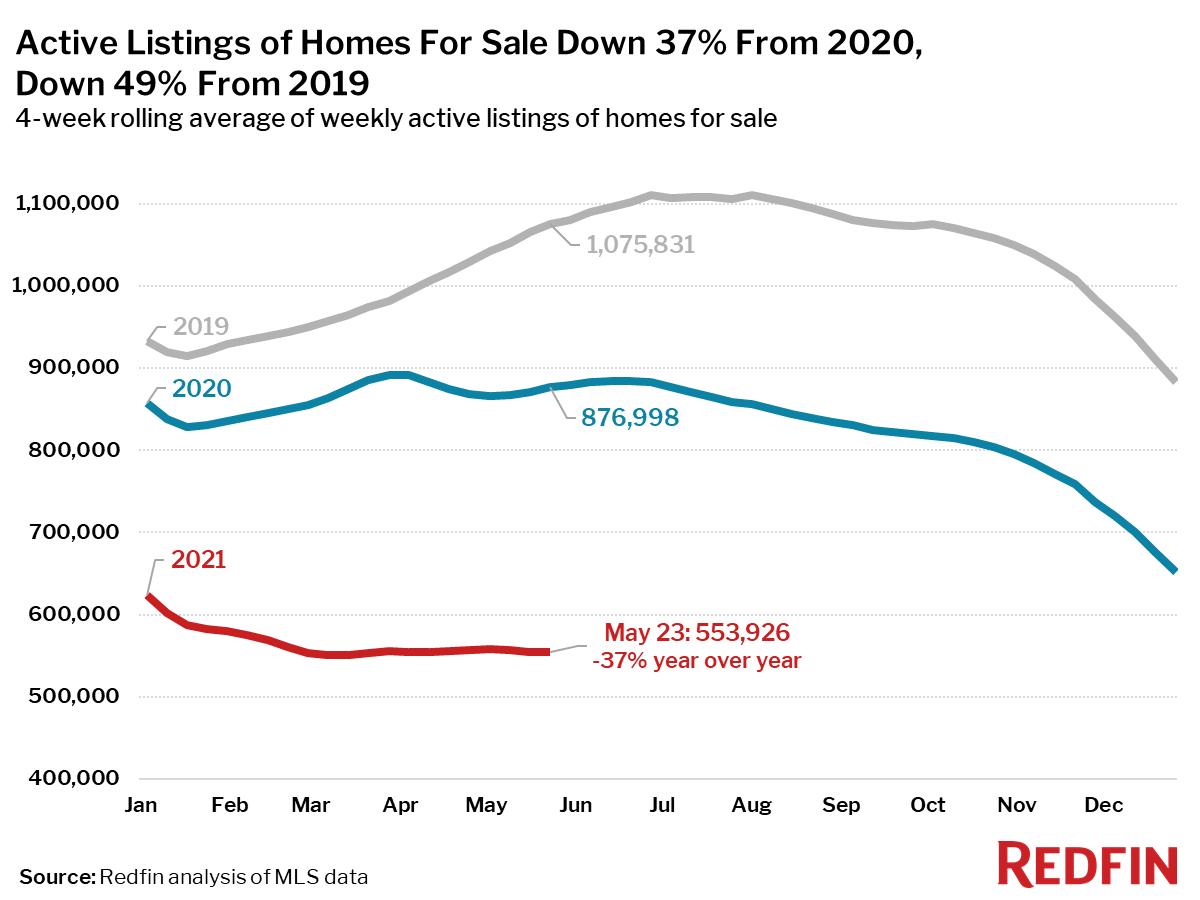
- Active listings (the number of homes listed for sale at any point during the period) fell 49% from the same period in 2019.
For the week ending May 21, Mortgage purchase applications increased 2% week over week (seasonally adjusted). For the week ending May 27, 30-year mortgage rates fell slightly to 2.95%.
“We are seeing a typical late-spring slowdown in new listings and pending sales” said Redfin Chief Economist Daryl Fairweather. “However, prices don’t typically peak until late August, and their growth remains completely unhinged. The fact that homes keep selling for more and more above asking prices goes to show that many more people want a home than there are homes for sale. I don’t see that changing until mortgage rates increase, which will likely happen later this year. But until then, the housing market will remain red-hot.”
Refer to our metrics definition page for explanations of all the metrics used in this report.