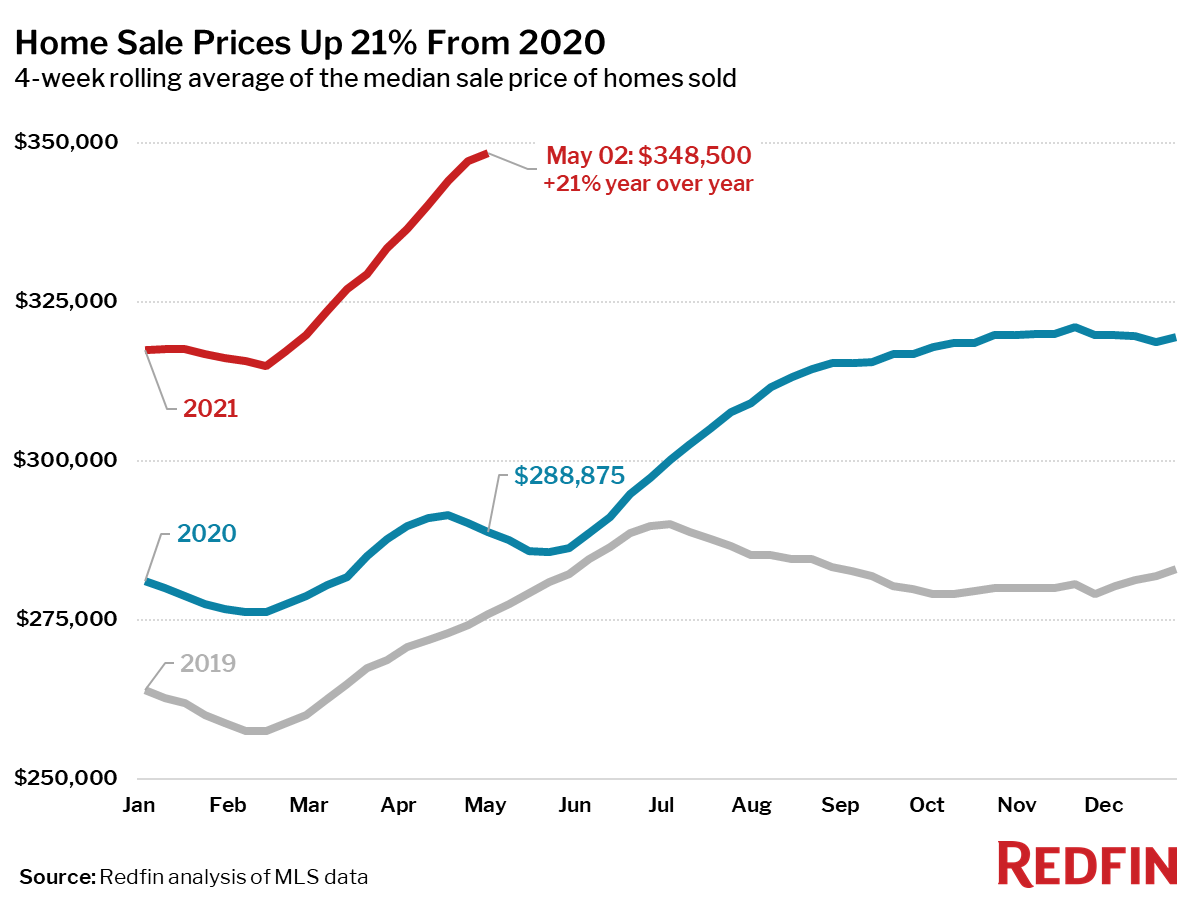
Home prices rose 21% as the typical home sold for 1.4% above list price after 19 days on market.
Key housing market takeaways for 400+ U.S. metro areas:
Unless otherwise noted, this data covers the four-week period ending May 2.
Note: At this time last year, pandemic stay-at-home orders halted homebuying and selling, which makes year-over-year comparisons unreliable for select housing metrics. As such, we have broken this report into two sections: metrics that are OK to compare to the same period in 2020, and metrics for which it makes more sense to compare to the same period in 2019.
Metrics to compare to 2020:
All of the following housing measures hit a record level since at least the beginning of Redfin’s data in 2012.
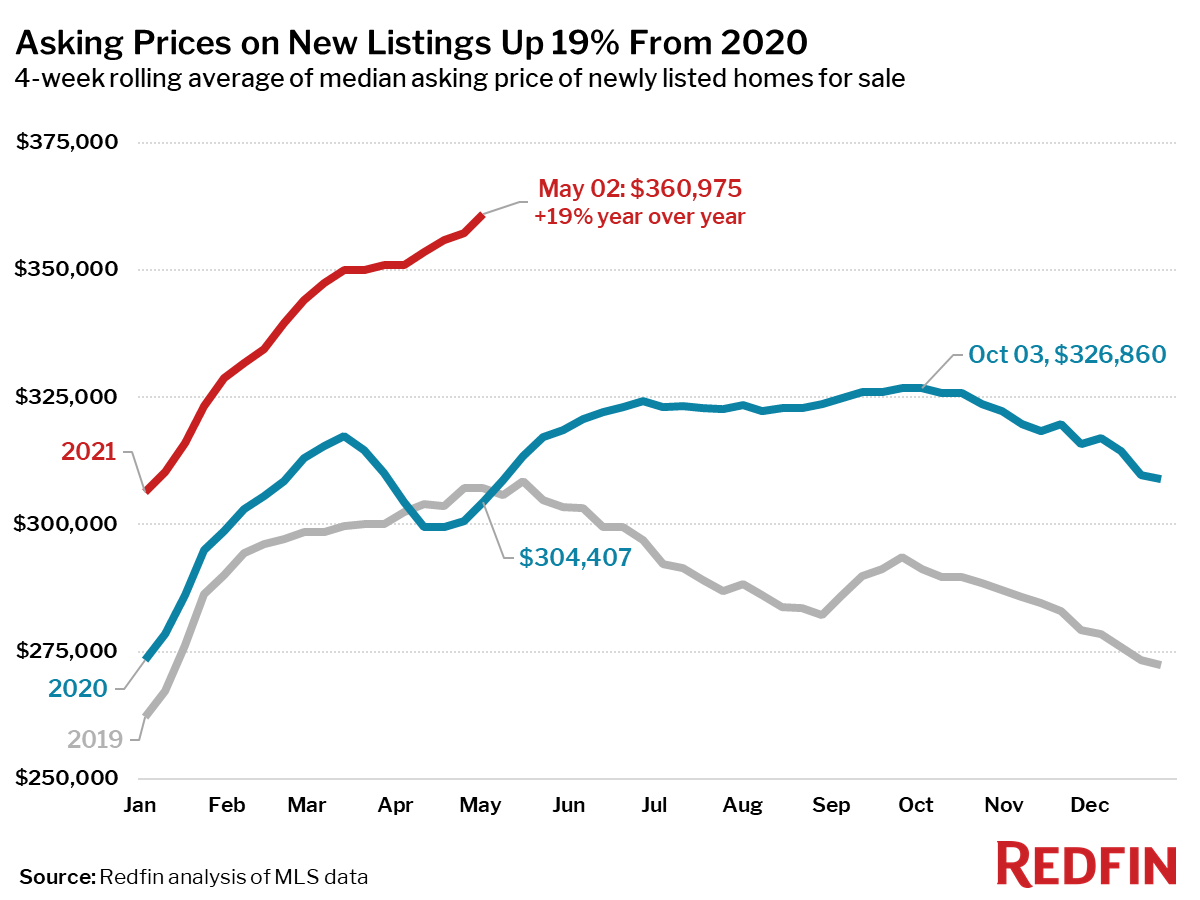
- A record high 21% year-over-year growth rate in the median home-sale price, which hit $348,500. One contributing factor to the large rate of growth is that more high-end homes are being sold now than a year ago. Asking prices reached an all-time high of $360,975.
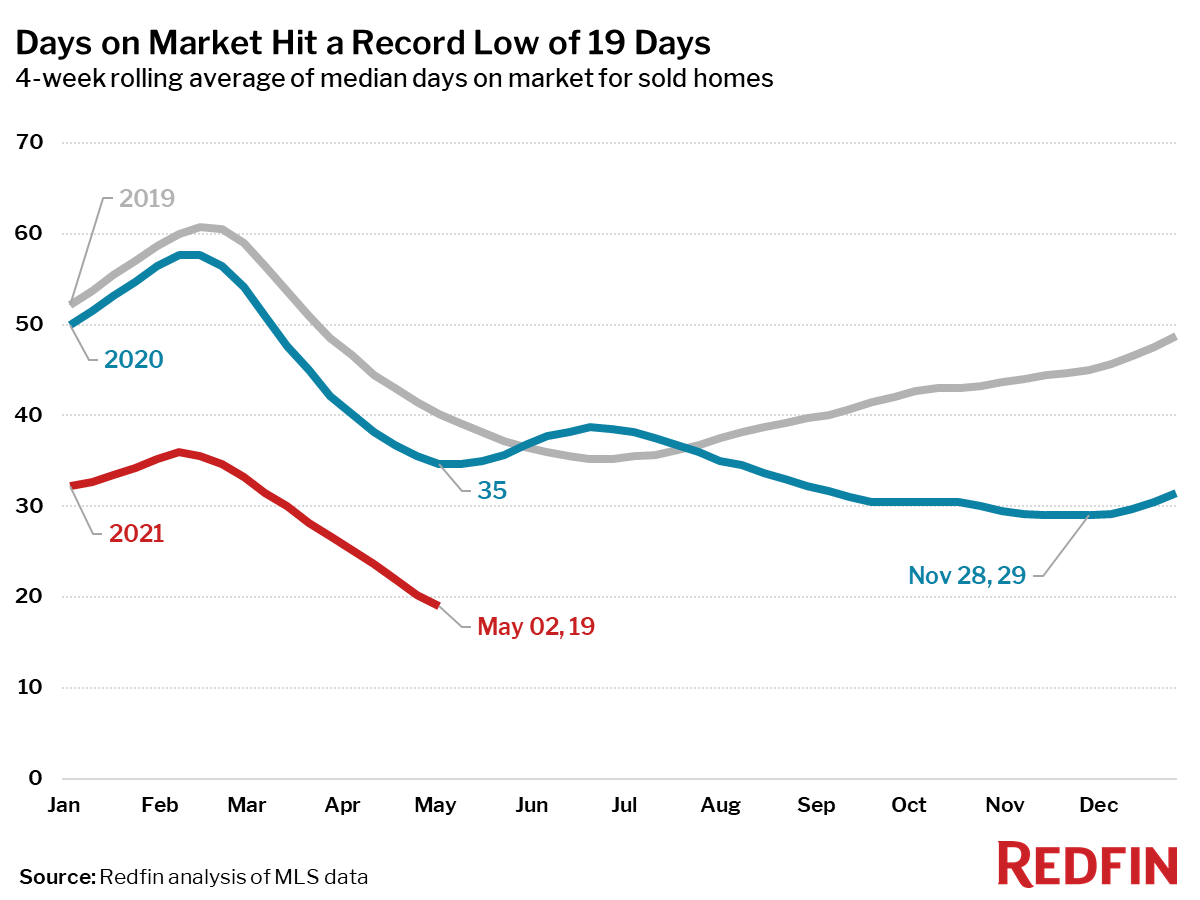
- A record low of just 19 days on market for homes that sold during the period, down 16 days from the same period in 2020.
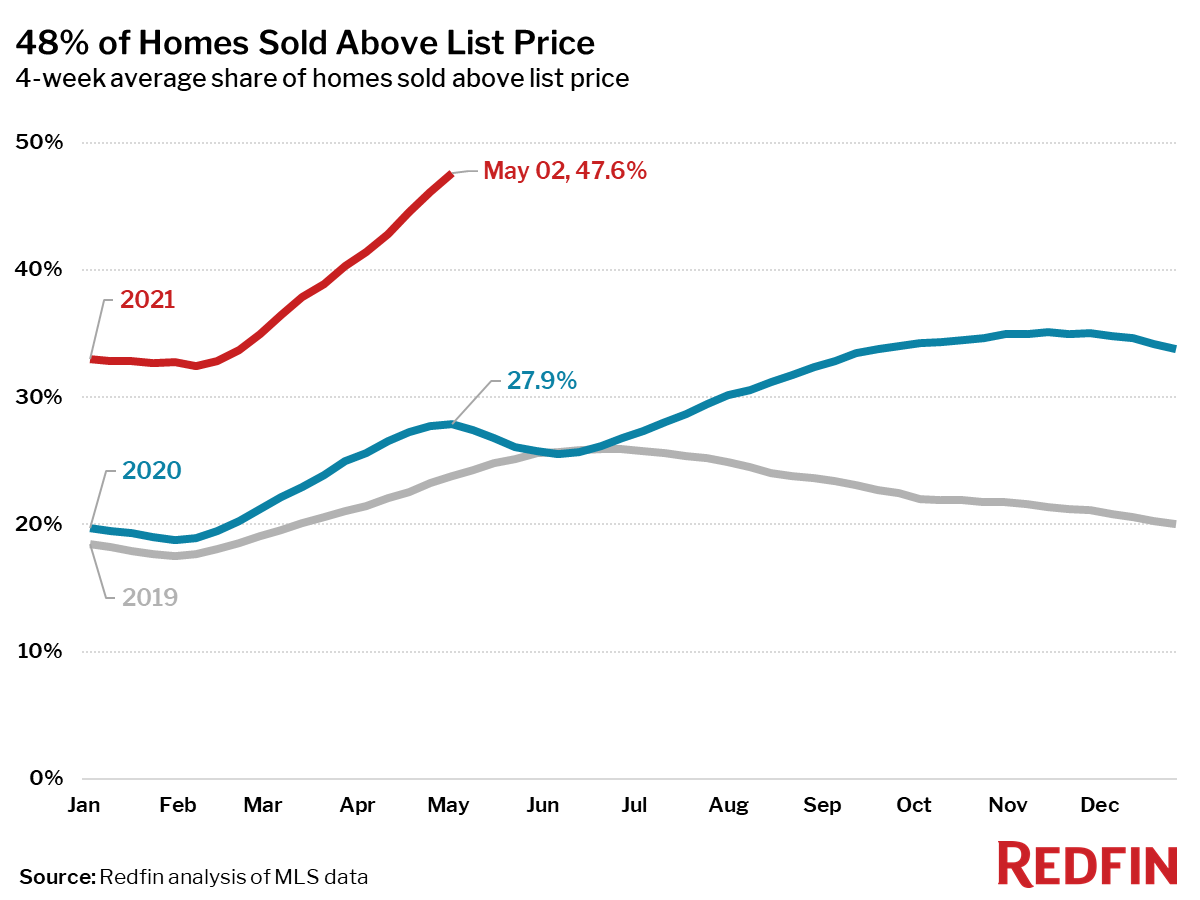
- A record high of 48% of homes sold for more than their list price, up 20 percentage points from the same period a year earlier.
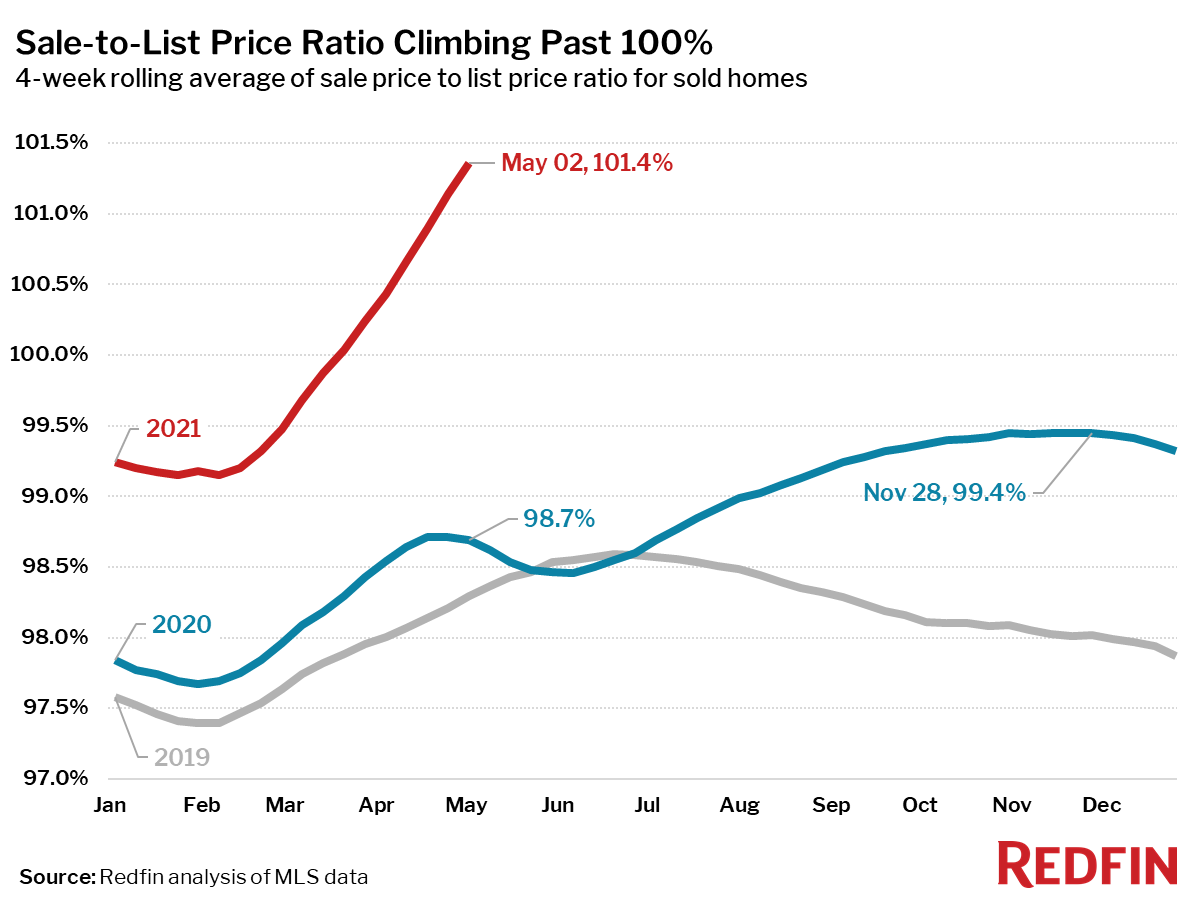
- A record high 101.4% average sale-to-list price ratio, which measures how close homes are selling to their asking prices, up 2.7 percentage points year over year. This means that the average home sold for 1.4% more than its asking price.
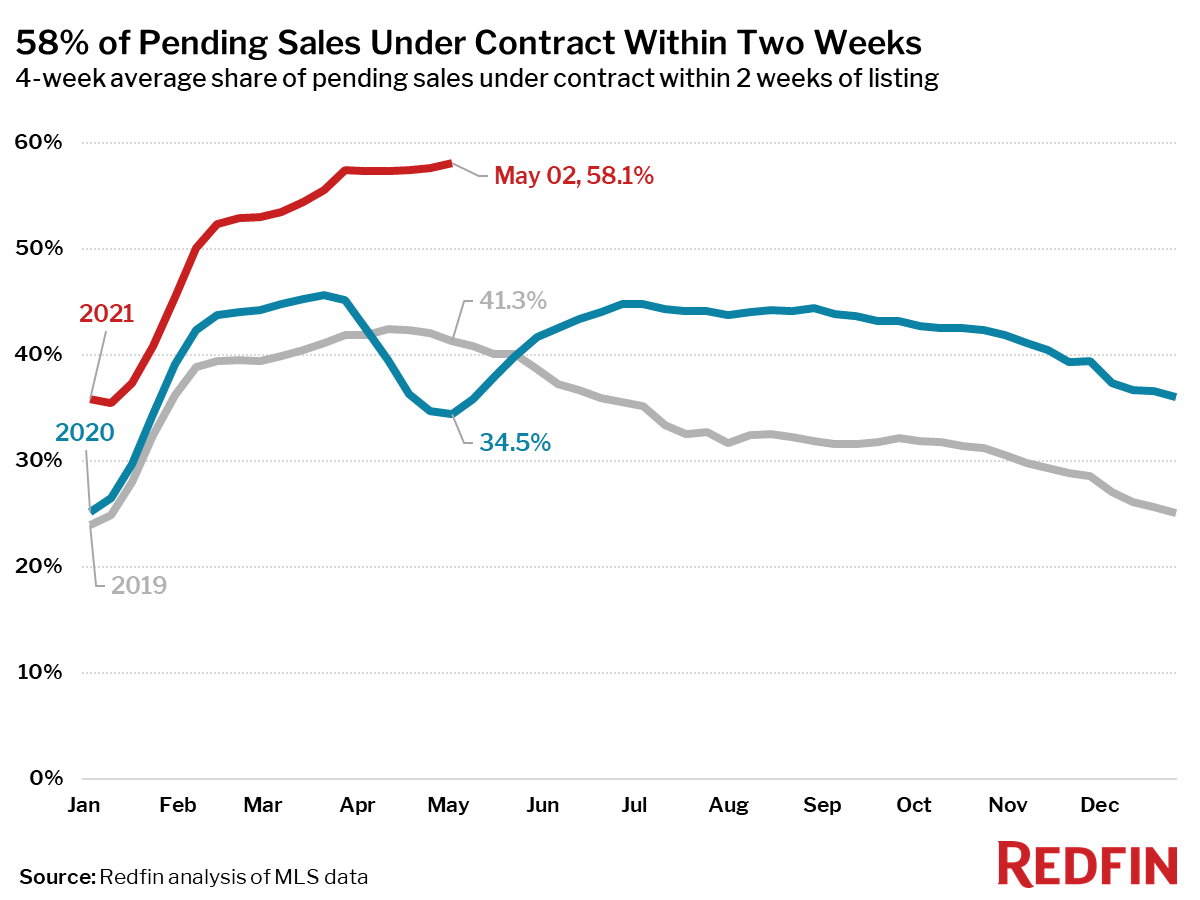
- A record high 58% of homes that went under contract had an accepted offer within the first two weeks on the market.
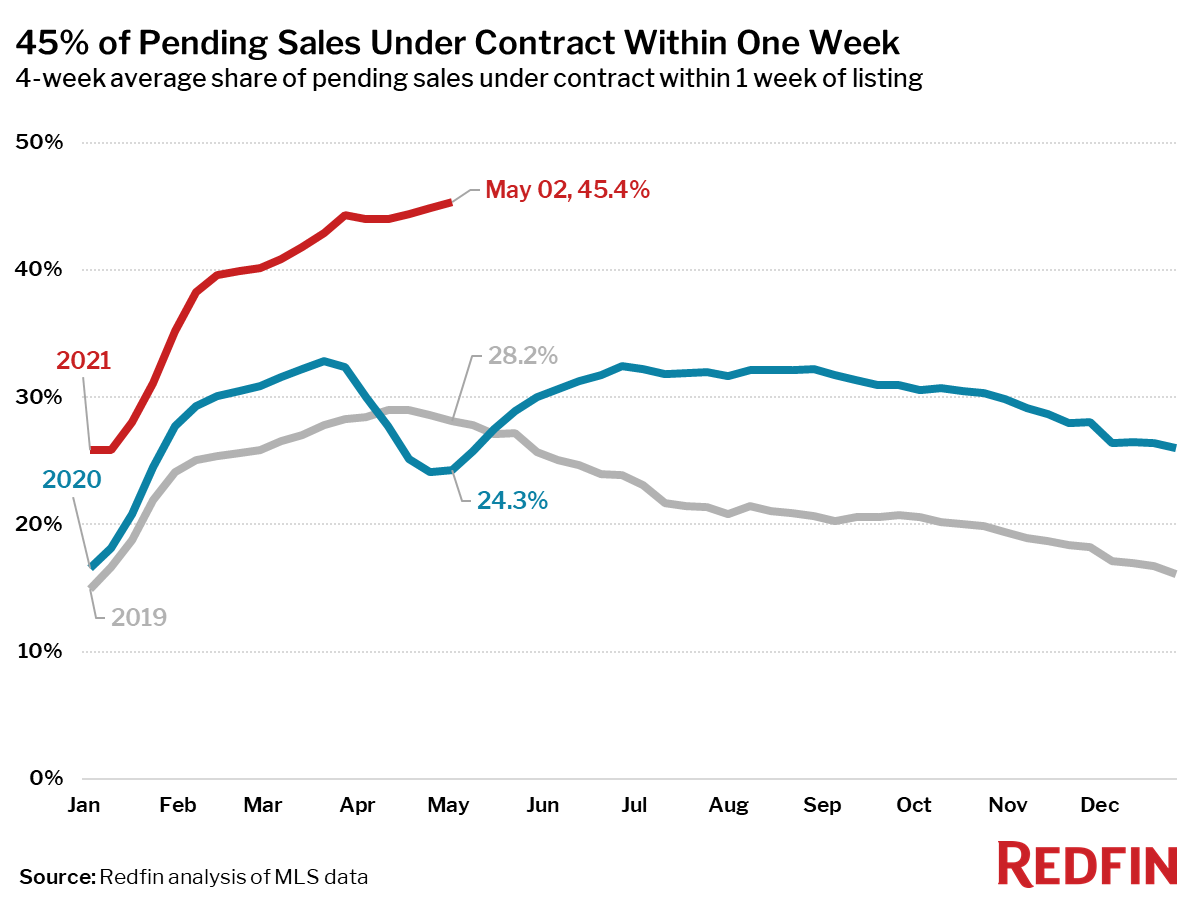
- A record high 45% of homes that went under contract had an accepted offer within one week of hitting the market.
Metrics to compare to 2019:
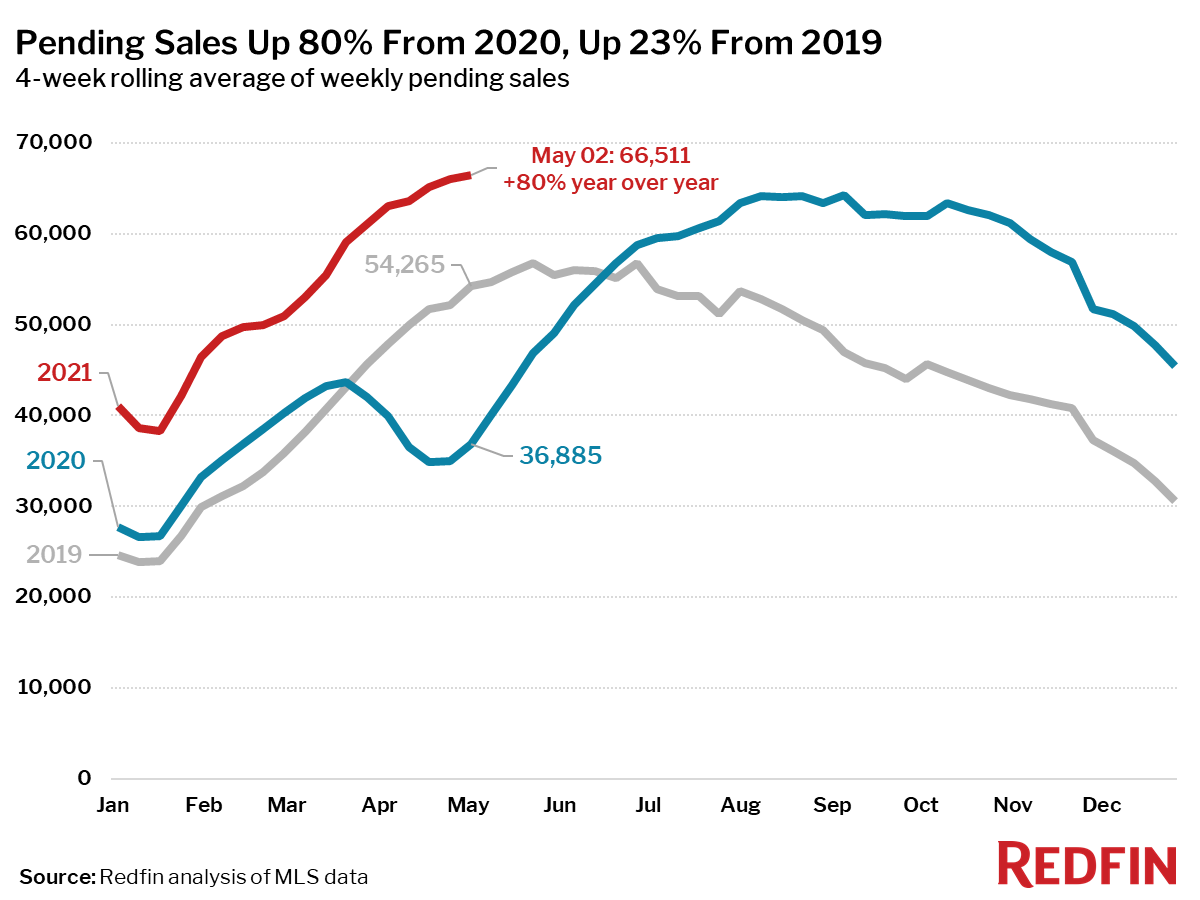
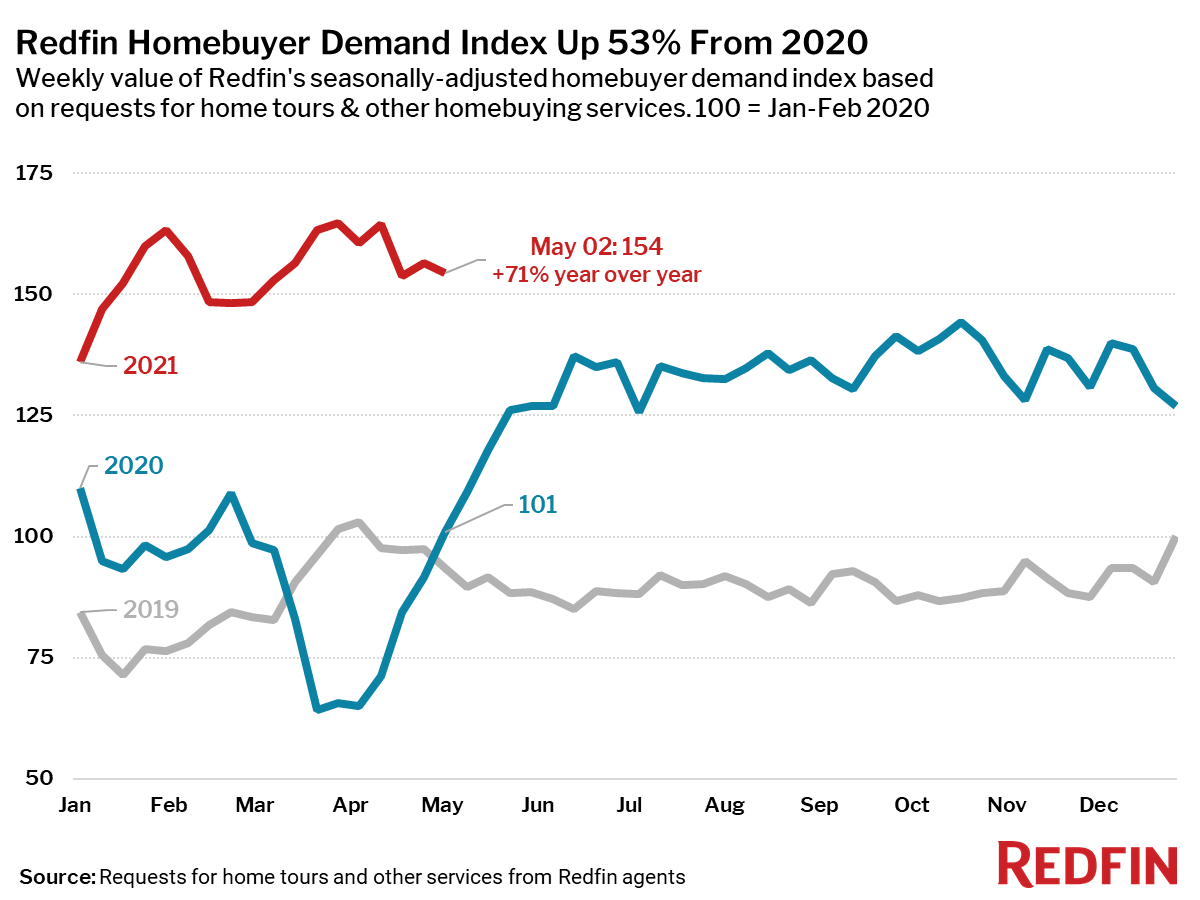
- Pending home sales were up 23% from the same period in 2019.
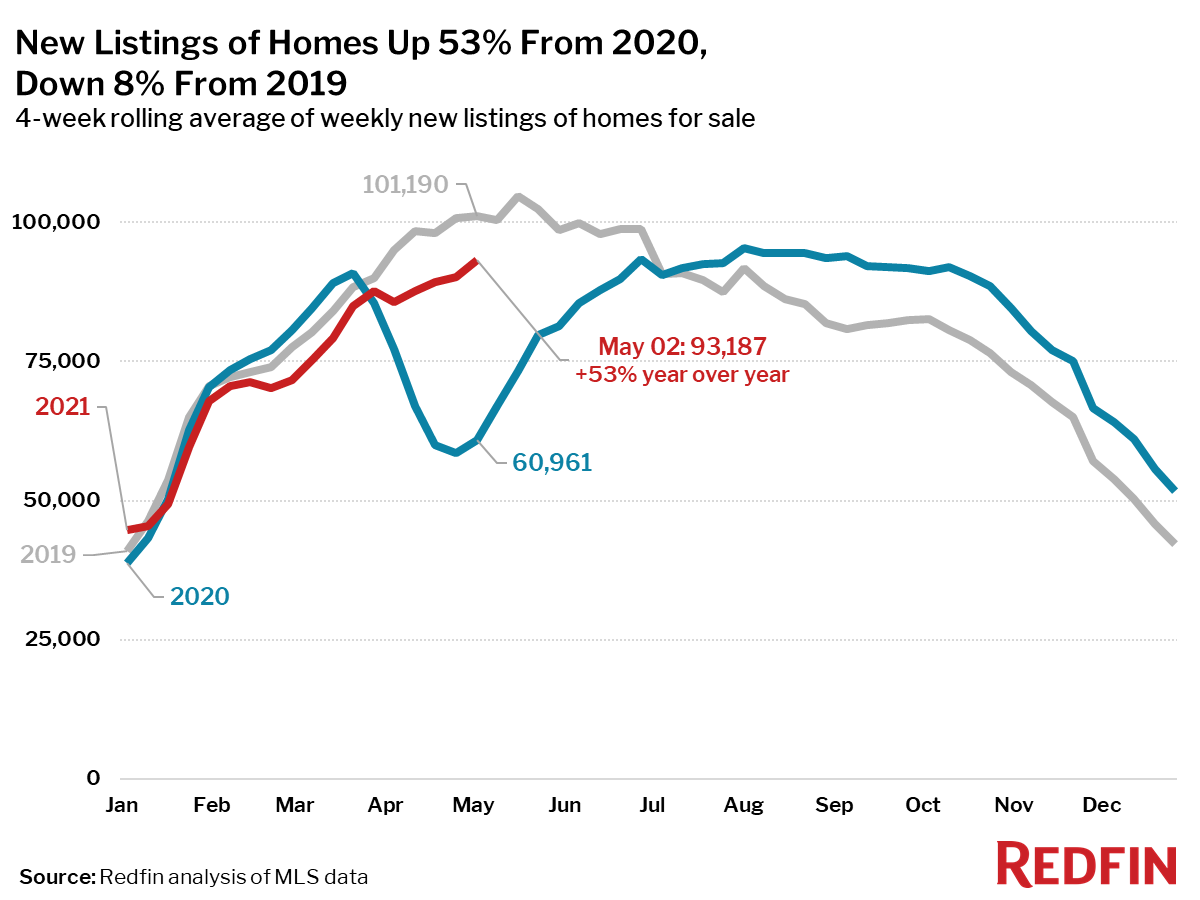
- New listings of homes for sale were down 8% from the same period in 2019. Compared to the four-week period ending April 4, new listings were up 9%, slightly larger than the 7% increase during the same period in 2019. Although new listings are still in short supply, they are following a typical seasonal pattern and showing slightly more growth than in 2019.
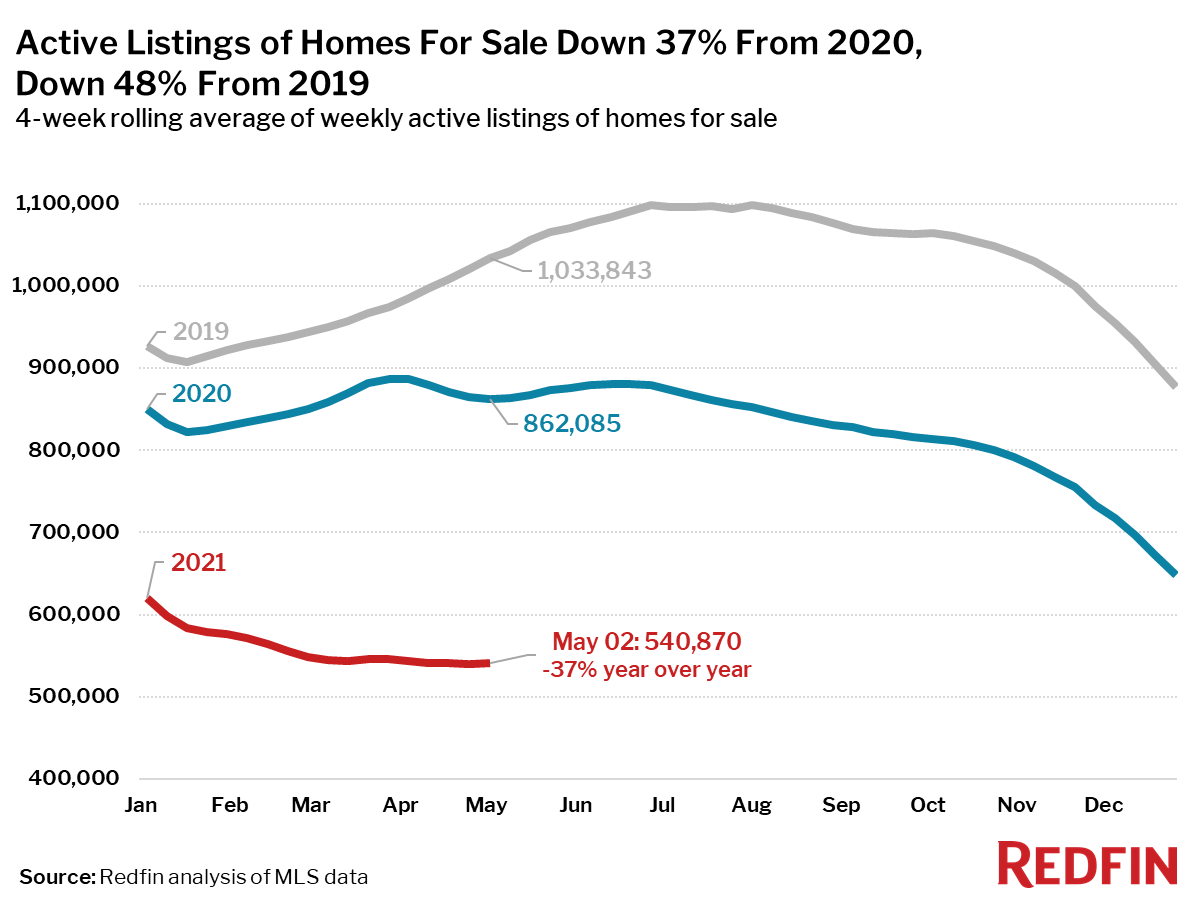
- Active listings (the number of homes listed for sale at any point during the period) fell 48% from the same period in 2019.
Mortgage purchase applications decreased 3% week over week (seasonally adjusted). For the week ending May 6, 30-year mortgage rates decreased slightly to 2.96%.
“Right now we are seeing a substantial increase in home prices, which could be a precursor to more widespread inflation throughout the economy,” said Redfin Chief Economist Daryl Fairweather. “Lumber prices are surging, which has driven up prices of new homes and indirectly drives up prices of existing homes. As states lift their pandemic restrictions, we will likely see more shortages and price increases on everything from gasoline to hotel stays and food. These price increases will likely be short-lived, but could cut into homebuyers’ budgets and ease competition enough for the housing market to become more balanced. A more balanced market could encourage more move-up homeowners to finally sell, because they won’t be so fearful about being able to find and compete for a home to buy.”
Refer to our metrics definition page for explanations of all the metrics used in this report.