Pending sales and Redfin’s Homebuyer Demand Index posted their largest year-over-year declines in over two years.
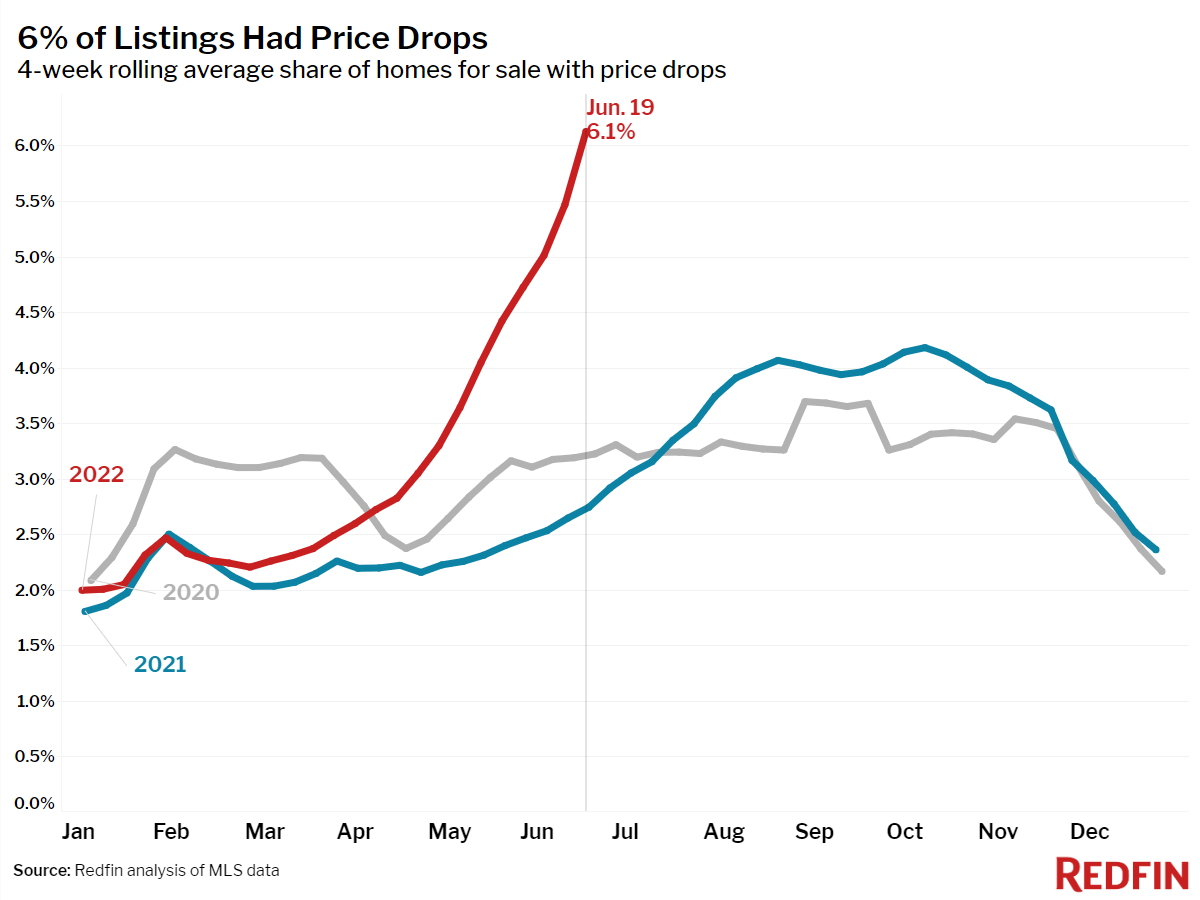
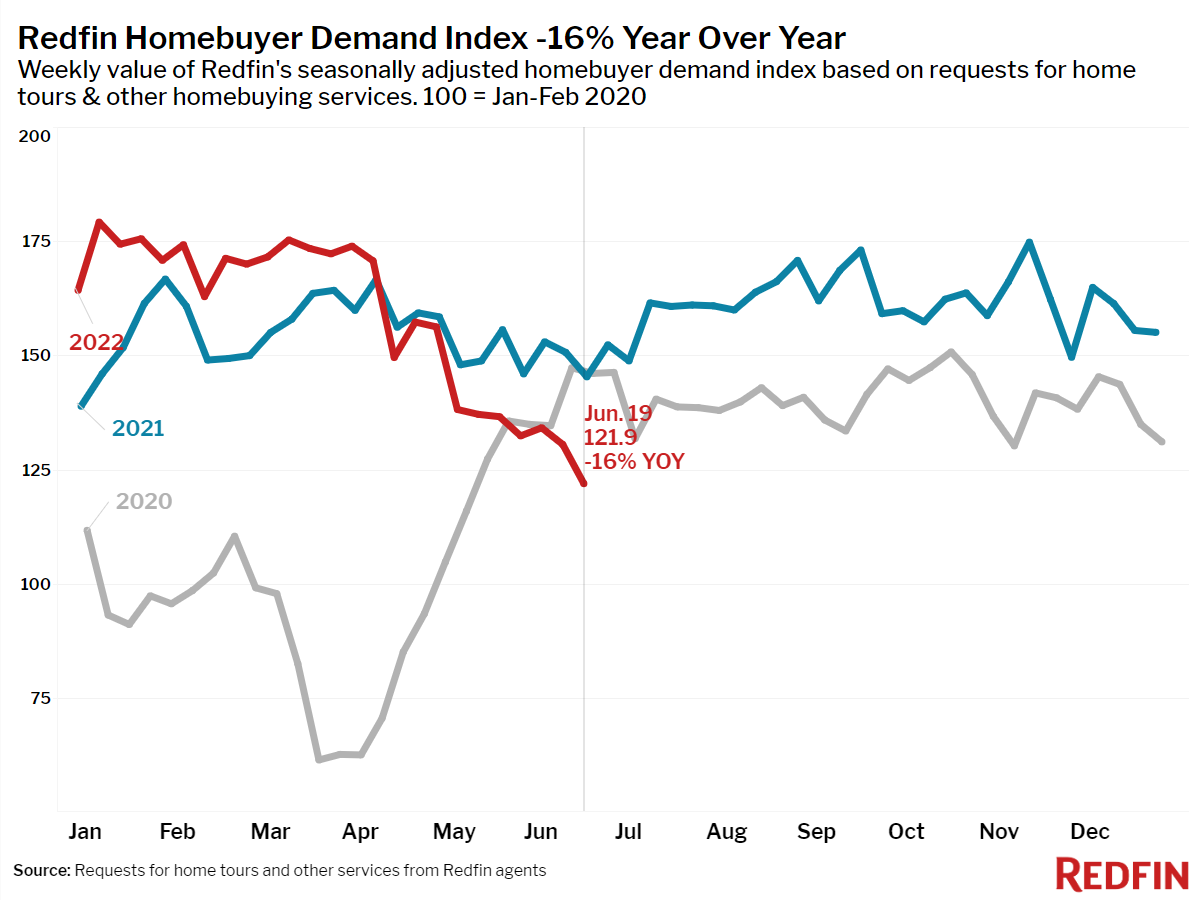
Homebuying demand pulled back further as mortgage rates reached their highest level in over 13 years. Home tours, offers and other requests for agents’ help, as measured by The Redfin Homebuyer Demand Index, posted their largest annual decline in over two years. Sellers are not holding out. The weekly share of listings with a price drop reached a new high during the four weeks ending June 19.
“Mortgage rates near 6% have put a big chill on demand for homes,” said Redfin chief economist Daryl Fairweather. “With home prices still at record highs, the affordability crisis has been dialed up to an 11 out of 10. Home sellers are aware of this as well; a record share are dropping their asking price. Even though there are fewer home sales, prices have not declined any significant amount yet. But if the housing market continues to cool, prices could fall in 2023.“
“Many home sellers have it stuck in their head that homes are selling a certain amount above asking, or that they can under-price their home to try to generate a bidding war, but that strategy isn’t working anymore,” said Boston Redfin real estate agent Robin Spangenberg. “High mortgage rates have kicked a lot of buyers right out of the market. This means sellers need to price their home at whatever they are okay walking away with, because they might only get one or two offers now.”
Leading indicators of homebuying activity:
- For the week ending June 23, 30-year mortgage rates rose to 5.81%—the highest level since November 2008.
- Fewer people searched for “homes for sale” on Google—searches during the week ending June 18 were down 14% from a year earlier.
- The seasonally-adjusted Redfin Homebuyer Demand Index—a measure of requests for home tours and other home-buying services from Redfin agents—was down 16% year over year during the week ending June 19. This was the largest decline since April 2020.
- Touring activity as of June 19 was 6% below the start of the year compared to a 24% increase at this time last year, according to home tour technology company ShowingTime.
- Mortgage purchase applications were down 10% from a year earlier, while the seasonally-adjusted index was up 8% week over week during the week ending June 17.
Key housing market takeaways for 400+ U.S. metro areas:
Unless otherwise noted, the data in this report covers the four-week period ending June 19. Redfin’s housing market data goes back through 2012.
Data based on homes listed and/or sold during the period:
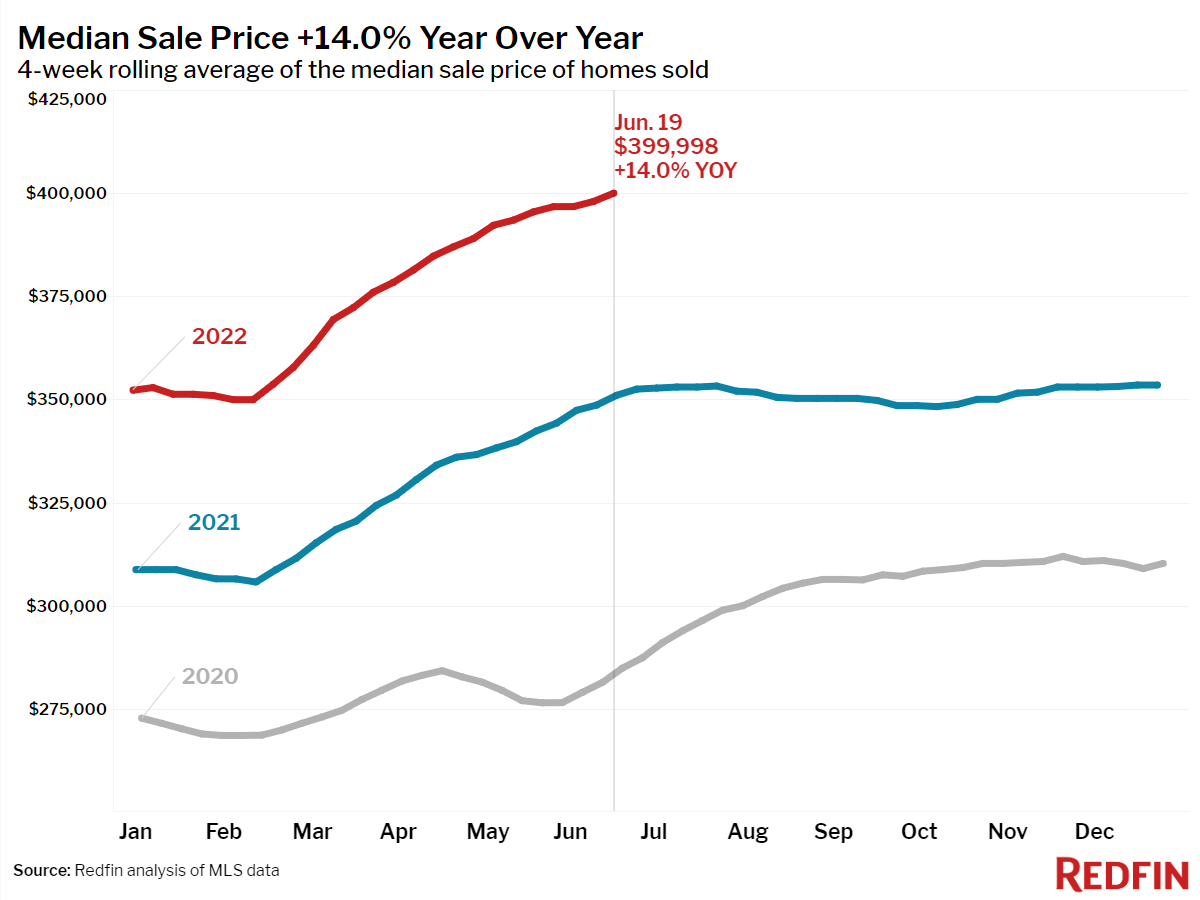
- The median home sale price was up 14% year over year to a record $399,998.
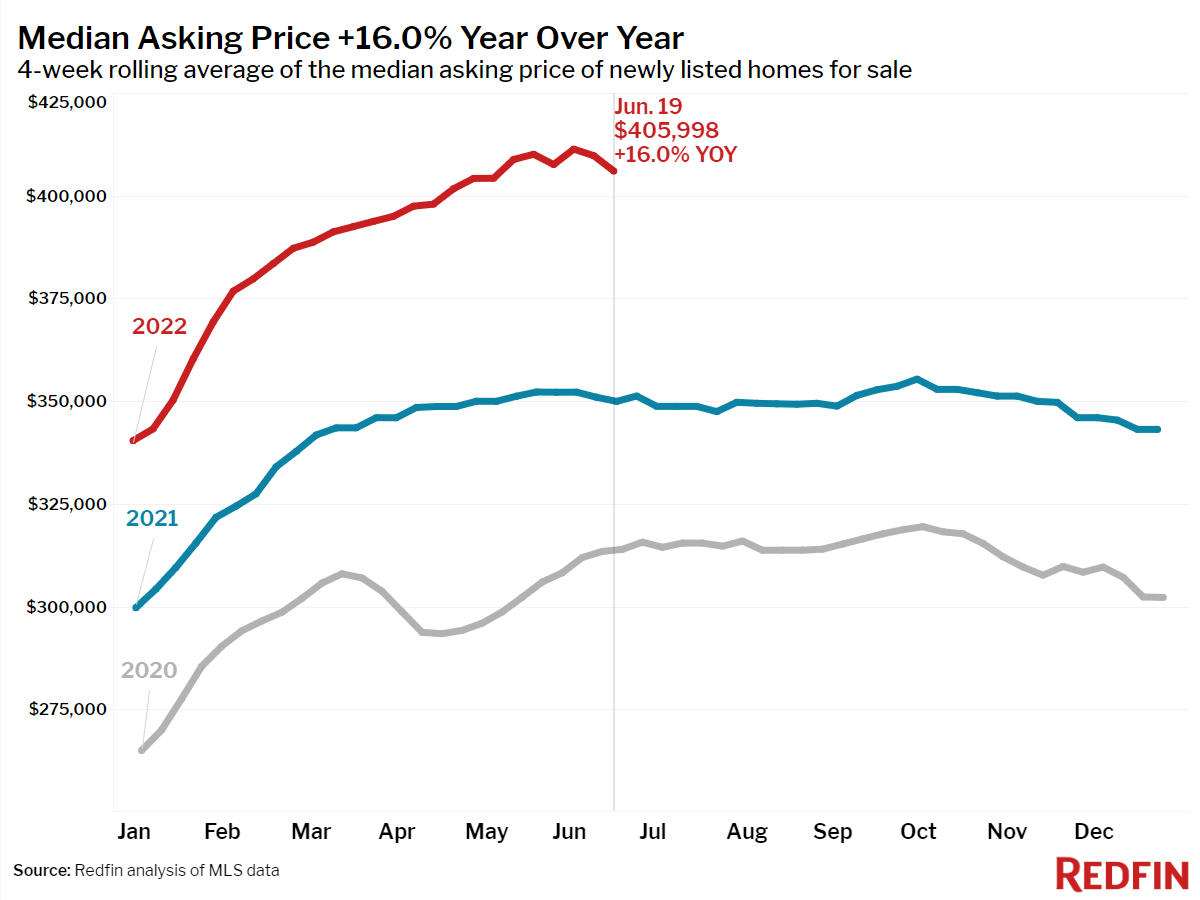
- The median asking price of newly listed homes increased 16% year over year to $405,998.
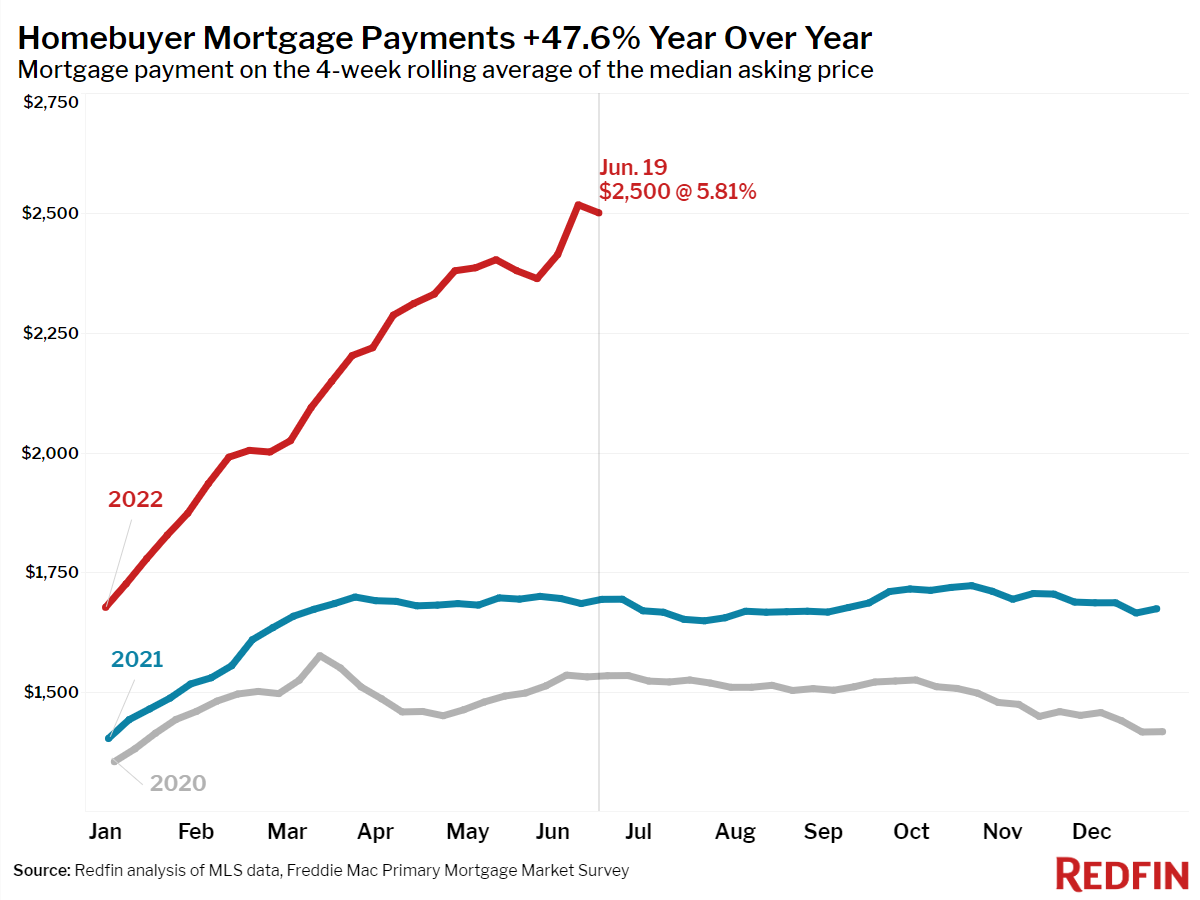
- The monthly mortgage payment on the median asking price home increased to $2,500 at the current 5.81% mortgage rate. This was up 48% from $1,693 a year earlier, when mortgage rates were 3.02%.
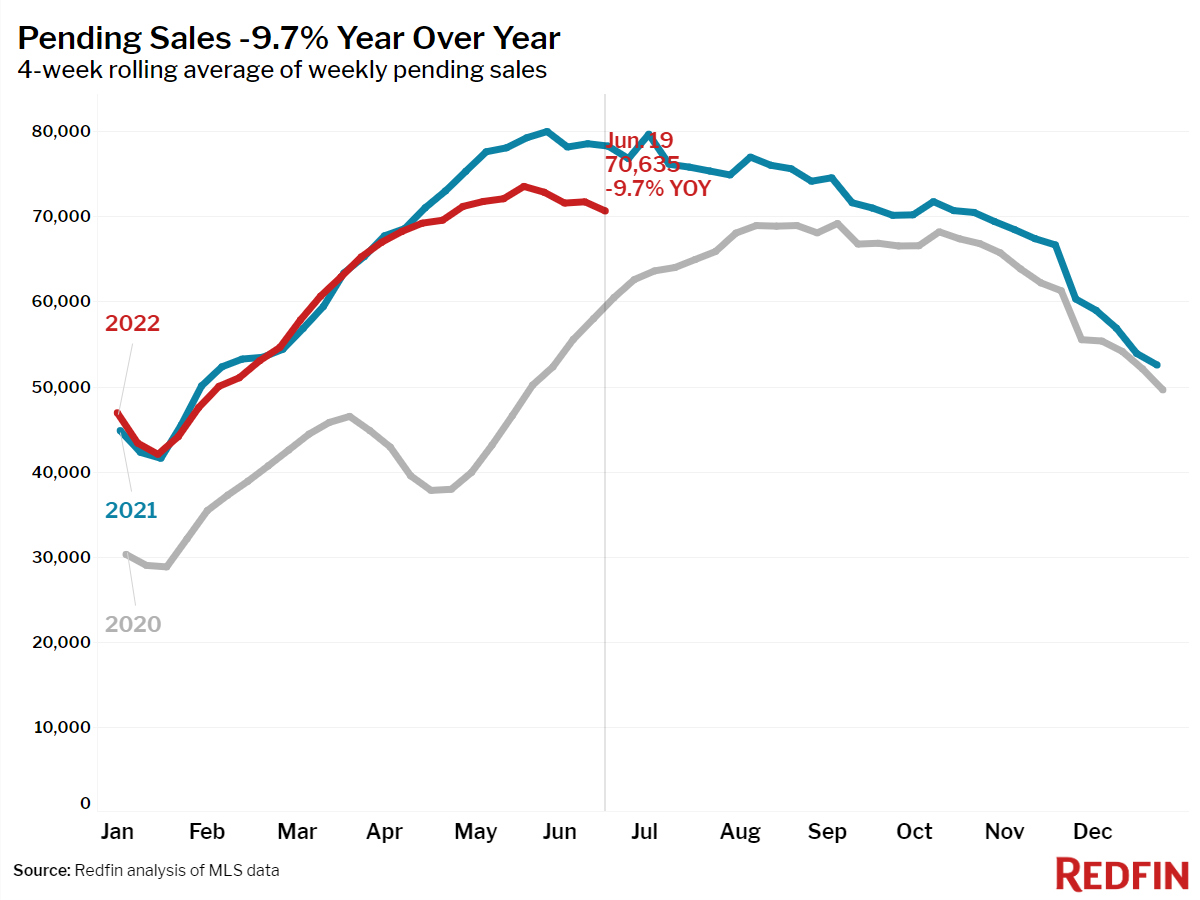
- Pending home sales were down 10% year over year, the largest decline since May 2020.
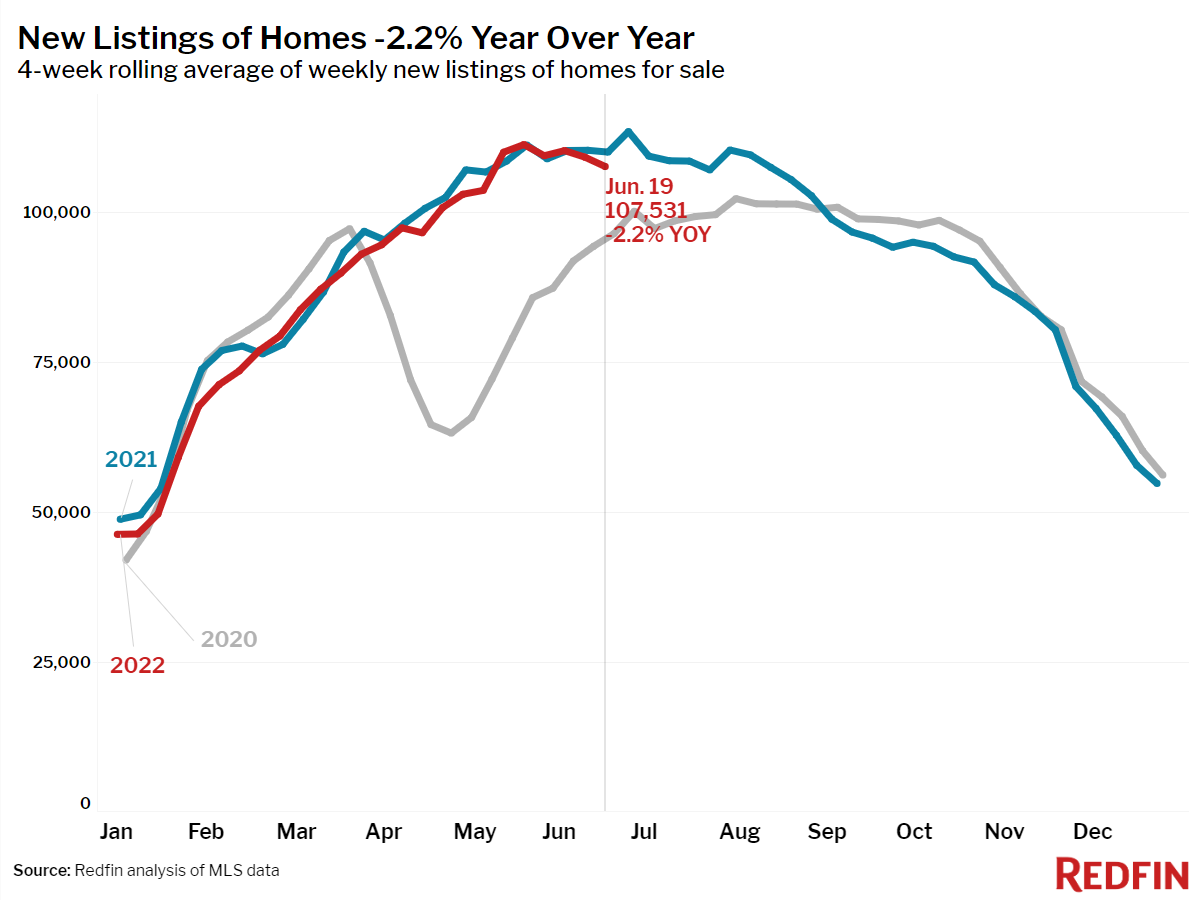
- New listings of homes for sale were down 2% from a year earlier.
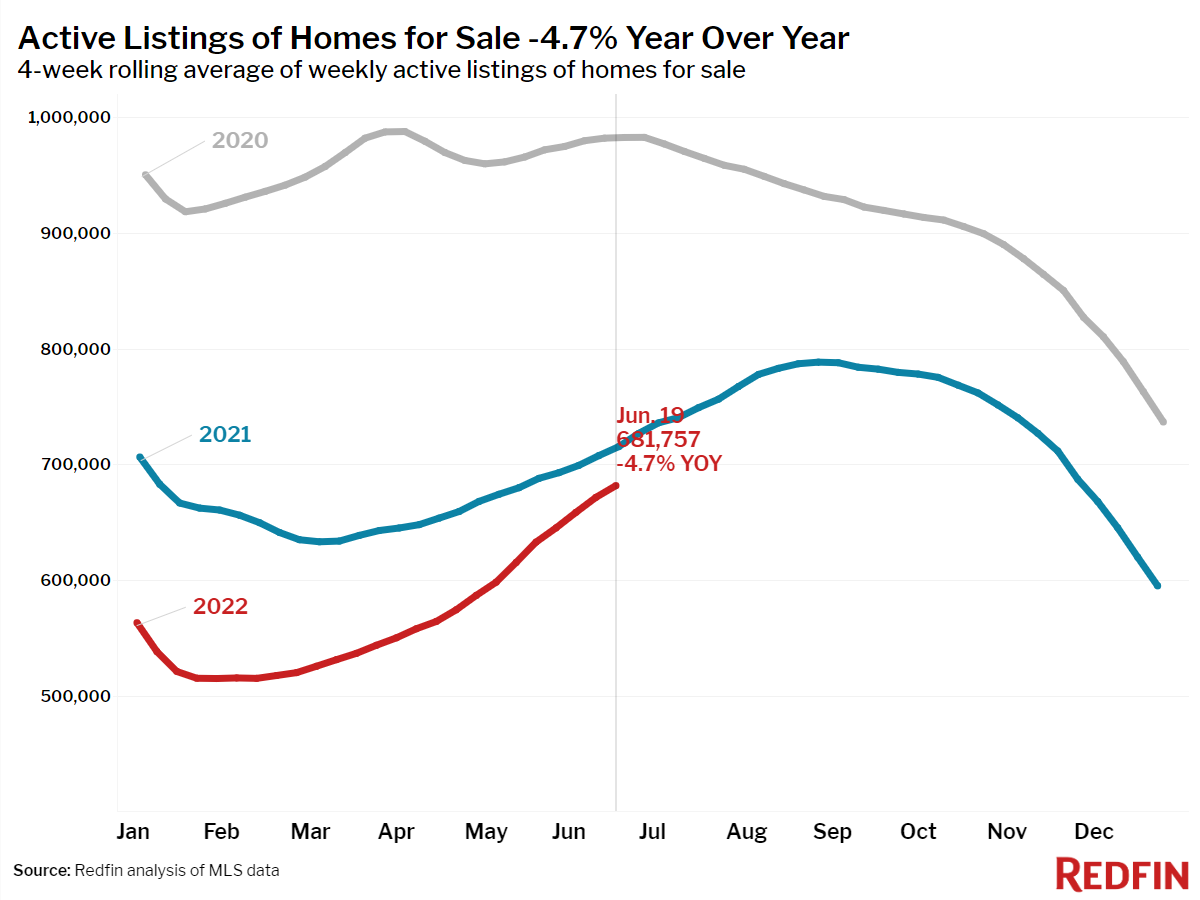
- Active listings (the number of homes listed for sale at any point during the period) fell 5% year over year—the smallest decline since December 2019.
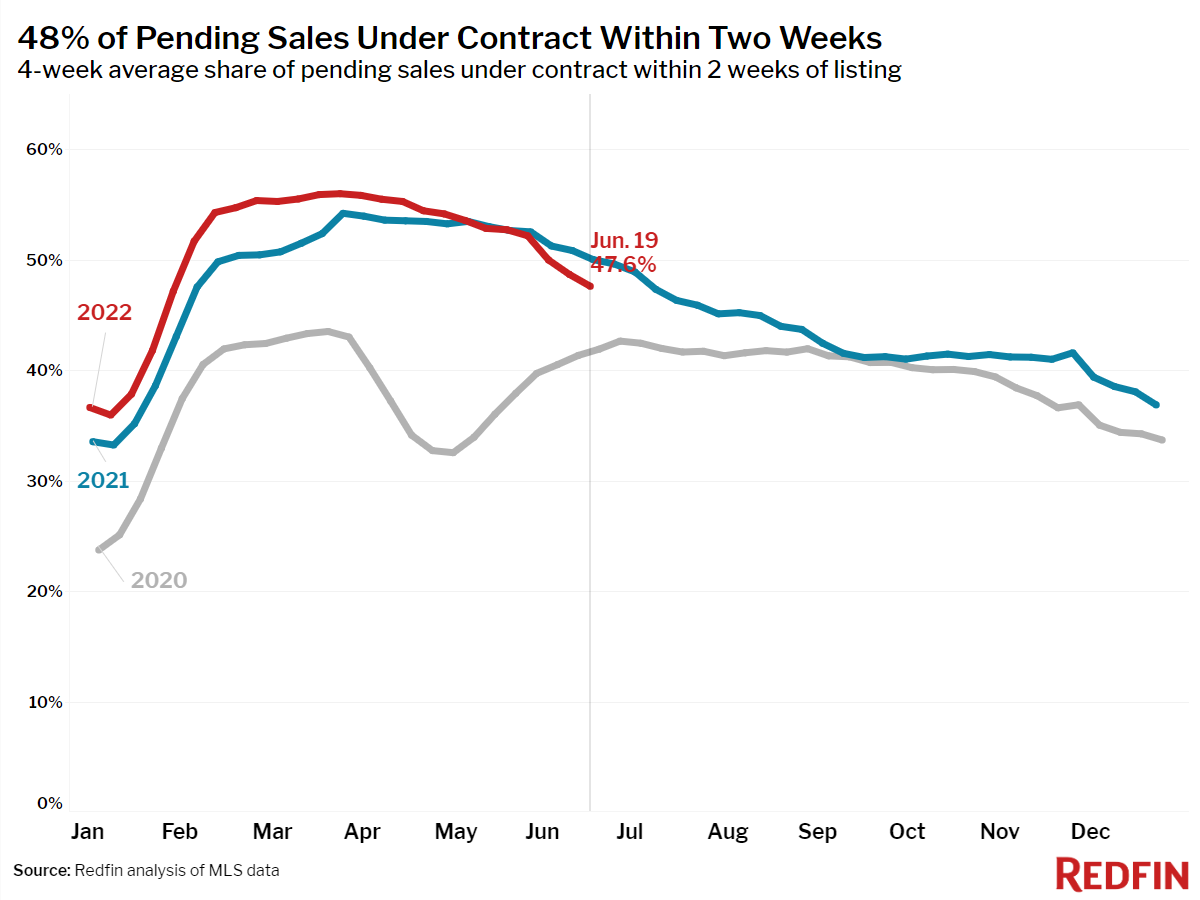
- 48% of homes that went under contract had an accepted offer within the first two weeks on the market, down from 50% a year earlier.
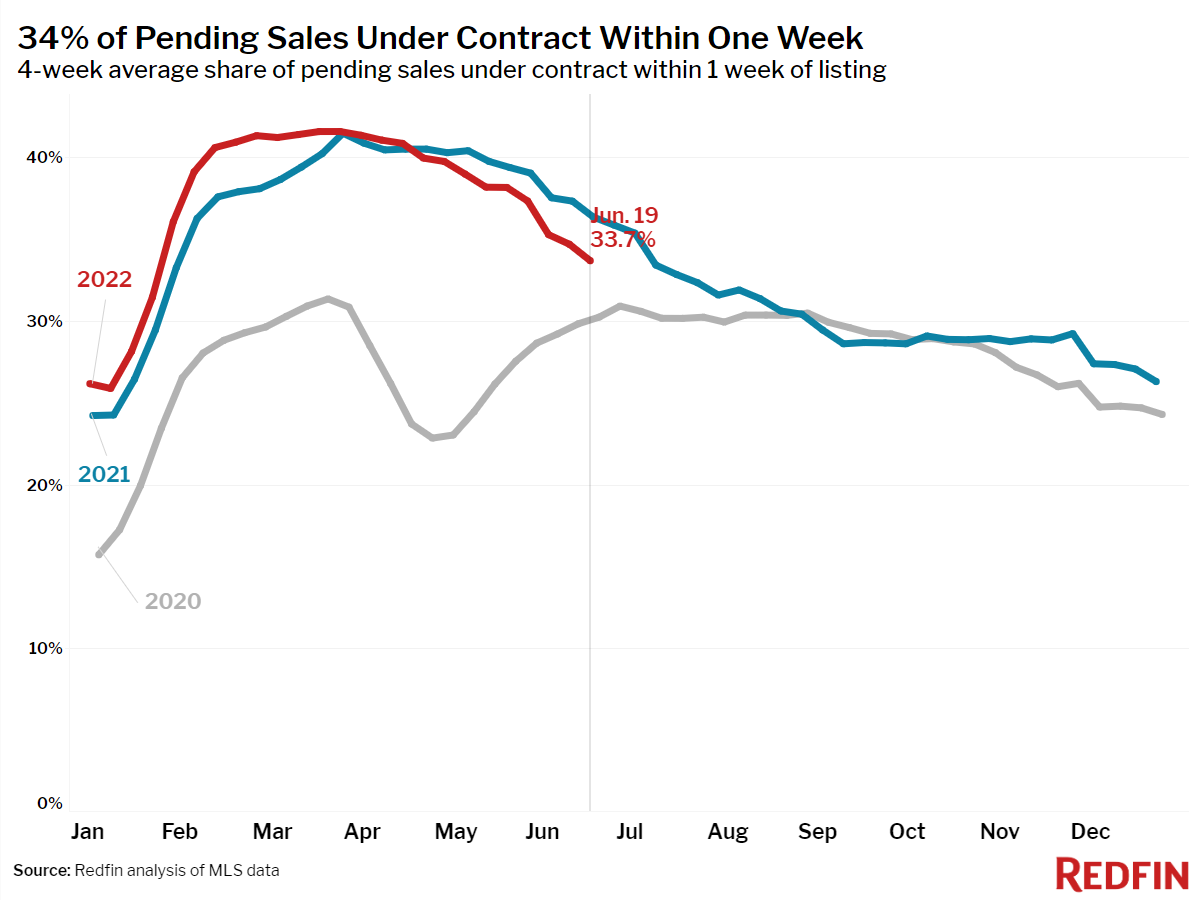
- 34% of homes that went under contract had an accepted offer within one week of hitting the market, down from 36% a year earlier.
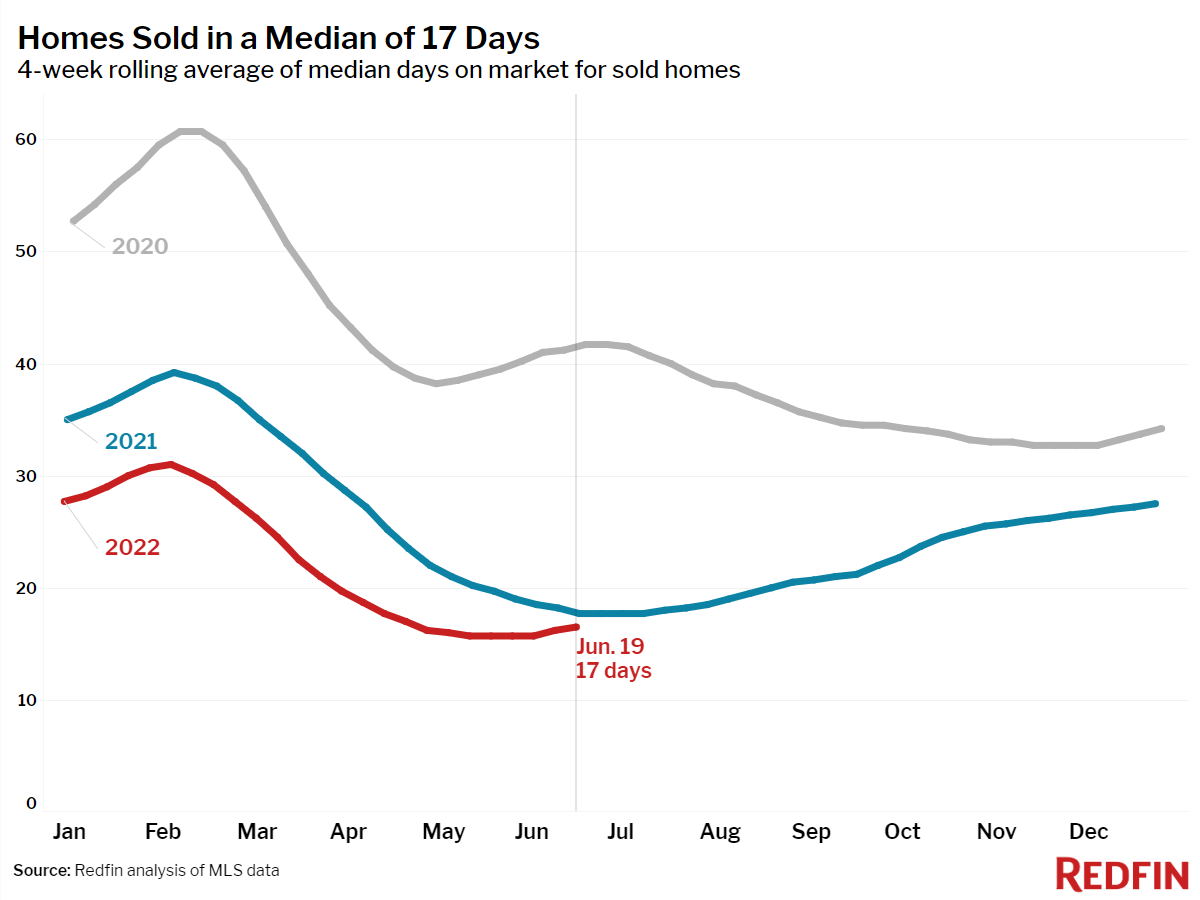
- Homes that sold were on the market for a median of 17 days, down from 18 days a year earlier and up slightly from the record low of 15 days set in May and early June.
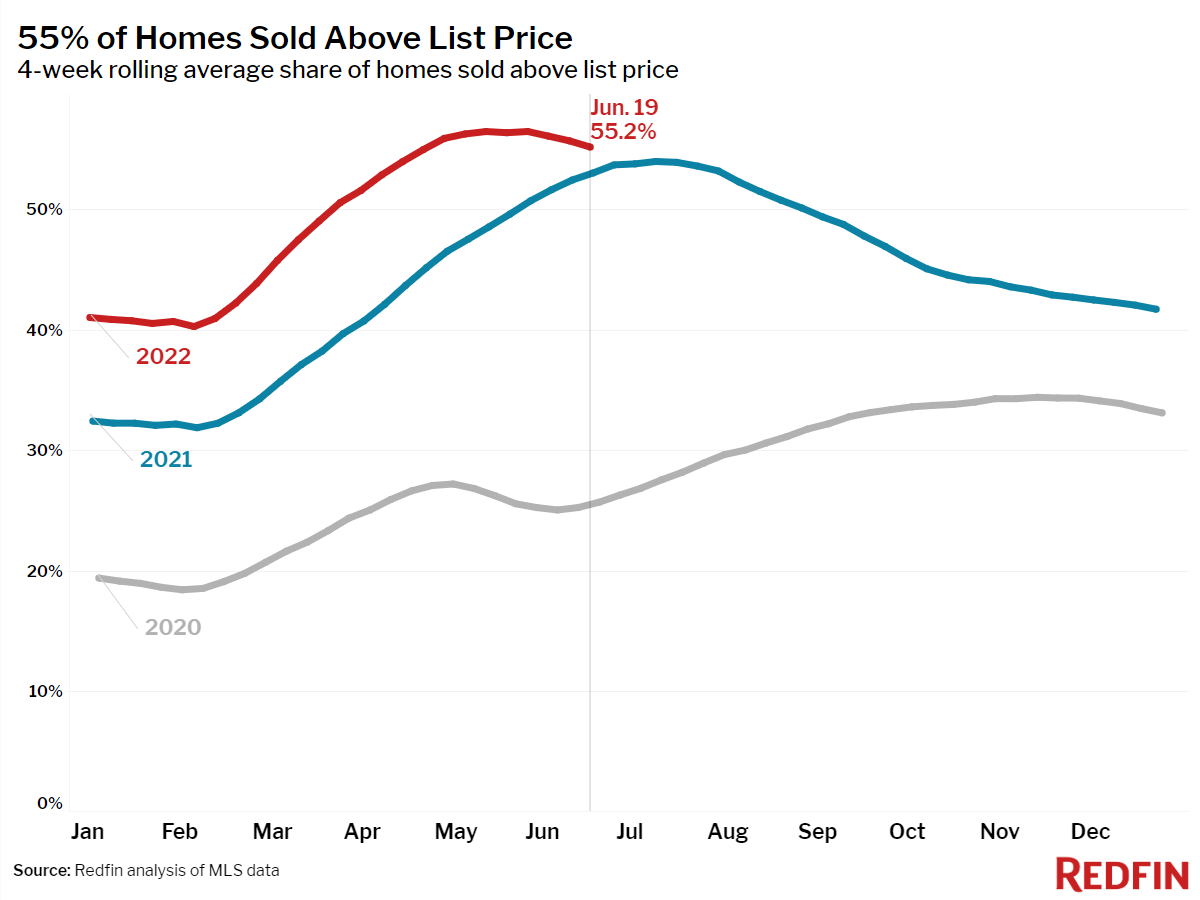
- 55% of homes sold above list price, up from 53% a year earlier.
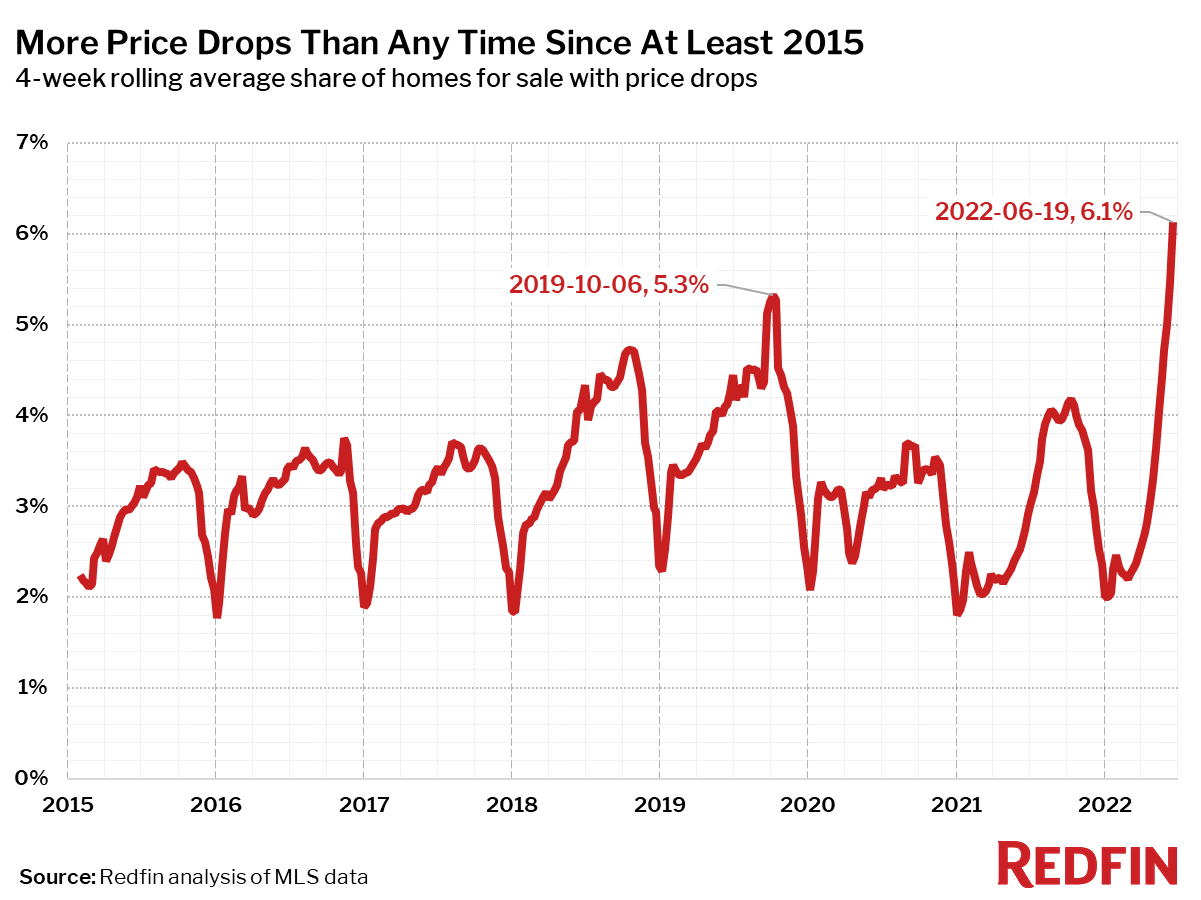
- On average, 6.1% of homes for sale each week had a price drop, a record high as far back as the data goes, through the beginning of 2015.
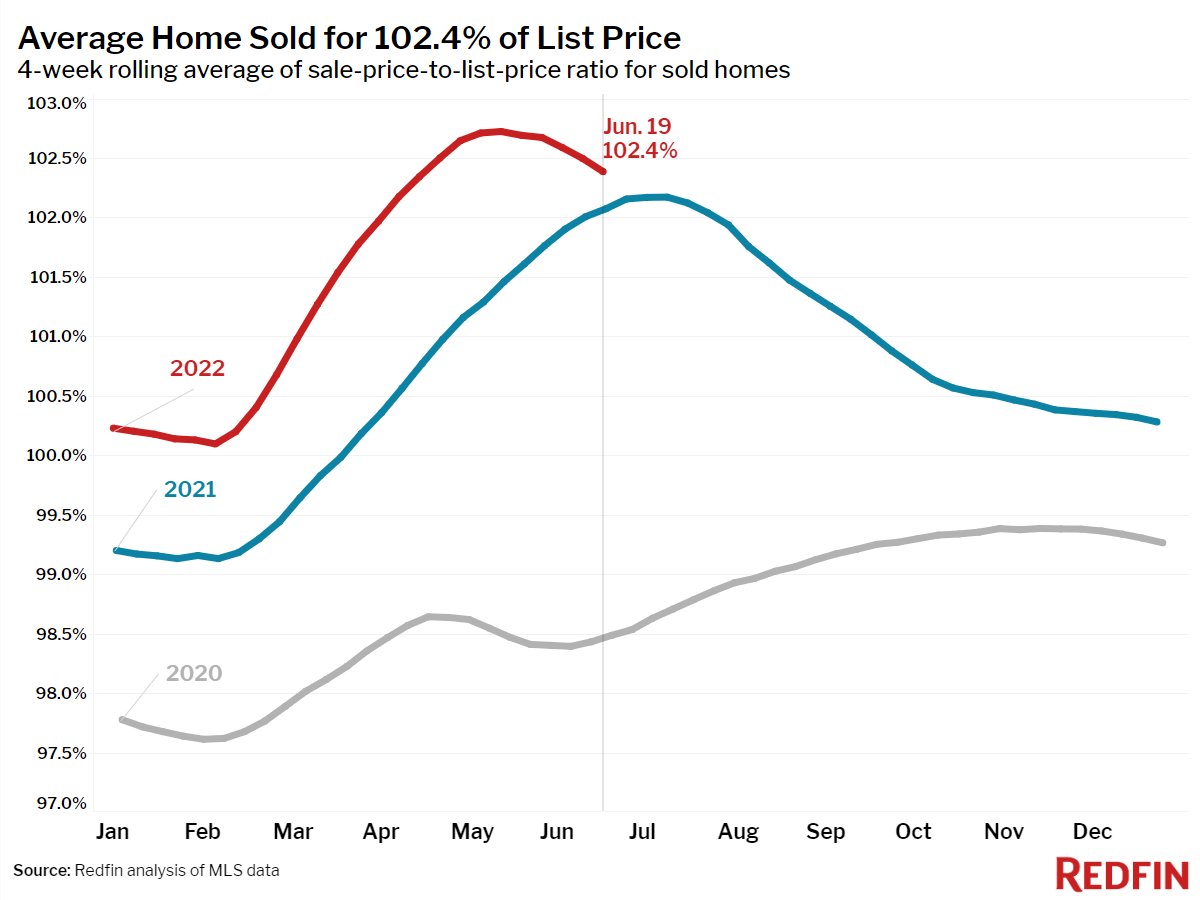
- The average sale-to-list price ratio, which measures how close homes are selling to their asking prices, declined just slightly to 102.4%. In other words, the average home sold for 2.4% above its asking price. This was up from 102.1% a year earlier.
Refer to our metrics definition page for explanations of all the metrics used in this report.