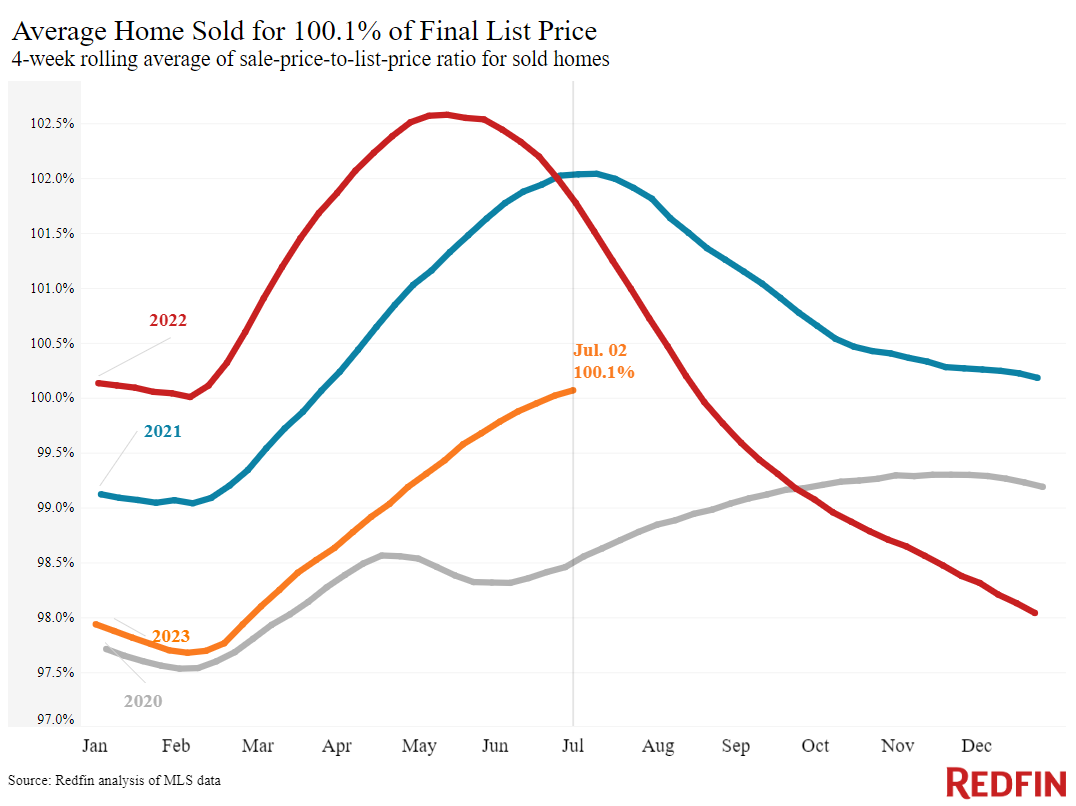
This is the first time since last August the average sale-to-list price ratio has surpassed 100%. Low inventory and steady demand are buoying home prices.
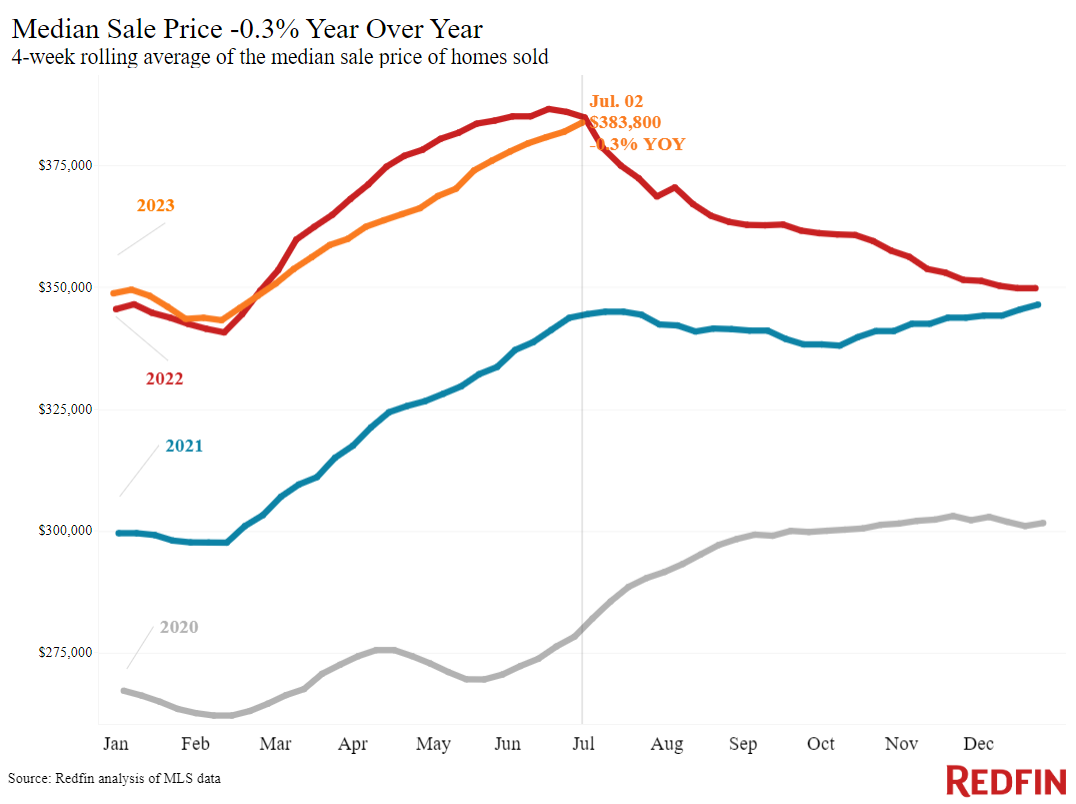
The average sale-to-list price ratio hit 100.1% during the four weeks ending July 2, marking the first time in nearly a year the average U.S. home is selling for more than its asking price. Additionally, the median home-sale price was down just $1,000 (-0.3%) from a year ago, when prices were near record highs. Stubbornly high home prices, combined with near-7% mortgage rates, are standing in the way of homebuyers, who are faced with near-record-high monthly housing payments.
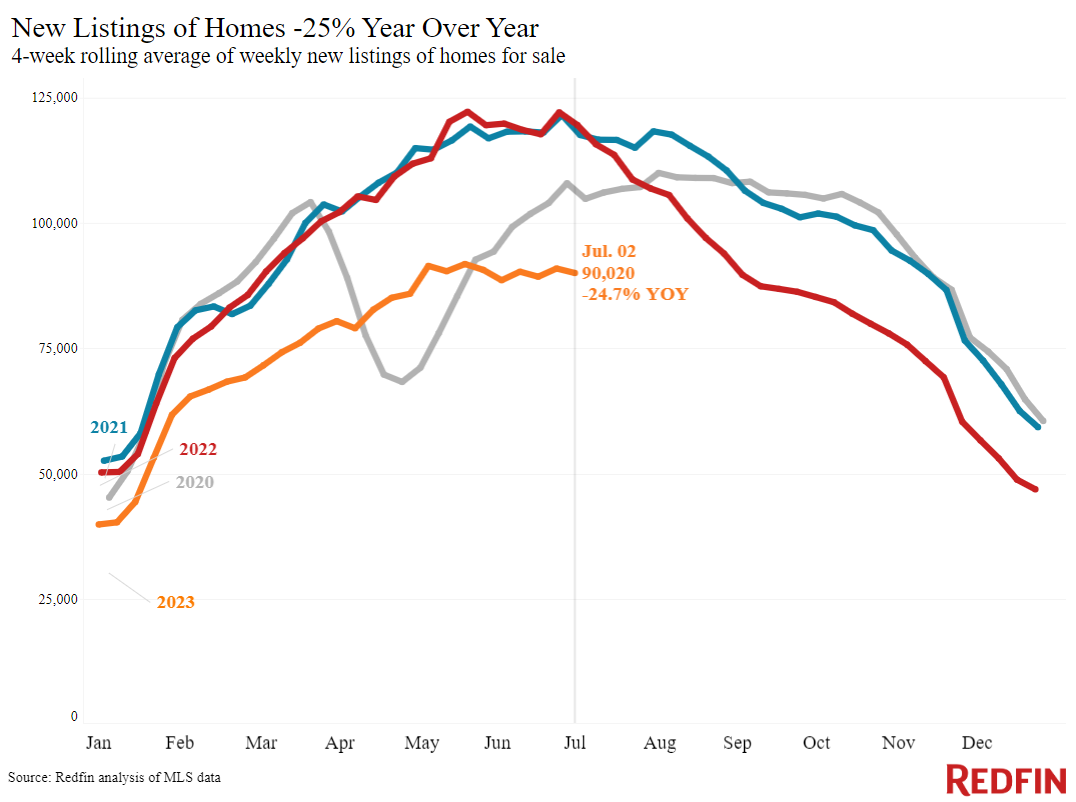
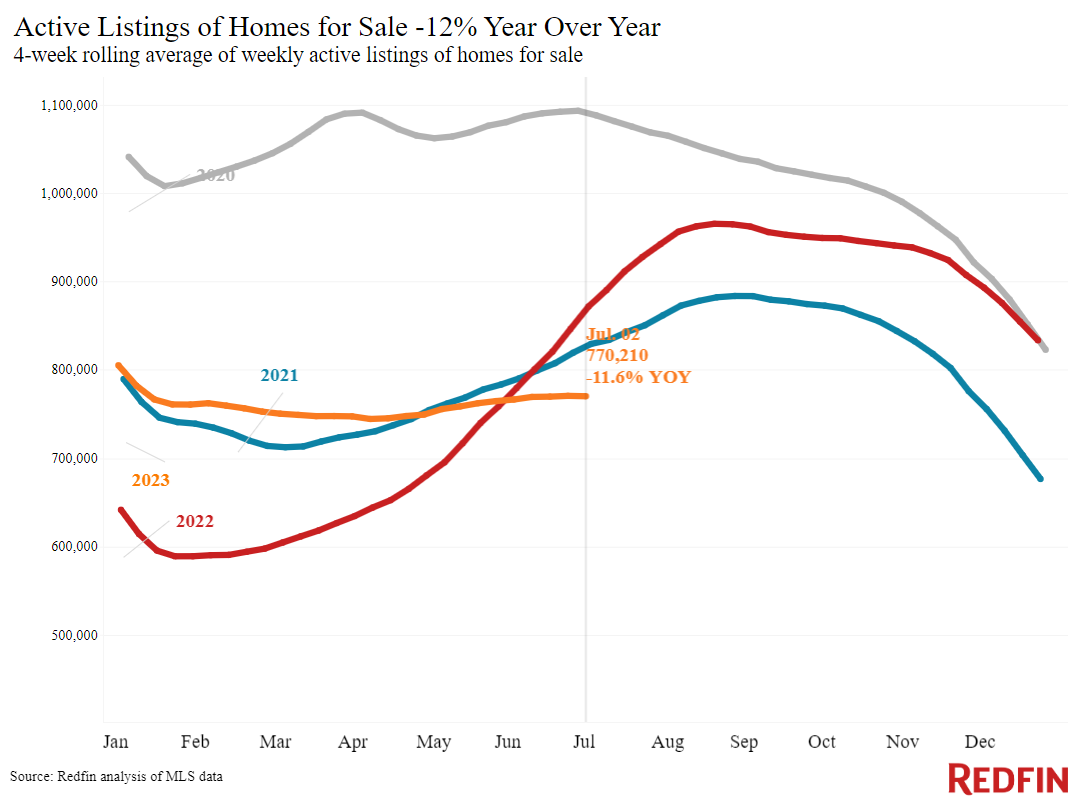
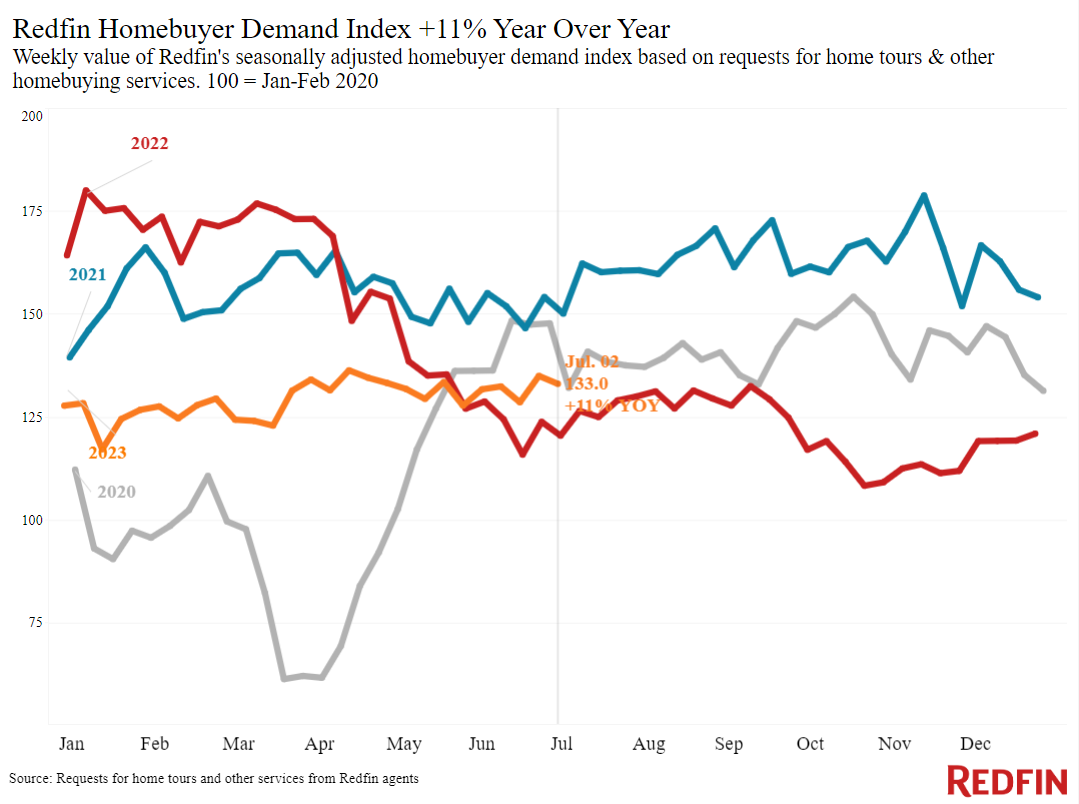
A lack of homes for sale is the main reason homes are selling above their asking price, with new listings down 25% from a year ago and the total number of homes for sale down 12% as homeowners hang onto relatively low mortgage rates. Despite the double dilemma of low inventory and high prices, early-stage homebuyer demand is picking up. Redfin’s Homebuyer Demand Index–a measure of requests for home tours and other buying services from Redfin agents–is up 4% from a month earlier and near its highest level in over a year.
“Almost every home is getting multiple offers and selling over asking price,” said Portland, OR Redfin agent Jeremy Lucas. “The lack of supply is making it feel almost like 2021 all over again, but higher rates mean bidding wars are happening more in the $500,000 range than the $700,000 range because people can afford less. I’m advising buyers to shop a little under their price range so they can make a strong offer.”
Leading indicators of homebuying activity:
- The daily average 30-year fixed mortgage rate was 7.08% on July 5, down just slightly from a half-year high of 7.14% a month earlier. For the week ending June 29, the average 30-year fixed mortgage rate was 6.71%, up slightly from the week earlier but down slightly from the eight-month high of 6.79% hit at the beginning of the month.
- Mortgage-purchase applications during the week ending June 23 rose 3% from a week earlier, seasonally adjusted. That’s the most recent week for which data is available. Purchase applications were down 21% from a year earlier.
- The seasonally adjusted Redfin Homebuyer Demand Index–a measure of requests for home tours and other homebuying services from Redfin agents–was down slightly from the week earlier but still near its highest level since May 2022 during the week ending July 2. It was up 11% from a year earlier, the sixth consecutive annual increase. Demand was dropping at this time in 2022 as mortgage rates rose.
- Google searches for “homes for sale” were up 5% from a month earlier during the week ending July 1, and down about 9% from a year earlier.
- Touring activity as of July 2 was up 6% from the start of the year, compared with an 11% decrease at the same time last year, according to home tour technology company ShowingTime. Tours increased slowly during this time last year as mortgage rates shot up.
Key housing market takeaways for 400+ U.S. metro areas:
Unless otherwise noted, the data in this report covers the four-week period ending July 2. Redfin’s weekly housing market data goes back through 2015.
Data based on homes listed and/or sold during the period:
For bullets that include metro-level breakdowns, Redfin analyzed the 50 most populous U.S. metros. Select metros may be excluded from time to time to ensure data accuracy.
- The median home sale price was $383,800, down just $1,000 (-0.3%) from a year earlier. That’s the first time since March prices haven’t declined at least 1% on a year-over-year basis.
- Home-sale prices declined in 22 metros, with the biggest drops in Austin, TX (-9.8% YoY), Las Vegas (-7.6%), Detroit (-6%), Oakland, CA (-5.9%) and Fort Worth, TX (-5.7%). Price declines are shrinking in many metros, largely because prices were posting an unseasonal decline at this time last year.
- Sale prices increased most in Milwaukee (11.2%), Providence, RI (8%), Newark, NJ (6.3%), Miami (6.2%) and West Palm Beach, FL (5.5%).
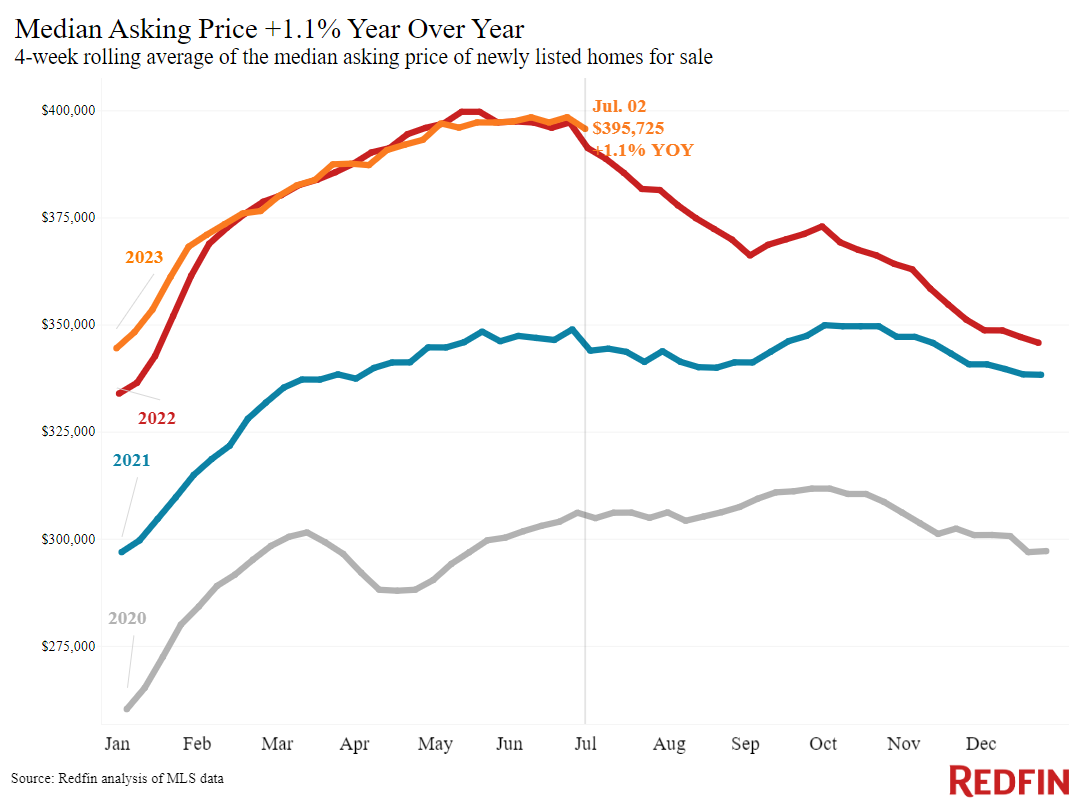
- The median asking price of newly listed homes was $395,725, up 1.1% from a year earlier. Asking prices have been increasing for a month.
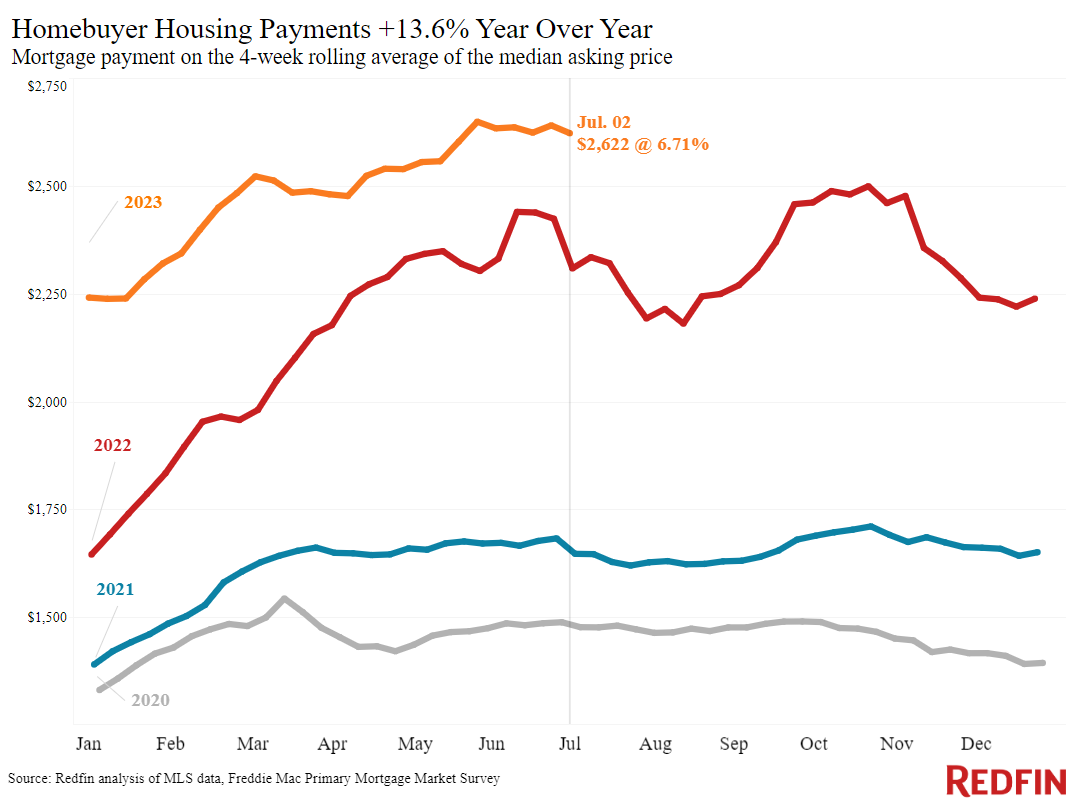
- The monthly mortgage payment on the median-asking-price home was $2,622 at a 6.71% mortgage rate, the average for the week ending June 29. That’s down slightly from the record high hit about a month earlier, but up 14% ($313) from a year earlier.
- Pending home sales were down 14.2% year over year, continuing a year-plus streak of double-digit declines.
- Pending home sales fell in all but one of the metros Redfin analyzed. They declined most in Providence (-22.7%), Milwaukee (-21.8%), Warren, MI (-21.2%), Boston (-20.5%) and Newark, NJ (-20.5%). They increased 2.6% in Austin.
- New listings of homes for sale fell 24.7% year over year, one of the biggest declines since May 2020.
- New listings declined in all metros Redfin analyzed. They fell most in Las Vegas (-47.5% YoY), Phoenix (-41.1%), Riverside, CA (-36%), Oakland (-34.9%) and New Brunswick, NJ (-34.8%).
- Active listings (the number of homes listed for sale at any point during the period) dropped 11.6% from a year earlier, the biggest drop since April 2022. Active listings were essentially flat from a month earlier; typically, they post month-over-month increases at this time of year.
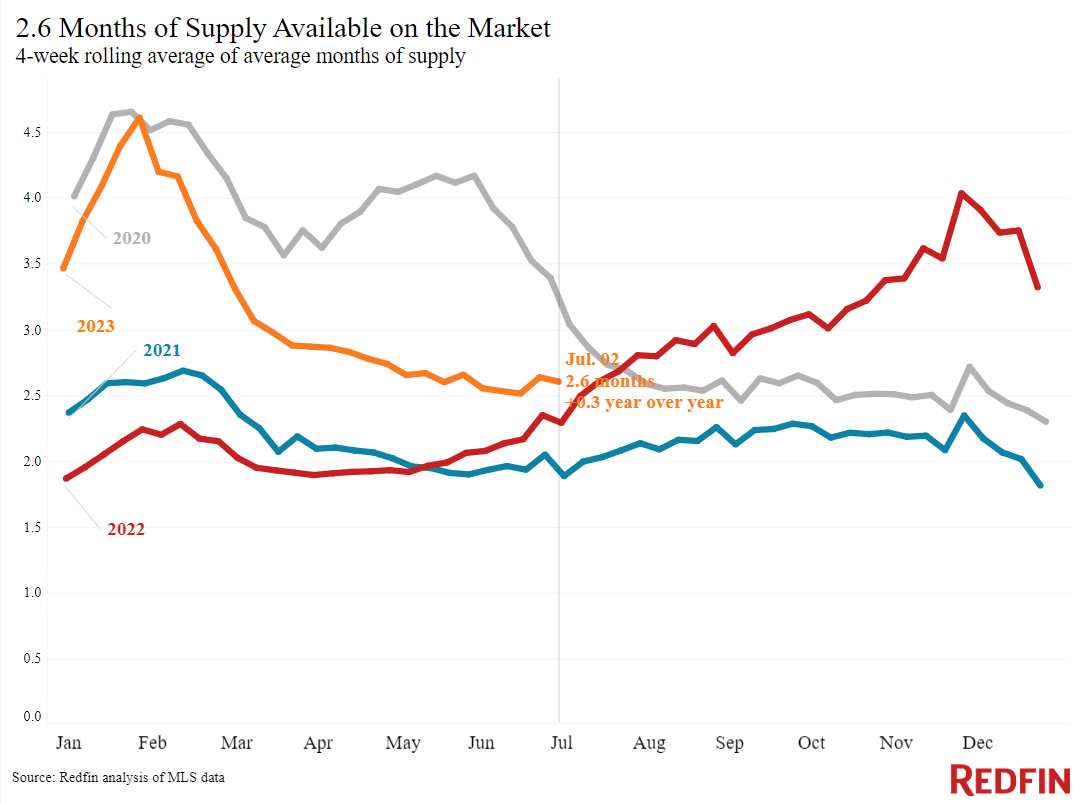
- Months of supply—a measure of the balance between supply and demand, calculated by the number of months it would take for the current inventory to sell at the current sales pace—was 2.6 months, near the lowest level in a year. Four to five months of supply is considered balanced, with a lower number indicating seller’s market conditions.
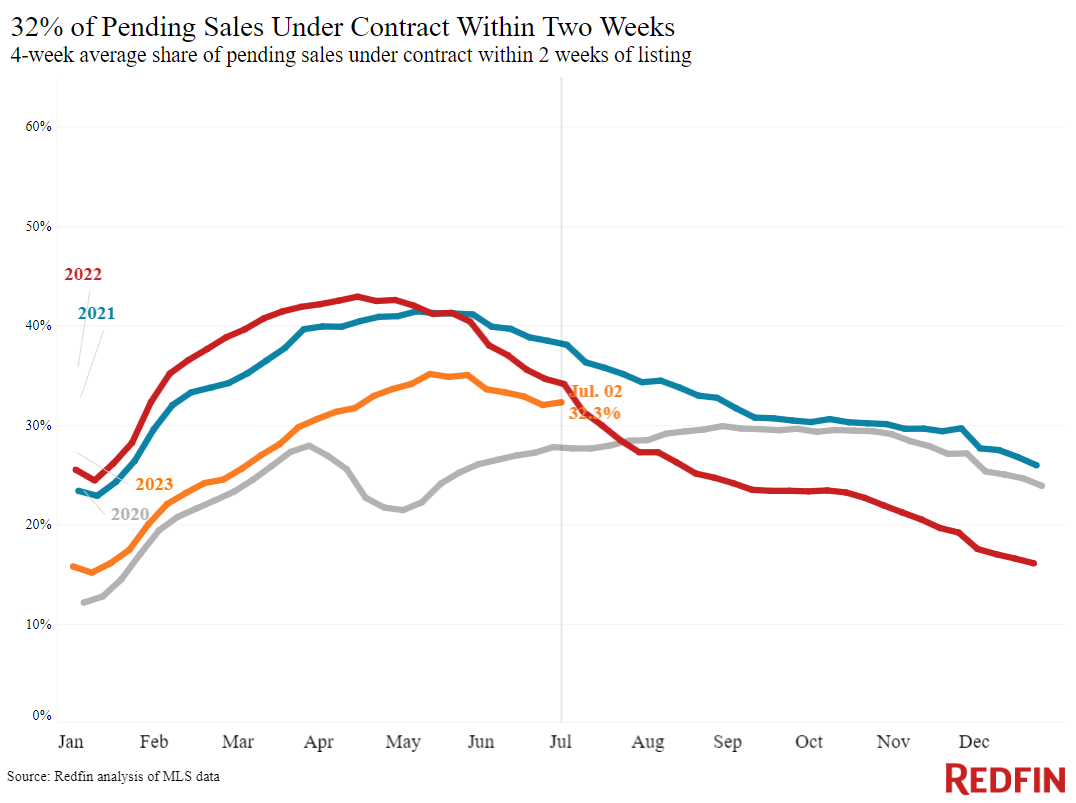
- 32.3% of homes that went under contract had an accepted offer within the first two weeks on the market, down from 34% a year earlier.
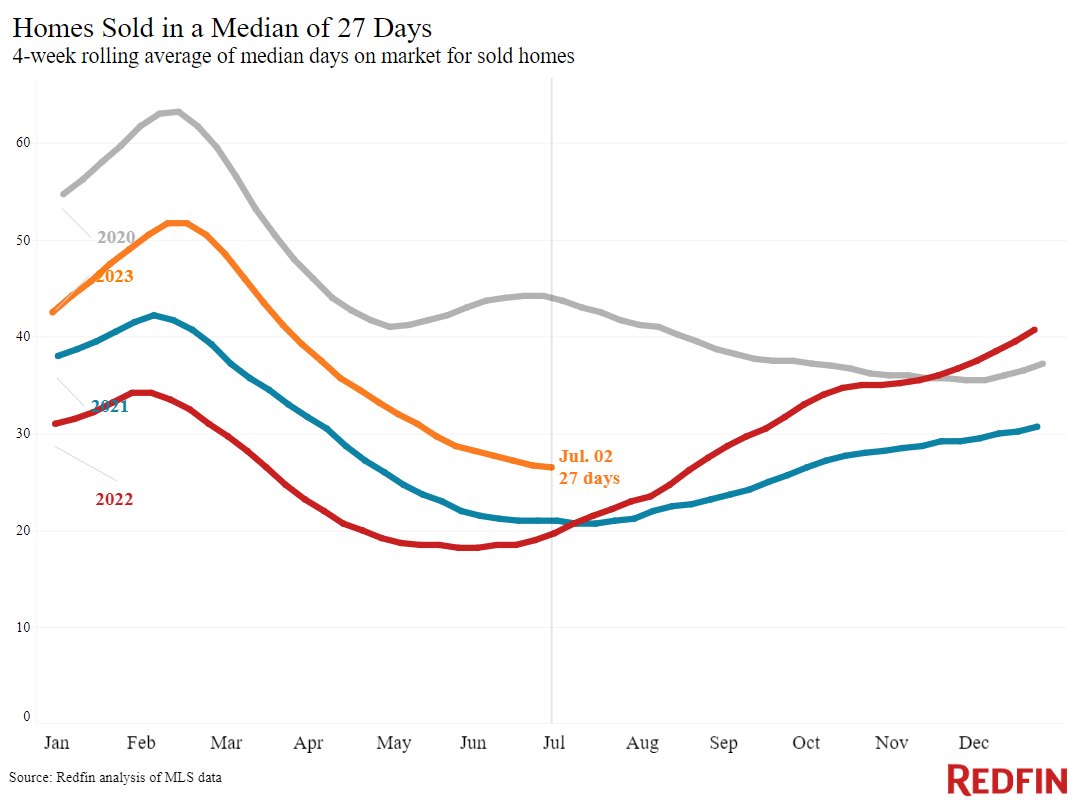
- Homes that sold were on the market for a median of 27 days, the shortest span in 10 months. That’s up from 20 days a year earlier.
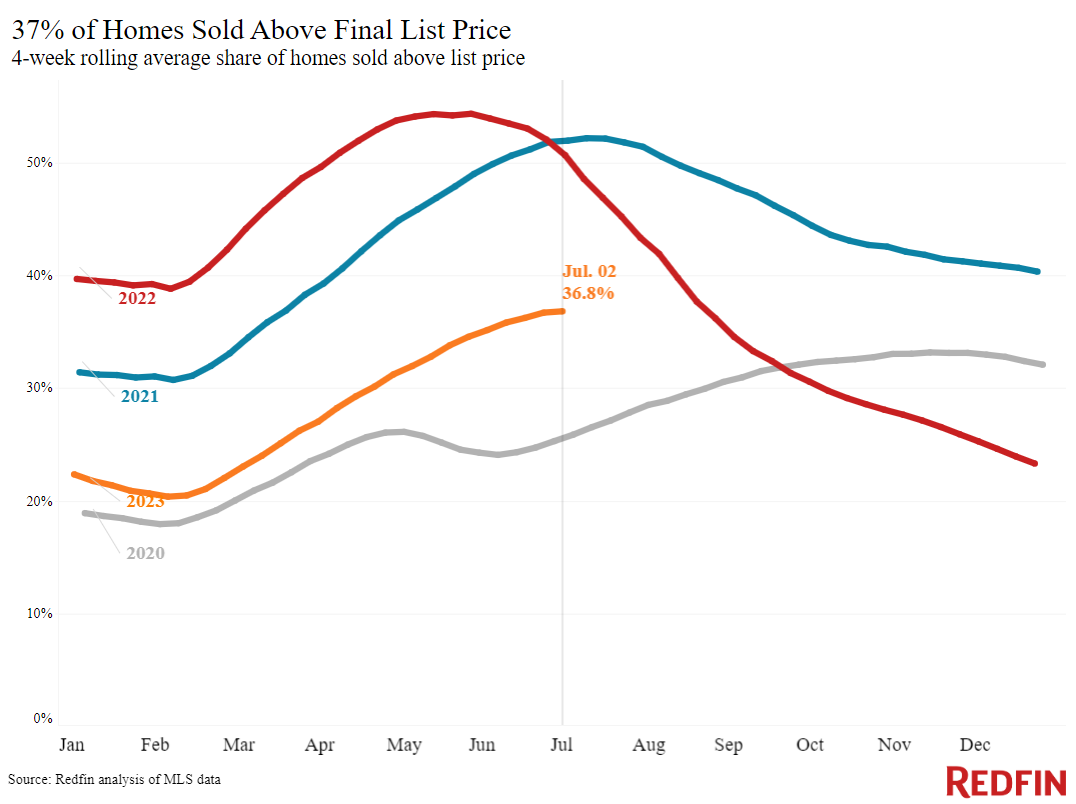
- 36.8% of homes sold above their final list price. That’s the highest share in 10 months but is down from 51% a year earlier.
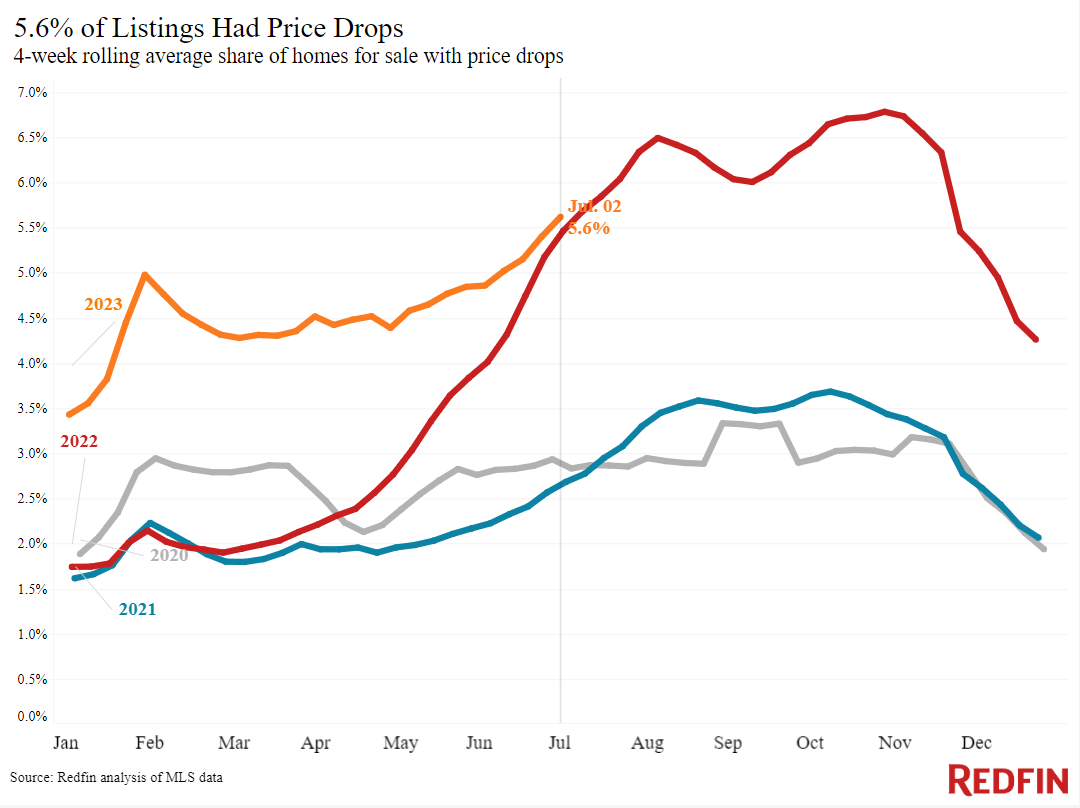
- On average, 5.6% of homes for sale each week had a price drop, essentially the same as the 5.5% rate a year earlier.
- The average sale-to-list price ratio, which measures how close homes are selling to their final asking prices, was 100.1%. That marks the first time in nearly a year that the typical home is selling above its asking price, on average. It’s down from 102% a year earlier.
Refer to our metrics definition page for explanations of all the metrics used in this report.