There are more homes for buyers to choose from, with new listings posting their biggest uptick in nearly three years.
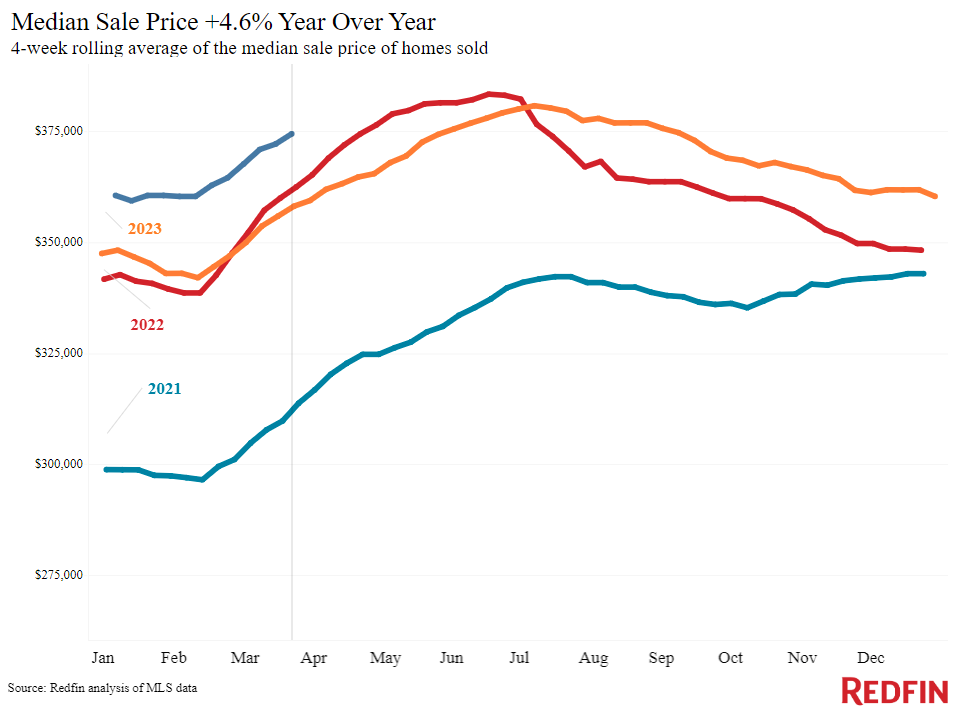
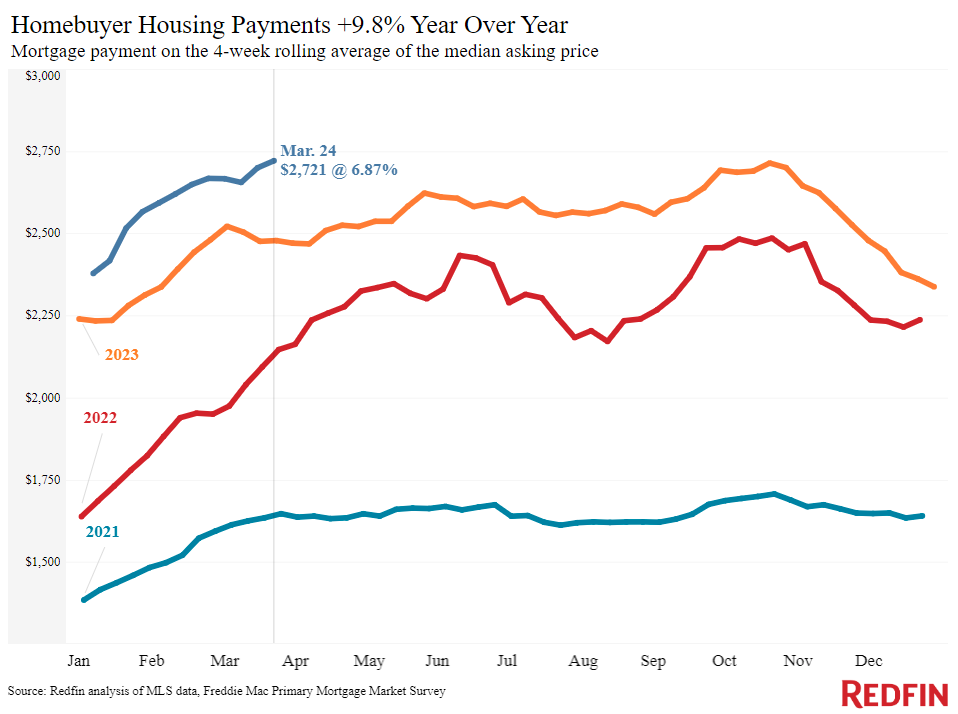
The typical U.S. monthly housing payment hit an all-time high of $2,721 during the four weeks ending March 24, up 10% from a year earlier. Housing payments are at a record high because of the one-two punch of elevated mortgage rates and rising home prices. Mortgage rates remain elevated near 7%, and the median home-sale price is up 5% year over year to roughly $375,000, just about $9,000 shy of June 2022’s record high.
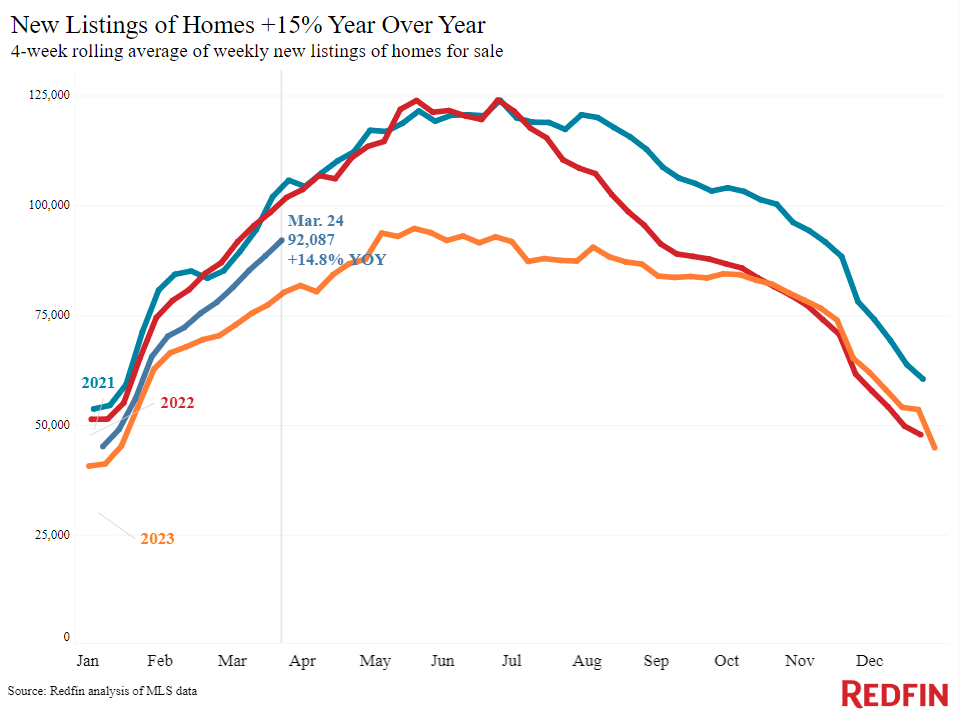
Many sellers are trying to take advantage of rising prices by listing their home. New listings are up 15%, the biggest increase in nearly three years, and the total number of homes for sale is up 6%, the biggest increase in nearly one year.
Increased supply is bringing back some demand, which is the main reason price growth remains robust. Mortgage-purchase applications are up 14% from a month ago, and pending home sales are just 1% lower than they were a year ago, the smallest decline since the beginning of the year.
“High mortgage rates aren’t deterring buyers as much as they were last year; a lot of people want to get in now before prices go up more,” said Miami Redfin agent Rachel Riva. “All of my recent listings have gone under contract in under 10 days, and most of them have received multiple offers. Buyers are lessening the impact of elevated rates in a few ways: Some are making high down payments to lower their monthly payments, and some are willing to take on a high rate now in hopes of refinancing when and if rates come down.”
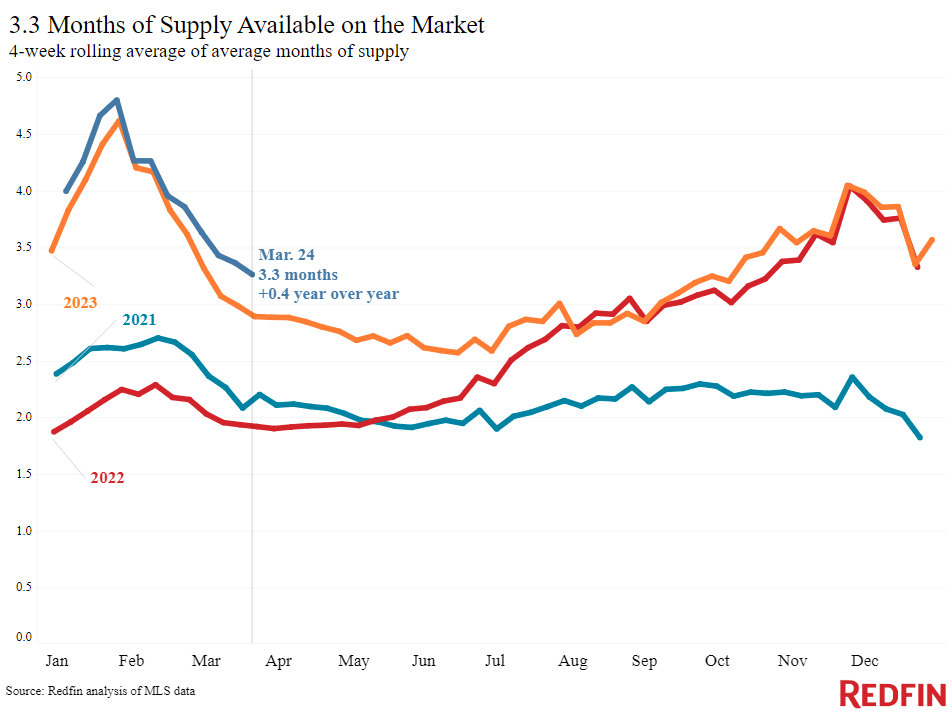
There are a few signs that price growth could soften a bit in the coming months. Nearly 6% of home sellers dropped their asking price this week, on average, the highest share of any March on record. Months of supply hit its highest level of any March since 2020–when the onset of the pandemic ground the housing market to a halt–indicating that the market is becoming more balanced.
Leading indicators
| Indicators of homebuying demand and activity | ||||
| Value (if applicable) | Recent change | Year-over-year change | Source | |
| Daily average 30-year fixed mortgage rate | 6.91% (March 27) | Down from 7.11% a week earlier | Up from 6.44% | Mortgage News Daily |
| Weekly average 30-year fixed mortgage rate | 6.87% (week ending March 21) | Up from 6.74% a week earlier | Up from 6.42% | Freddie Mac |
| Mortgage-purchase applications (seasonally adjusted) | Essentially unchanged from a week earlier; up 14% from a month earlier (as of week ending March 22) | Down 16% | Mortgage Bankers Association | |
| Redfin Homebuyer Demand Index (seasonally adjusted) | Up 2% from a month earlier (as of week ending March 24) | Down 8% | Redfin Homebuyer Demand Index, a measure of requests for tours and other homebuying services from Redfin agents | |
| Google searches for “home for sale” | Up 6% from a month earlier (as of March 25) | Down 5% | Google Trends | |
| Touring activity | Up 28% from the start of the year (as of March 25) | At this time last year, it was up 21% from the start of 2023 | ShowingTime, a home touring technology company | |
Key housing-market data
| U.S. highlights: Four weeks ending March 24, 2024
Redfin’s national metrics include data from 400+ U.S. metro areas, and is based on homes listed and/or sold during the period. Weekly housing-market data goes back through 2015. Subject to revision. |
|||
| Four weeks ending March 24, 2024 | Year-over-year change | Notes | |
| Median sale price | $374,500 | 4.6% | |
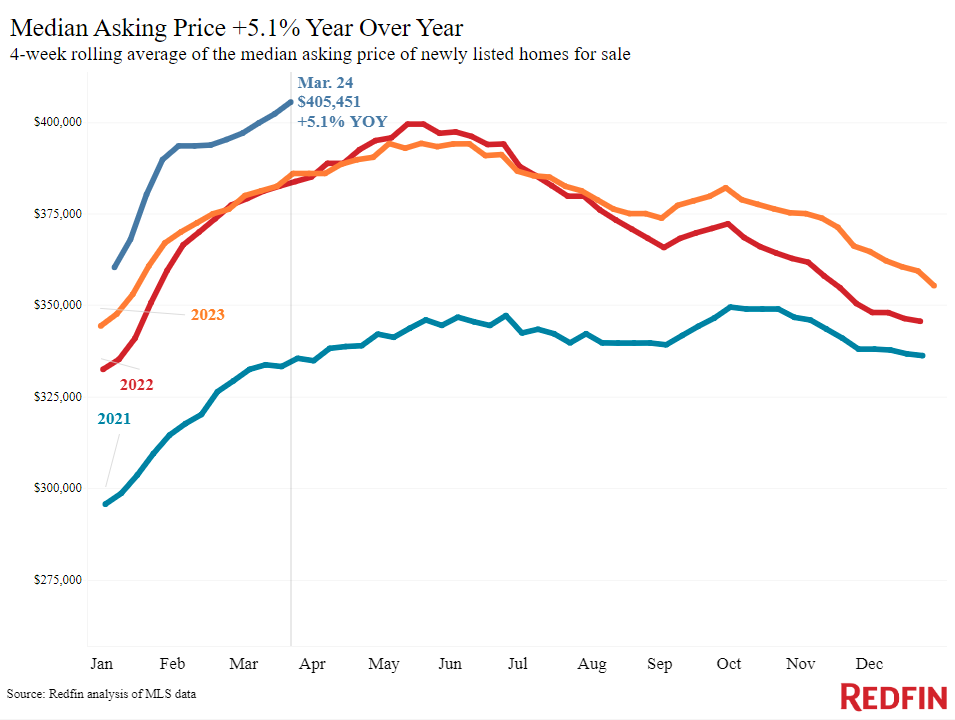
| Median asking price | $405,451 | 5.1% | |
| Median monthly mortgage payment | $2,721 at a 6.87% mortgage rate | 9.8% | Record high |
| Pending sales | 85,048 | -1.1% | Smallest decline in over 2 months |
| New listings | 92,087 | 14.8% | Biggest increase since June 2021 |
| Active listings | 807,227 | 6.3% | Biggest increase since May 2023 |
| Months of supply | 3.3 months | +0.4 pts. | 4 to 5 months of supply is considered balanced, with a lower number indicating seller’s market conditions. |
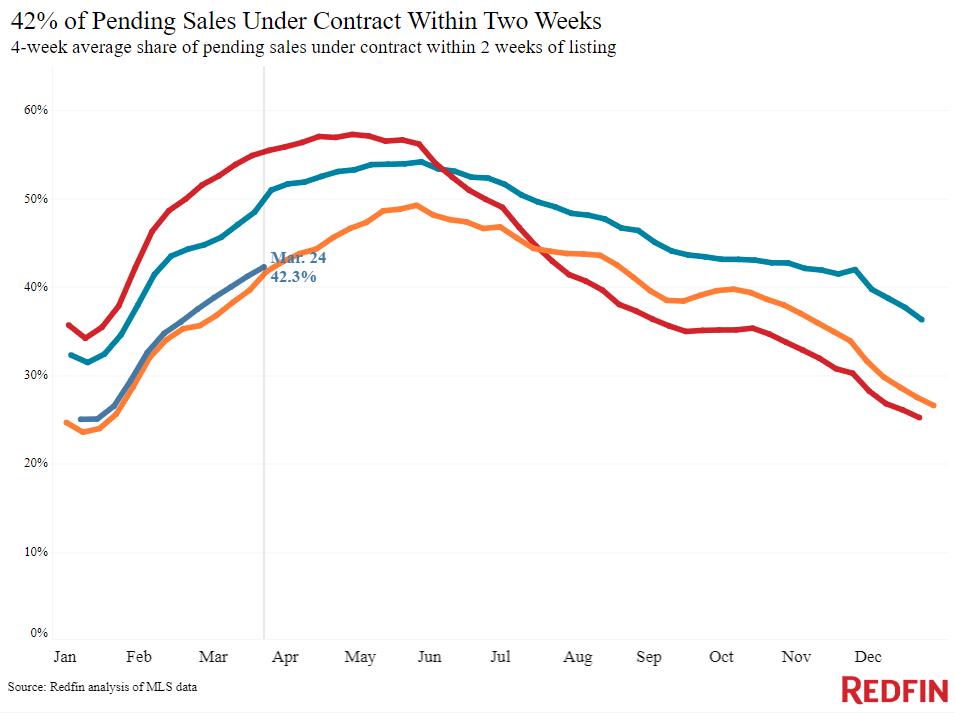
| Share of homes off market in two weeks | 42.3% | Essentially unchanged | |
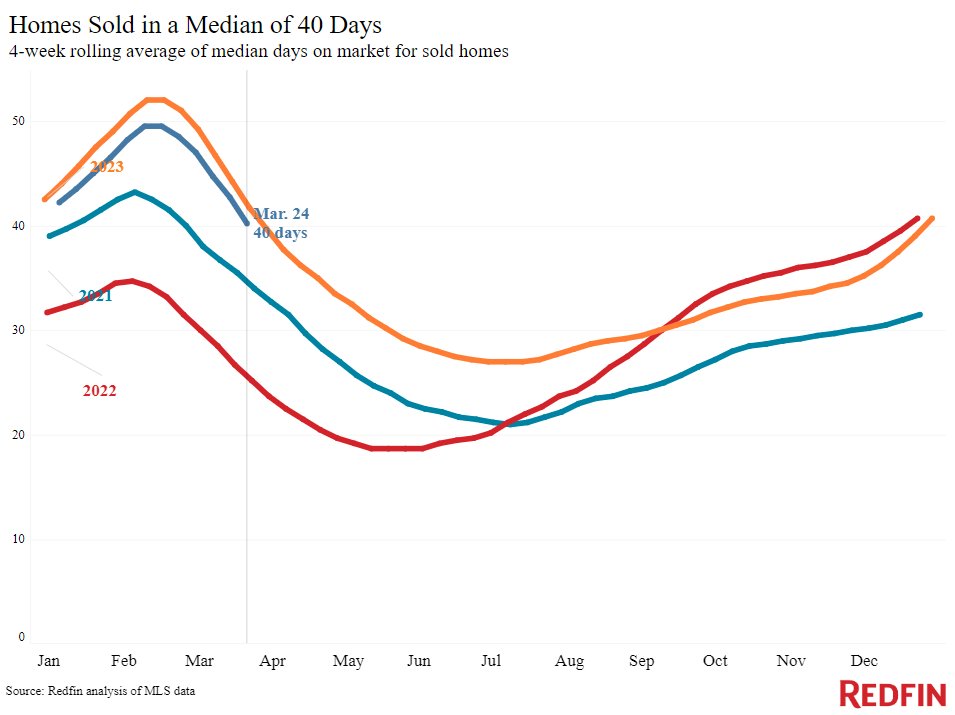
| Median days on market | 40 | -2 days | |
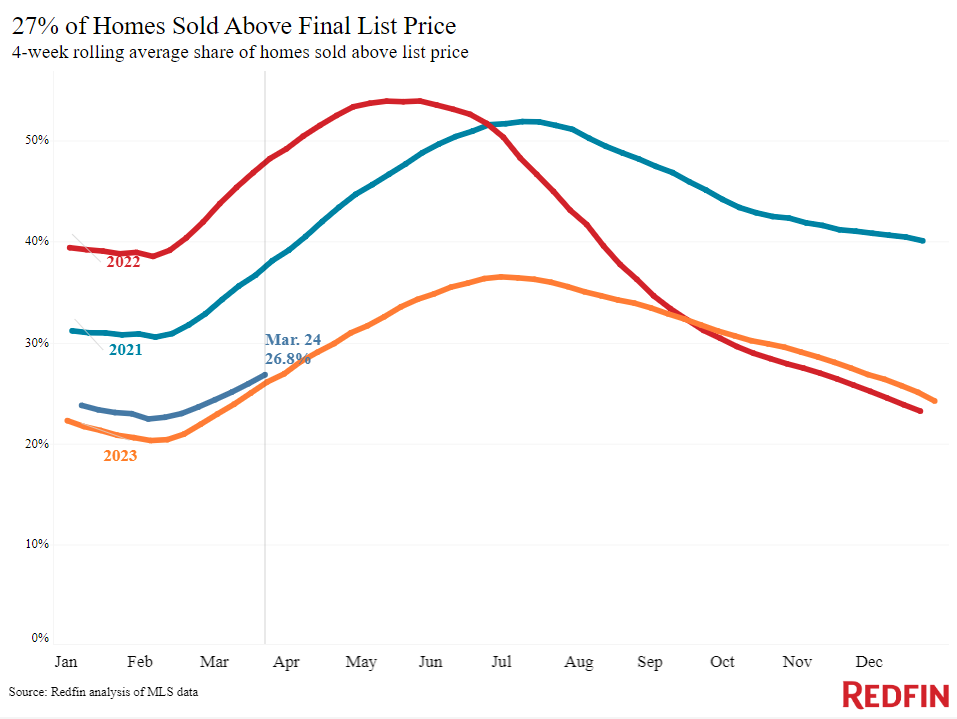
| Share of homes sold above list price | 26.8% | Up from 26% | |
| Share of homes with a price drop | 5.8% | +1.6 pts. | |
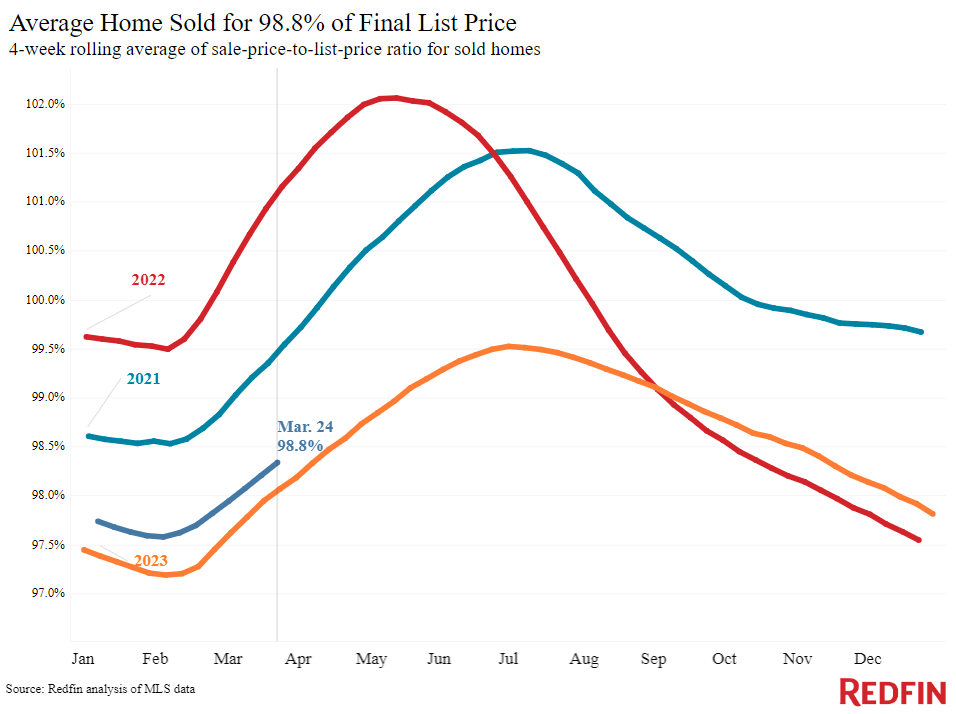
| Average sale-to-list price ratio | 98.8% | +0.2 pts. | |
|
Metro-level highlights: Four weeks ending March 24, 2024 Redfin’s metro-level data includes the 50 most populous U.S. metros. Select metros may be excluded from time to time to ensure data accuracy. |
|||
|---|---|---|---|
| Metros with biggest year-over-year increases | Metros with biggest year-over-year decreases | Notes | |
| Median sale price | West Palm Beach, FL (20.7%)
San Jose, CA (17.6%) Miami (16.1%) Detroit (15%) New Brunswick, NJ (14.5%) |
San Antonio, TX (-0.3%) |
Declined in just 1 metro |
| Pending sales | San Jose, CA (25.1%)
San Francisco (20.1%) Cincinnati (11.6%) Anaheim, CA (9.9%) Seattle (8.2%) |
Atlanta (-15.4%)
Houston (-13%) San Antonio, TX (-12.7%) West Palm Beach, FL (-12.5%) Miami (-10.7%) |
Increased in roughly half of the metros |
| New listings | San Jose, CA (41.8%)
Sacramento, CA (38%) Phoenix (31.7%) Las Vegas (27.3%) Austin, TX (26%) |
Atlanta (-6.6%)
Chicago (-2.9%) |
Declined in just 2 metros |
Refer to our metrics definition page for explanations of all the metrics used in this report.