Growth in new listings slowed this week as some sellers pressed pause over Easter. Housing costs remain stubbornly high, deterring some buyers–but Redfin economists say costs could come down soon.
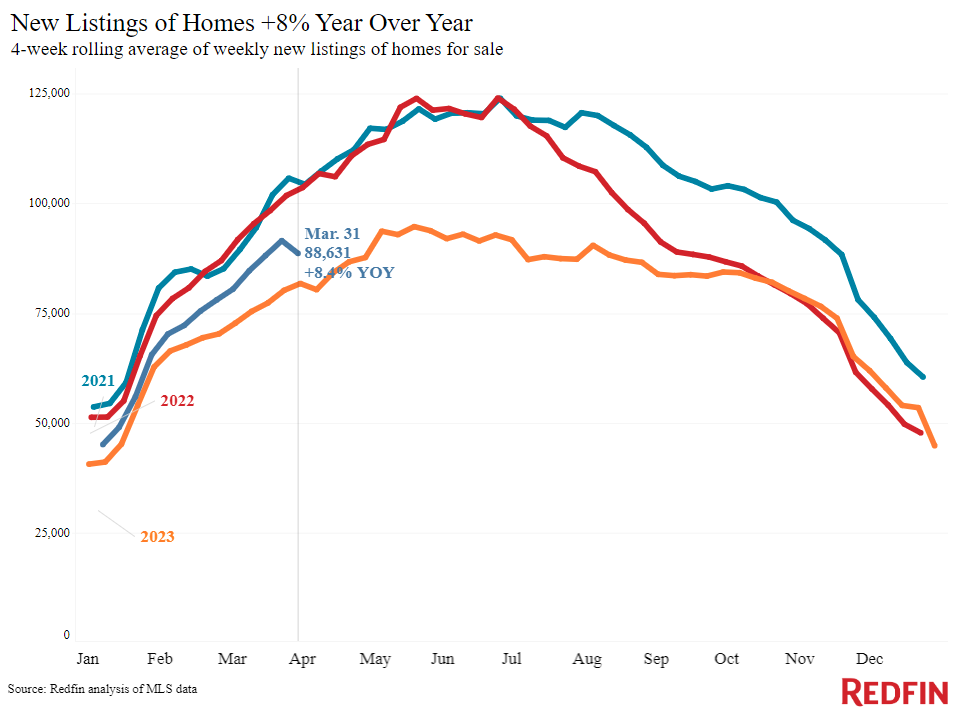
What sellers are doing: New listings of U.S. homes for sale rose 8.4% from a year earlier during the four weeks ending March 31, the smallest increase in about seven weeks. Year-over-year growth in new listings slowed because some sellers took a break over Easter, which fell over a week earlier in 2024 than in 2023. The slowdown is likely an Easter blip, but we’ll be keeping a close eye on selling data over the next few weeks to confirm it’s not the start of a larger trend.
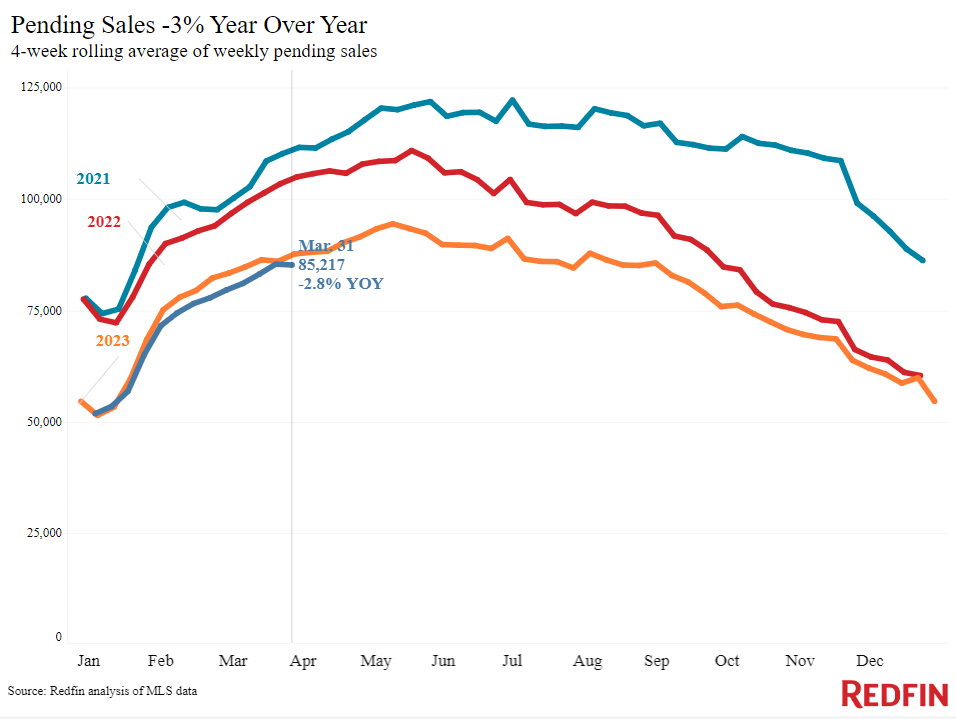
What buyers are doing: Homebuying demand was relatively soft this week, too. Home tours were up 15% from the start of the year, compared to a 21% increase at this time last year, and mortgage-purchase applications were flat this week. Pending home sales fell 2.8% from a year ago, and they posted an unseasonal decline during the last week of March. Some would-be buyers took a break from touring offers and making offers over Easter, and others are shying away due to high housing costs.
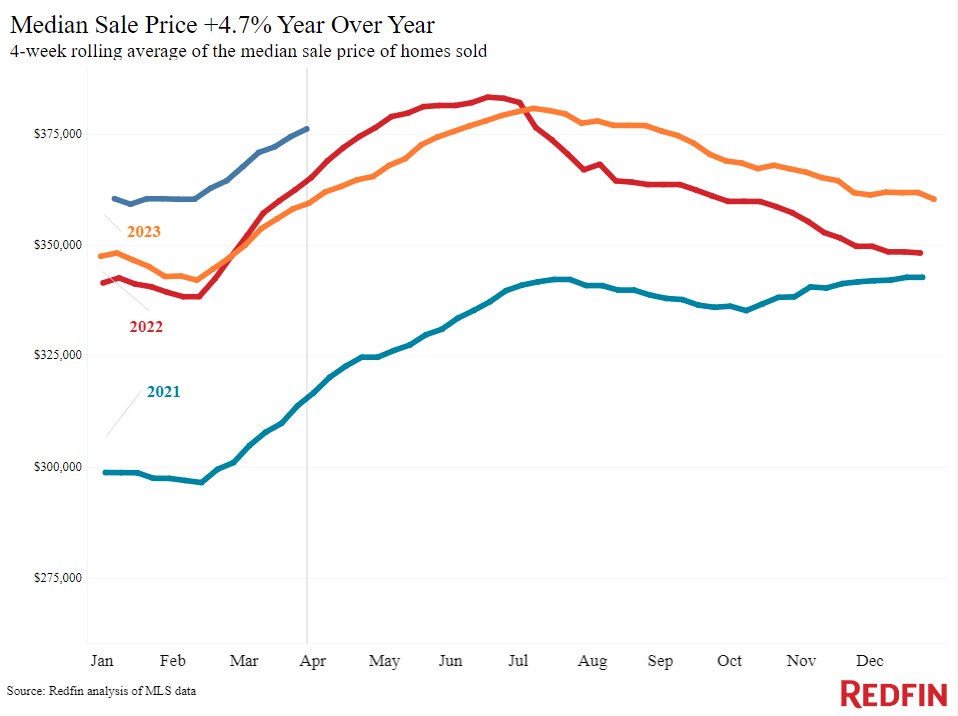
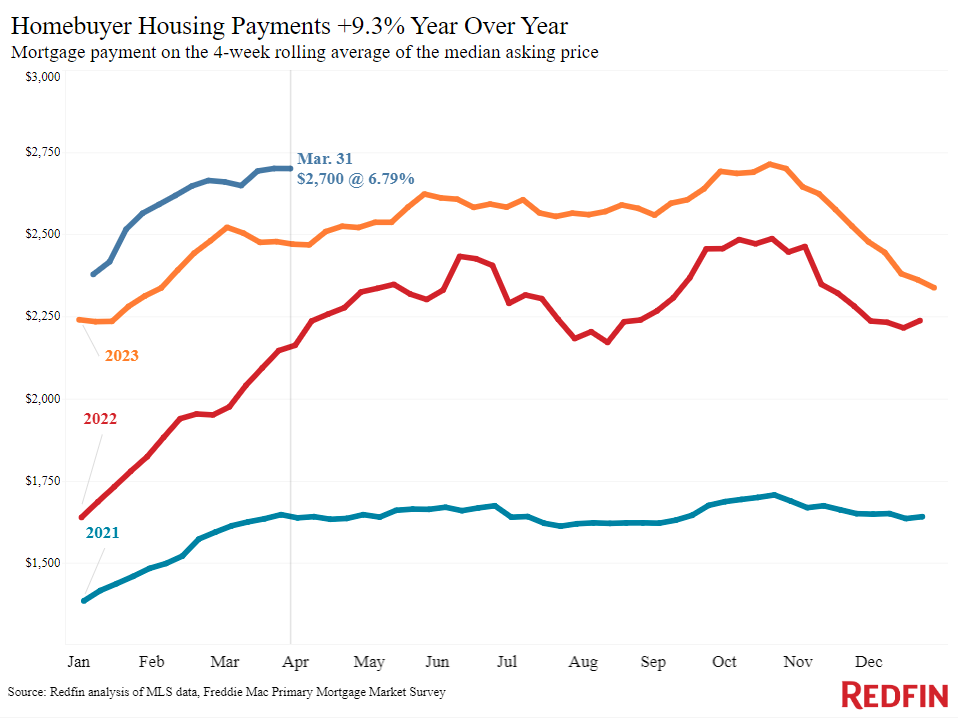
And what about prices? The median U.S. home-sale price was $376,223, up 4.7% from a year earlier. Median monthly housing payments were just $13 shy of the all-time high hit last October, when home prices were lower but mortgage rates were nearing 8%, versus just under 7% this week.
“Buyers may get a break on housing costs in the coming months,” said Redfin Economic Research Lead Chen Zhao. “Daily average mortgage rates rose this week because of some disappointing economic news. But if the upcoming job and inflation reports show that the economy is heading in the right direction, the Fed is likely to confirm they will cut interest rates in June, which would lower mortgage rates. Home-price growth could soften as spring goes on if new listings regain the momentum we saw before Easter.”
For more of Redfin economists’ takes on the housing market, including how current financial events are impacting mortgage rates, please visit our “From Our Economists” page.
Leading indicators
| Indicators of homebuying demand and activity | ||||
| Value (if applicable) | Recent change | Year-over-year change | Source | |
| Daily average 30-year fixed mortgage rate | 7.07% (April 3) | Up from 6.91% a week earlier | Up from 6.44% | Mortgage News Daily |
| Weekly average 30-year fixed mortgage rate | 6.79% (week ending March 28) | Down from 6.87% a week earlier | Up from 6.32% | Freddie Mac |
| Mortgage-purchase applications (seasonally adjusted) | Essentially unchanged from a week earlier (as of week ending April 3) | Down 13% | Mortgage Bankers Association | |
| Redfin Homebuyer Demand Index (seasonally adjusted) | Essentially unchanged from a month earlier (as of week ending March 31) | Down 11% | Redfin Homebuyer Demand Index, a measure of requests for tours and other homebuying services from Redfin agents | |
| Touring activity | Up 15% from the start of the year (as of April 2) | At this time last year, it was up 21% from the start of 2023 (last year’s increase was bigger partly because Easter fell on March 31 this year, and a week later in 2024) | ShowingTime, a home touring technology company | |
| Google searches for “home for sale” | Down 4% from a month earlier (as of April 1) | Down 13% | Google Trends | |
Key housing-market data
| U.S. highlights: Four weeks ending March 31, 2024
Redfin’s national metrics include data from 400+ U.S. metro areas, and is based on homes listed and/or sold during the period. Weekly housing-market data goes back through 2015. Subject to revision. |
|||
| Four weeks ending March 31, 2024 | Year-over-year change | Notes | |
| Median sale price | $376,223 | 4.7% | |
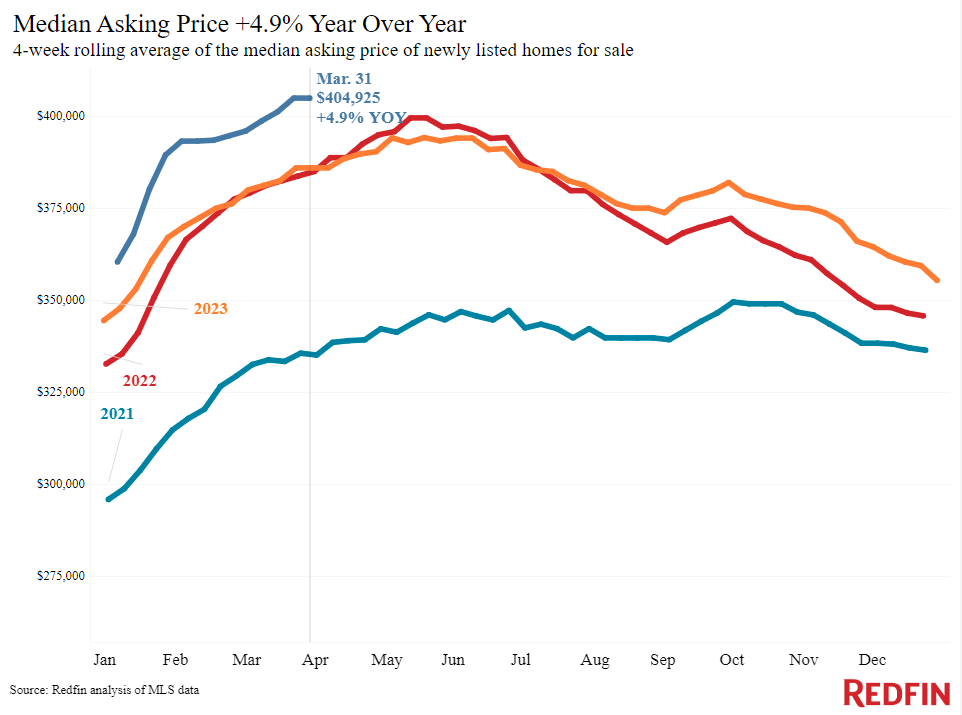
| Median asking price | $404,925 | 4.9% | |
| Median monthly mortgage payment | $2,700 at a 6.79% mortgage rate | 9.3% | $13 shy of record high hit in October 2023 |
| Pending sales | 85,217 | -2.8% | |
| New listings | 88,631 | 8.4% | |
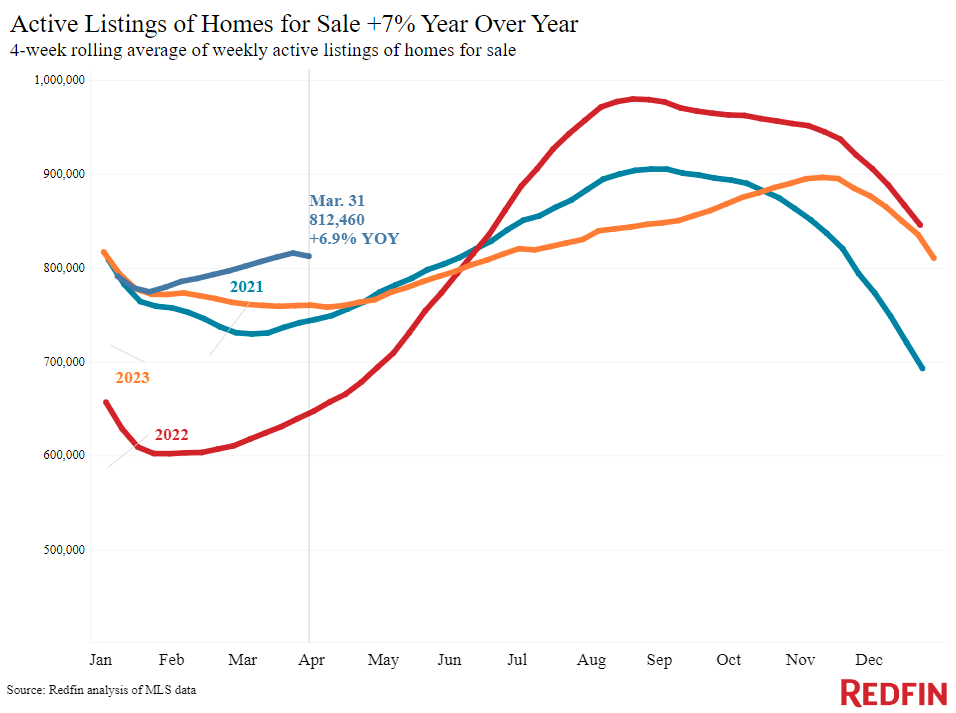
| Active listings | 812,460 | 6.9% | |
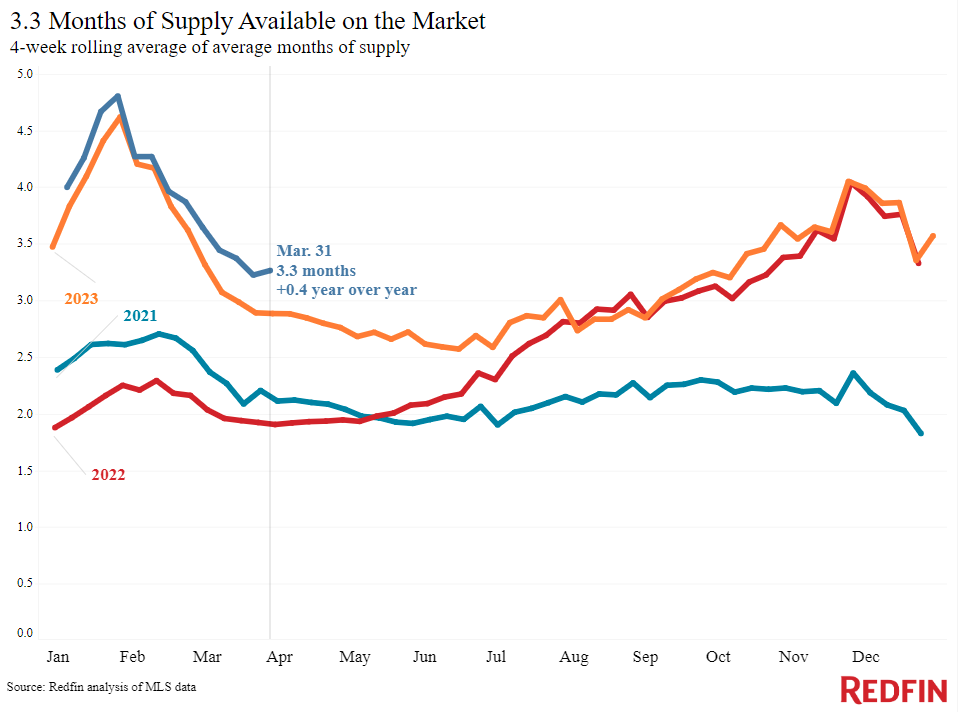
| Months of supply | 3.3 months | +0.4 pts. | 4 to 5 months of supply is considered balanced, with a lower number indicating seller’s market conditions. |
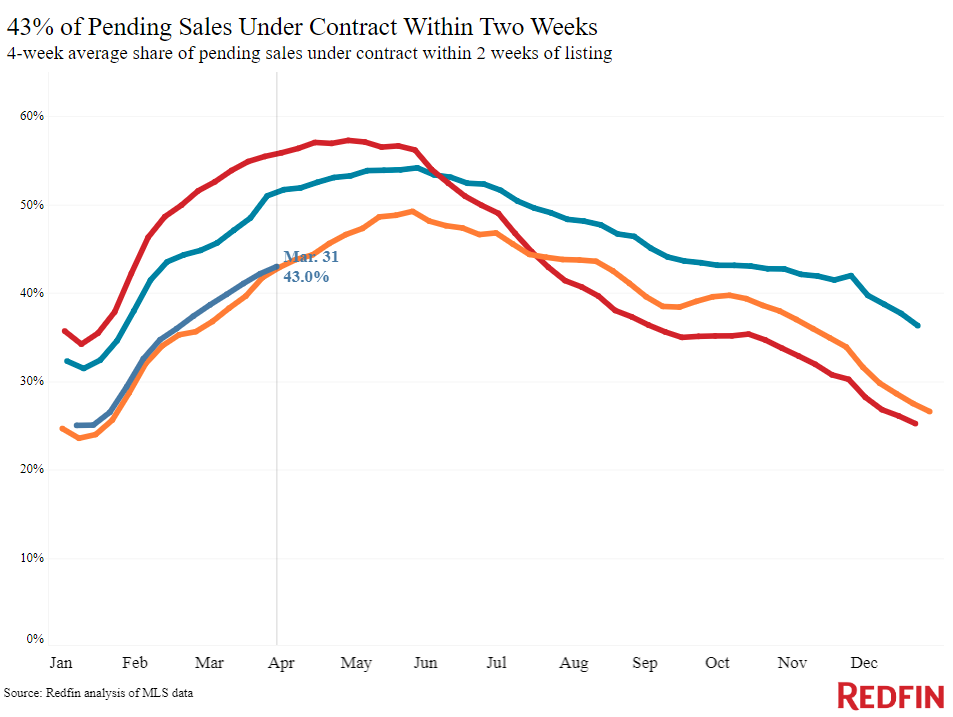
| Share of homes off market in two weeks | 43% | Essentially unchanged | |
| Median days on market | 39 | -1 day | |
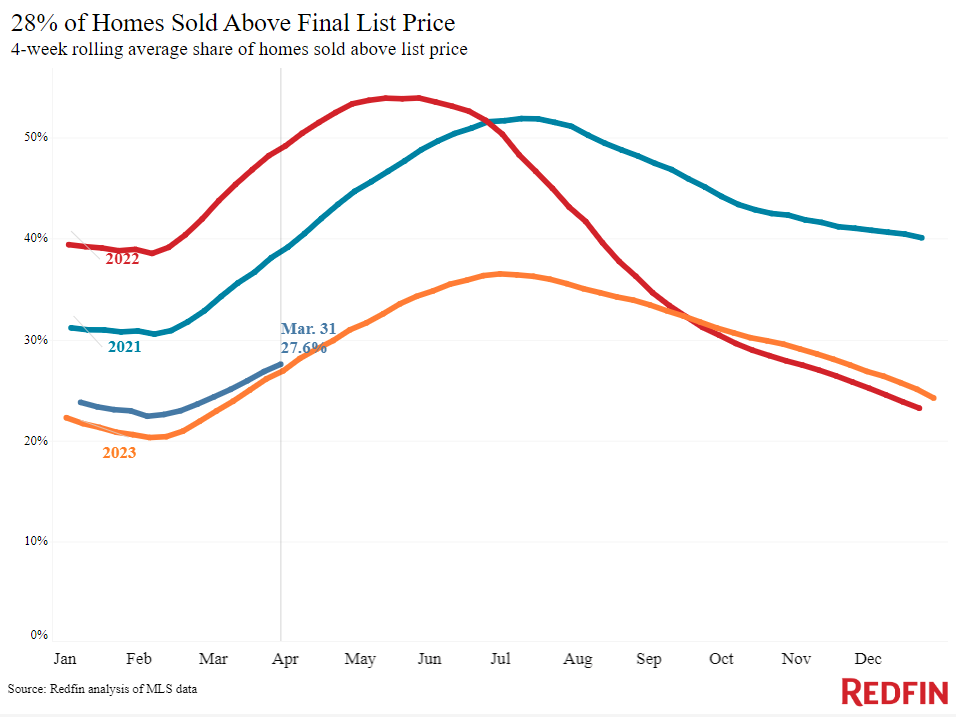
| Share of homes sold above list price | 27.6% | Up from 27% | |
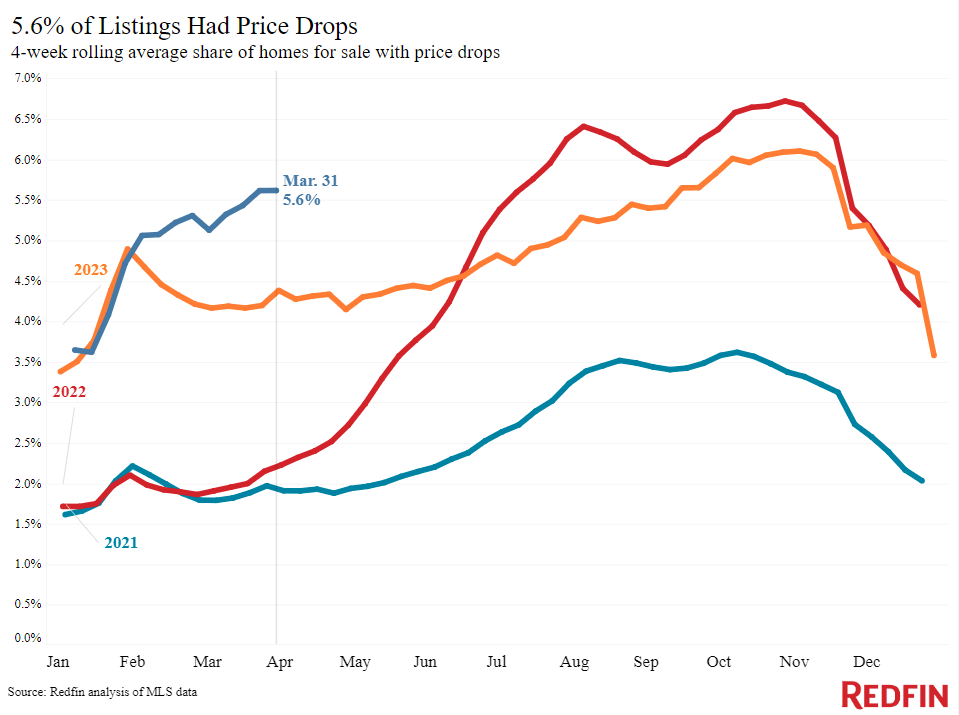
| Share of homes with a price drop | 5.6% | +1.2 pts. | |
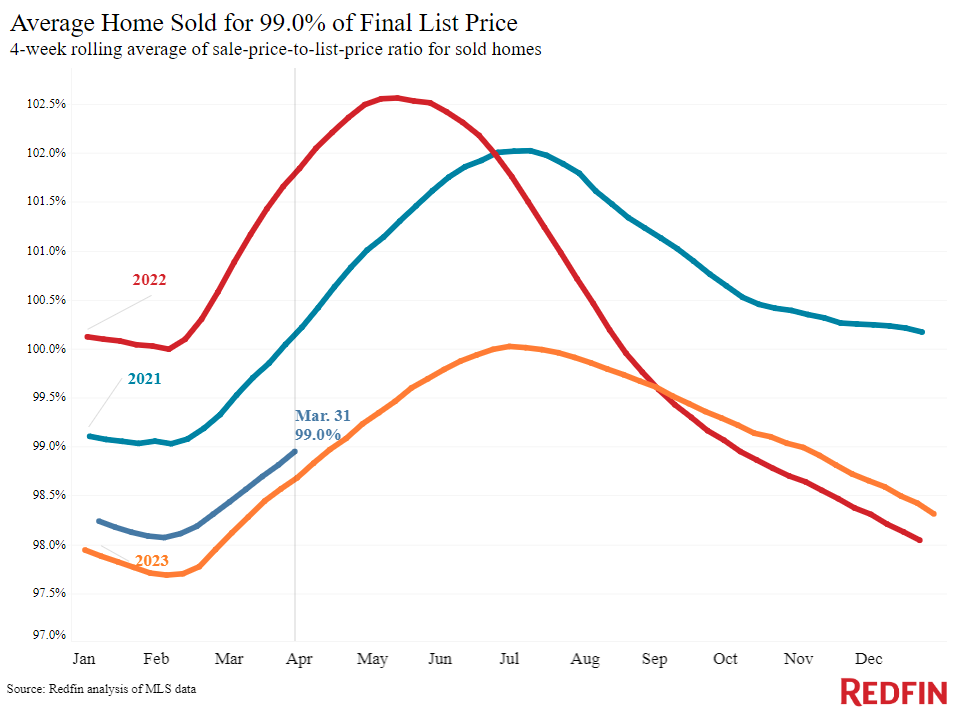
| Average sale-to-list price ratio | 99% | +0.3 pts. | |
|
Metro-level highlights: Four weeks ending March 31, 2024 Redfin’s metro-level data includes the 50 most populous U.S. metros. Select metros may be excluded from time to time to ensure data accuracy. |
|||
|---|---|---|---|
| Metros with biggest year-over-year increases | Metros with biggest year-over-year decreases | Notes | |
|
Median sale price |
West Palm Beach, FL (19.1%)
Anaheim, CA (18%) San Jose, CA (15.9%) Providence, RI (14.3%) Miami (14%) |
San Antonio, TX (-0.3%) |
Declined in just 1 metro |
| Pending sales | San Jose, CA (30.5%)
San Francisco (24.9%) Anaheim, CA (8.8%) Seattle (6.8%) Milwaukee (5.2%) |
Atlanta (-15.9%)
West Palm Beach, FL (-14.8%) Houston (-13.3%) San Antonio, TX (-12.5%) Fort Lauderdale, FL (-10.5%) |
Increased in 16 metros |
| New listings | San Jose, CA (41.3%)
Phoenix (30.2%) Sacramento, CA (25.4%) Jacksonville, FL (23.6%) Austin, TX (21.1%) |
Atlanta (-9.6%)
Newark, NJ (-8.9%) Boston (-8.3%) Chicago (-8%) Milwaukee, WI (-6%) |
Declined in 13 metros |
Refer to our metrics definition page for explanations of all the metrics used in this report.


 United States
 Canada