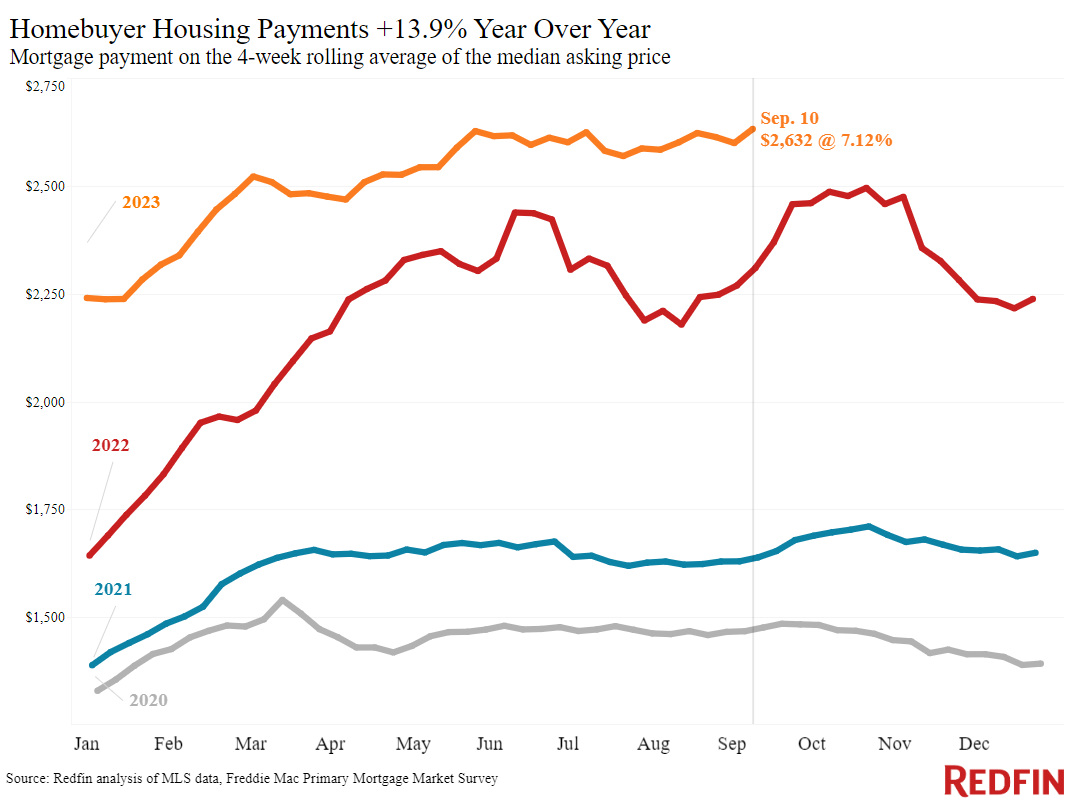
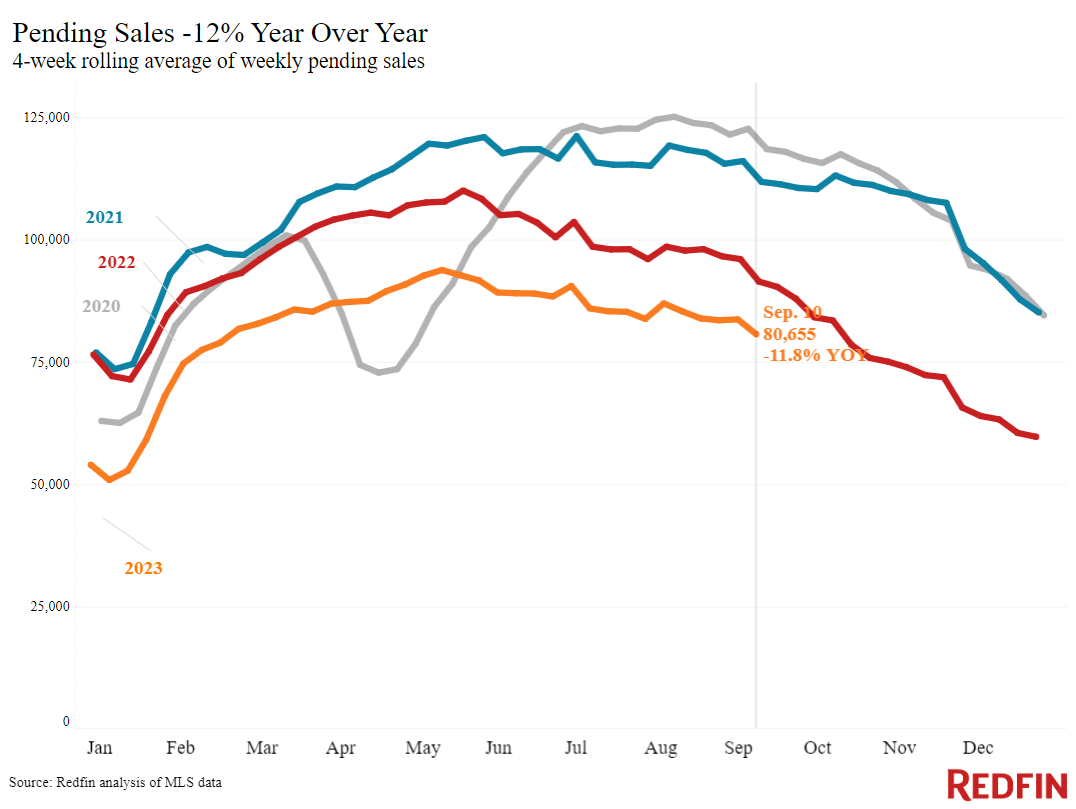
7%-plus mortgage rates and increasing home prices have pushed the typical U.S. monthly mortgage payment to a record high, and sent pending home sales down 12% year over year.
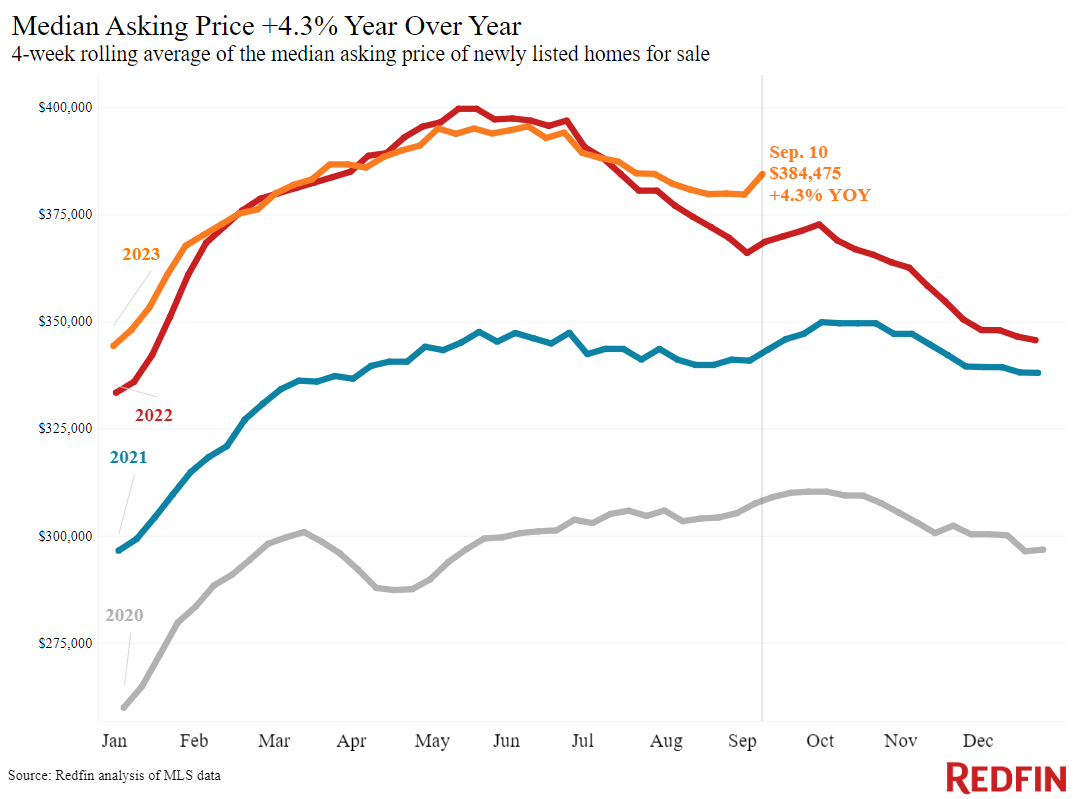
What homebuyers need to know: It’s more expensive than ever to buy a home. The median monthly mortgage payment hit an all-time high of $2,632 during the four weeks ending September 10. Although the weekly average mortgage rate has declined slightly from August’s two-decade high, it’s still sitting above 7%. Prices are up, too, increasing 4% year over year.
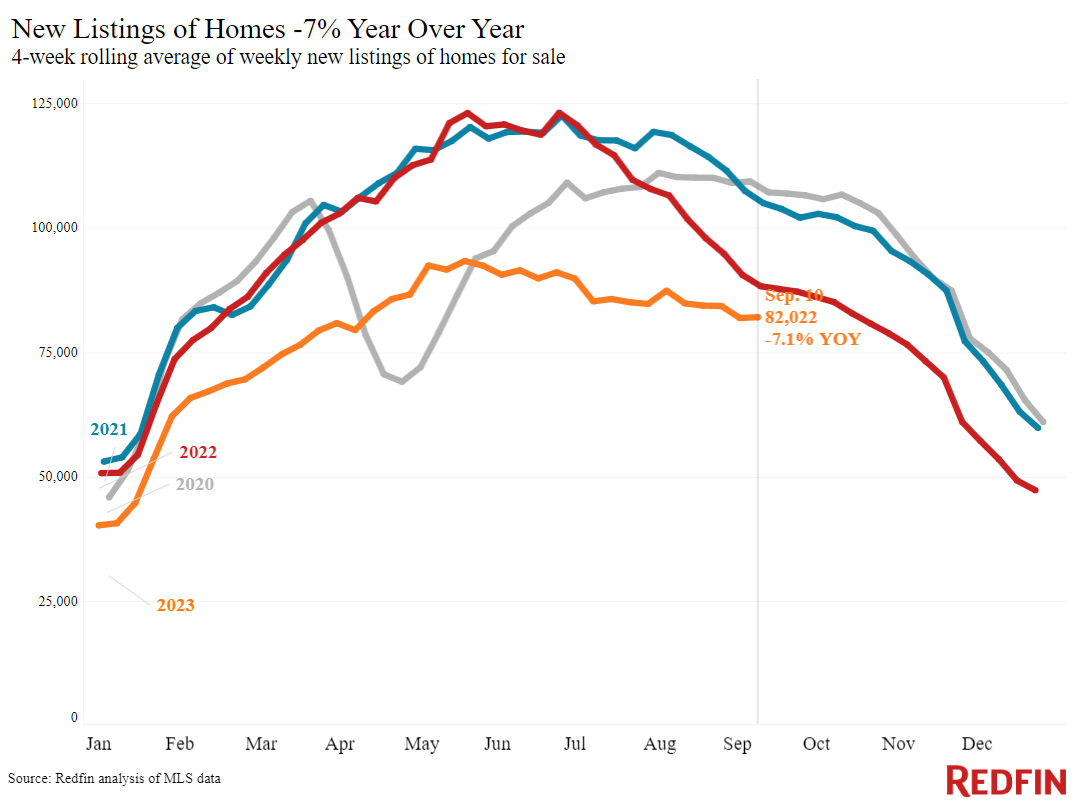
What home sellers need to know: Prices continue to rise because inventory is so low, posting one of its biggest declines in 19 months this week. In much of the country, you’re likely to get a fair price for your home–it’ll help if it’s move-in ready and in a desirable neighborhood. But keep in mind that high prices, elevated rates and the lack of inventory is sending some buyers to the sidelines; mortgage-purchase applications are hovering near a three-decade low and pending home sales are down 12% year over year.
Looking forward: This week’s CPI report shows that inflation came in a touch higher than anticipated. That doesn’t change the expectation that the Fed is highly unlikely to hike interest rates next week, but it does make a rate hike in November or December appear more likely. That could mean mortgage rates stay high through the end of the year–or rates could come down if economic data looks promising over the next few months.
Leading indicators
| Indicators of homebuying demand and activity | ||||
| Value (if applicable) | Recent change | Year-over-year change | Source | |
| Daily average 30-year fixed mortgage rate | 7.25% (Sept. 13) | Down from a peak of 7.49% three weeks earlier | Up from 6.3% | Mortgage News Daily |
| Weekly average 30-year fixed mortgage rate | 7.12% (week ending Sept. 7) | Down slightly from 7.18% a week earlier, but 4th straight week of rates above 7% | Up from 5.89% | Freddie Mac |
| Mortgage-purchase applications (seasonally adjusted) | Up 1% from a month earlier (as of week ending Sept. 8) | Down 27% | Mortgage Bankers Association | |
| Redfin Homebuyer Demand Index (seasonally adjusted) | Down 3% from a month earlier (as of the 4 weeks ending Sept. 10) | Down 9% | Redfin Homebuyer Demand Index, a measure of requests for tours and other homebuying services from Redfin agents | |
| Google searches for “home for sale” | Unchanged from a month earlier (as of Sept. 9) | Down 7% | Google Trends | |
Key housing-market data
| U.S. highlights: Four weeks ending September 10, 2023
Redfin’s national metrics include data from 400+ U.S. metro areas, and is based on homes listed and/or sold during the period. Weekly housing-market data goes back through 2015. Subject to revision. |
|||
| Four weeks ending September 10 | Year-over-year change | Notes | |
| Median sale price | $376,250 | 3.9% | The median sale price has increased at least 3% year over year for the last month. That’s partly because elevated mortgage rates were hampering prices during this time last year. |
| Median asking price | $384,475 | 4.3% | Biggest increase since November 2022 |
| Median monthly mortgage payment | $2,632 at a 7.12% mortgage rate | 14% | All-time high |
| Pending sales | 80,655 | -11.8% | Continues 15-month streak of double-digit declines |
| New listings | 82,022 | -7.1% | Smallest decline in over a year, but that’s partly because new listings fell rapidly at this time in 2022 |
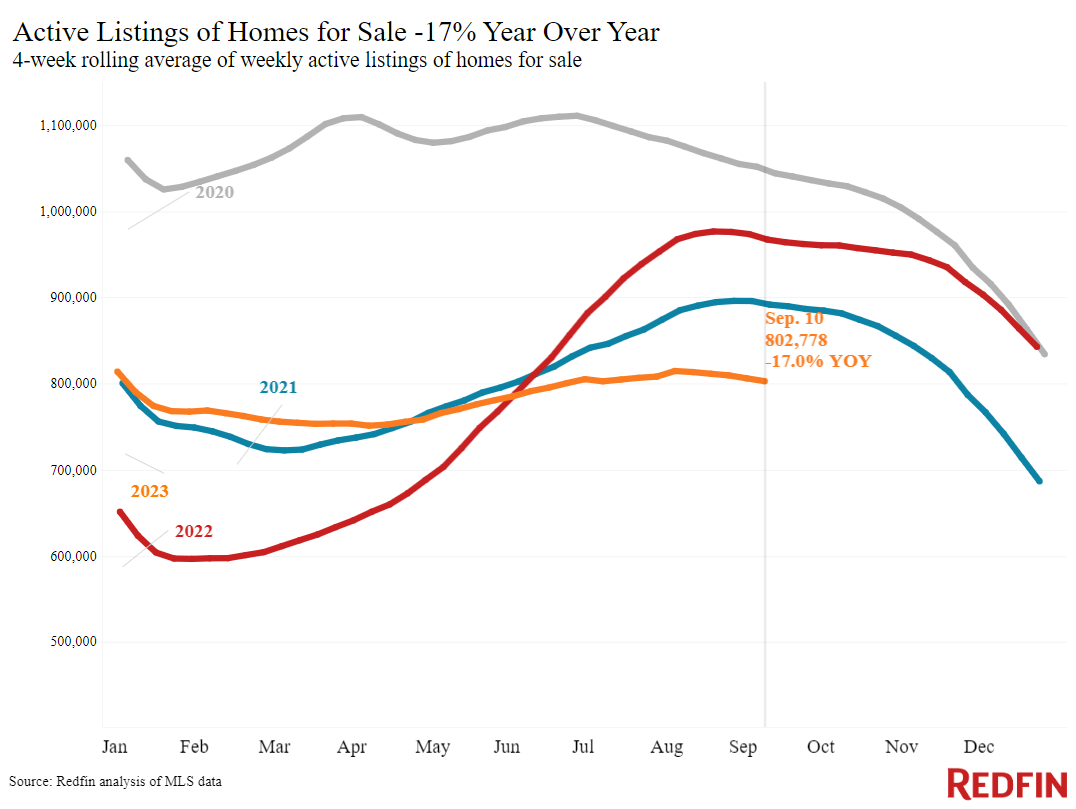
| Active listings | 805,063 | -17% | Biggest decline since February 2022, aside from the two prior 4-week periods (-17.1% and -17.2% YoY declines, respectively) |
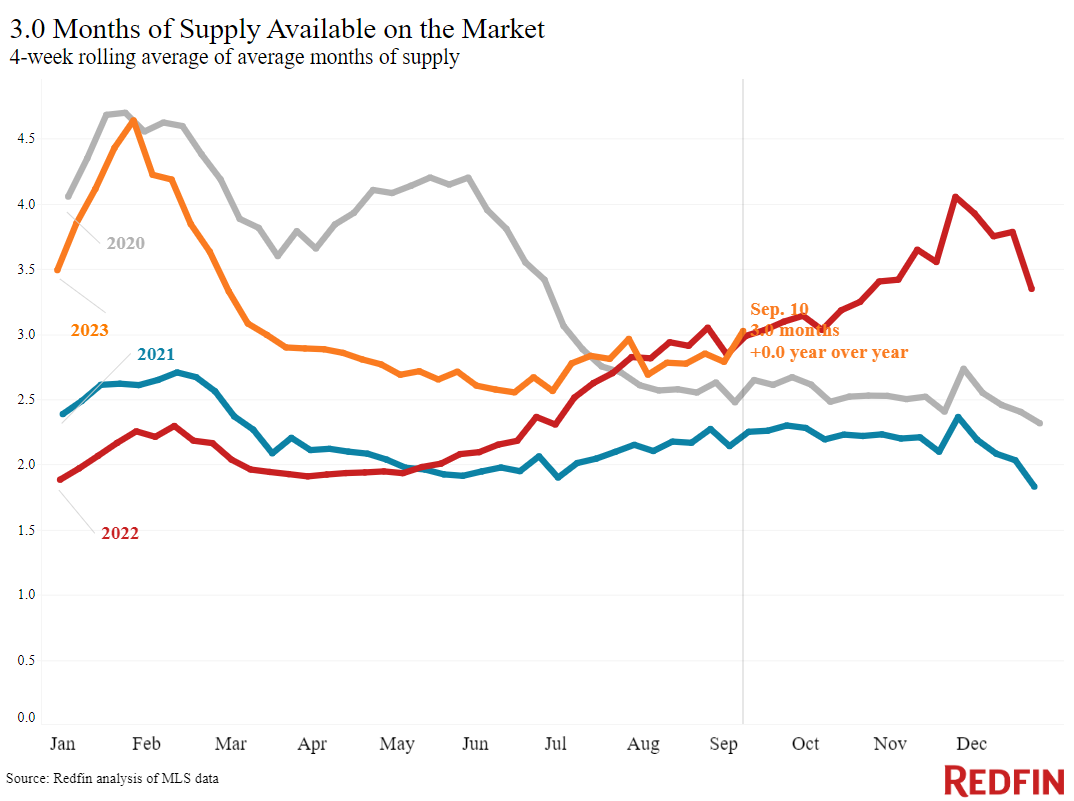
| Months of supply | 3 months | unchanged | Highest level since March.
4 to 5 months of supply is considered balanced, with a lower number indicating seller’s market conditions. |
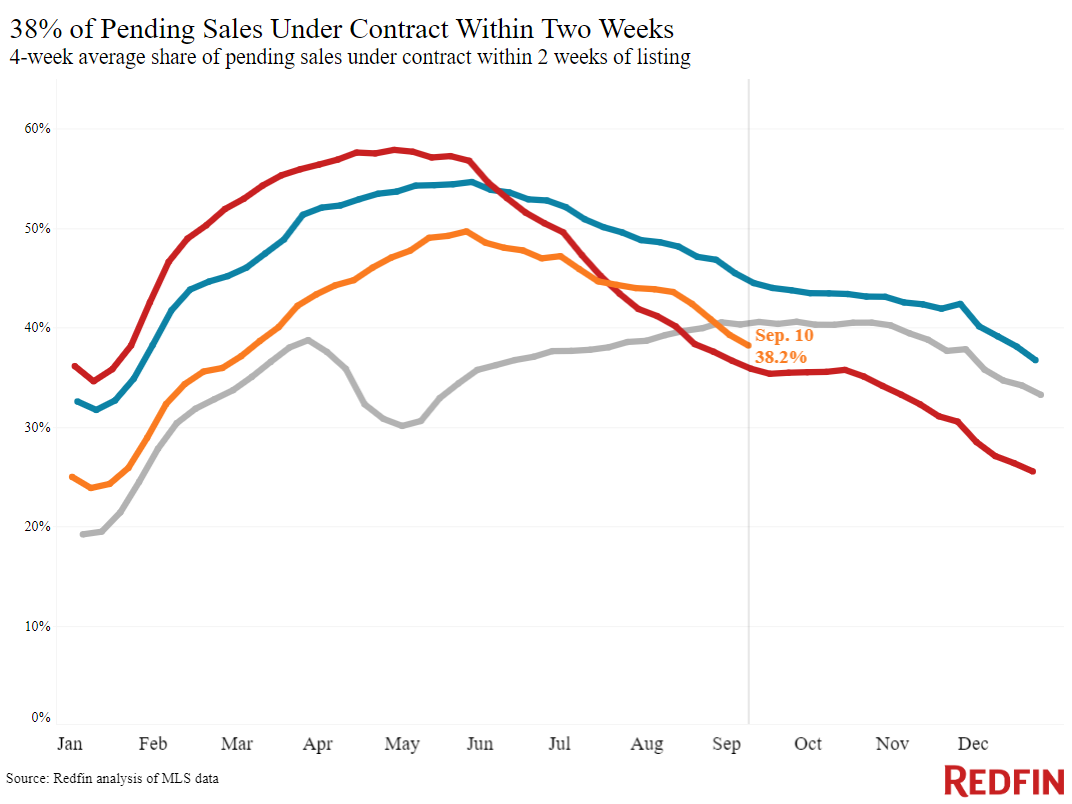
| Share of homes off market in two weeks | 38.2% | +0.2 pts. | Lowest level since March |
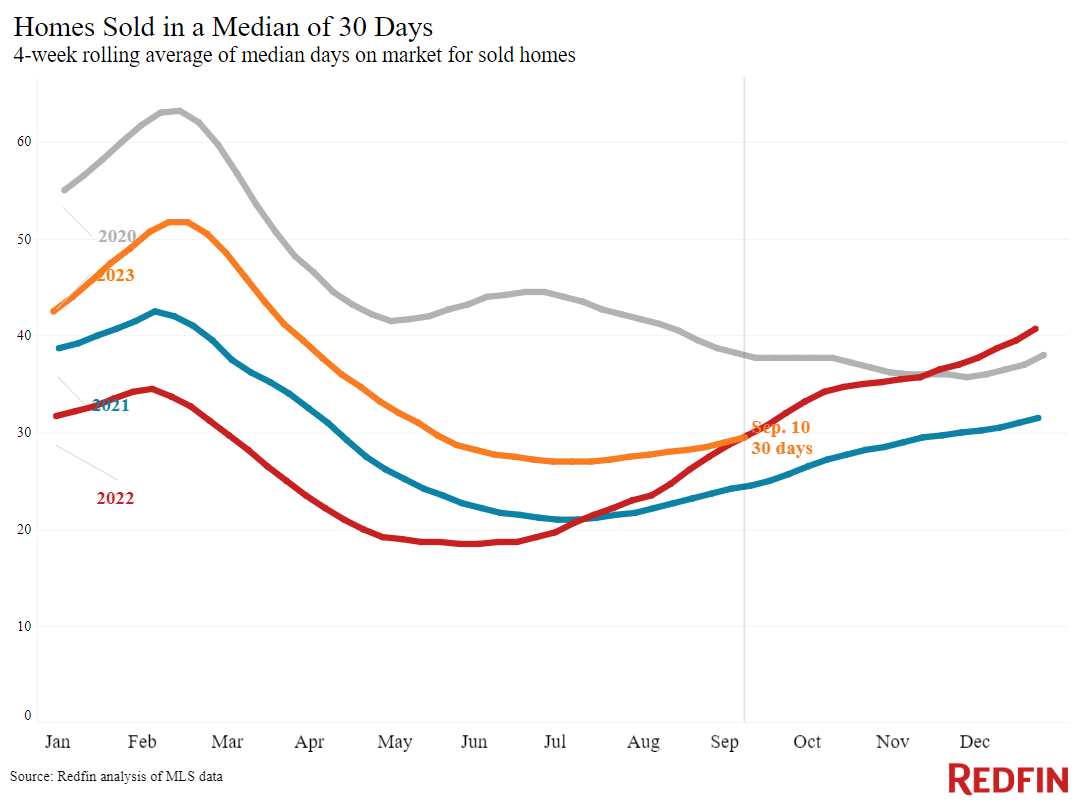
| Median days on market | 30 | Unchanged | |
| Share of homes sold above list price | 32.8% | Unchanged | |
| Share of homes with a price drop | 6.1% | +0.1 pt. | |
| Average sale-to-list price ratio | 99.6% | +0.2 pts. | Lowest level in nearly 4 months |
| Metro-level highlights: Four weeks ending September 10, 2023
Redfin’s metro-level data includes the 50 most populous U.S. metros. Select metros may be excluded from time to time to ensure data accuracy. |
|||
| Metros with biggest year-over-year increases | Metros with biggest year-over-year declines | Notes | |
| Median sale price | Miami (16.4%)
Newark, NJ (14.9%) Anaheim, CA (12.6%) San Diego (11.8%) San Jose, CA (11%) |
Austin, TX (-5.2%)
Fort Worth, TX (-2.6%) Phoenix (-1.8%) Houston, TX (-1.5%) Las Vegas (-0.9%) |
Declined in just 7 metros |
| Pending sales | n/a | Newark, NJ (-28%)
Seattle (-27.4%) San Antonio, TX (-27.1%) San Jose, CA (-25.7%) Atlanta (-25.6%) |
Declined in all metros |
| New listings | San Jose, CA (6.1%)
Milwaukee (5.7%) Minneapolis (1.2%) Montgomery County, PA (0.4%) |
Atlanta (-29.7%)
Las Vegas (-25.2%) Riverside, CA (-21.6%) Los Angeles (-17.3%) Newark, NJ (-15.8%) |
Declined in all but 4 metros |
Refer to our metrics definition page for explanations of all the metrics used in this report.