The median U.S. housing payment is down nearly $400 from its October peak, enticing some sidelined buyers to get back in the game. Redfin’s Demand Index, which measures early-stage demand, is up 10% from a month ago.
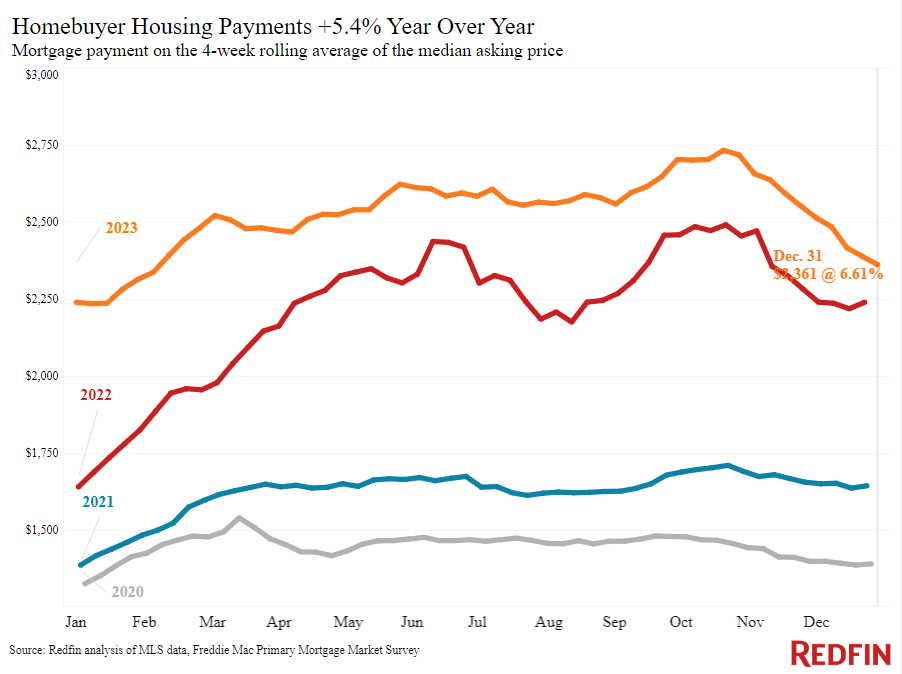
The median U.S. mortgage payment was $2,361 during the four weeks ending December 31, down $372 (-14%) from October’s all-time high to its lowest level in nearly a year. The weekly average mortgage rate dipped to 6.61% at the end of December, down from a 23-year high of 7.79% in late October.
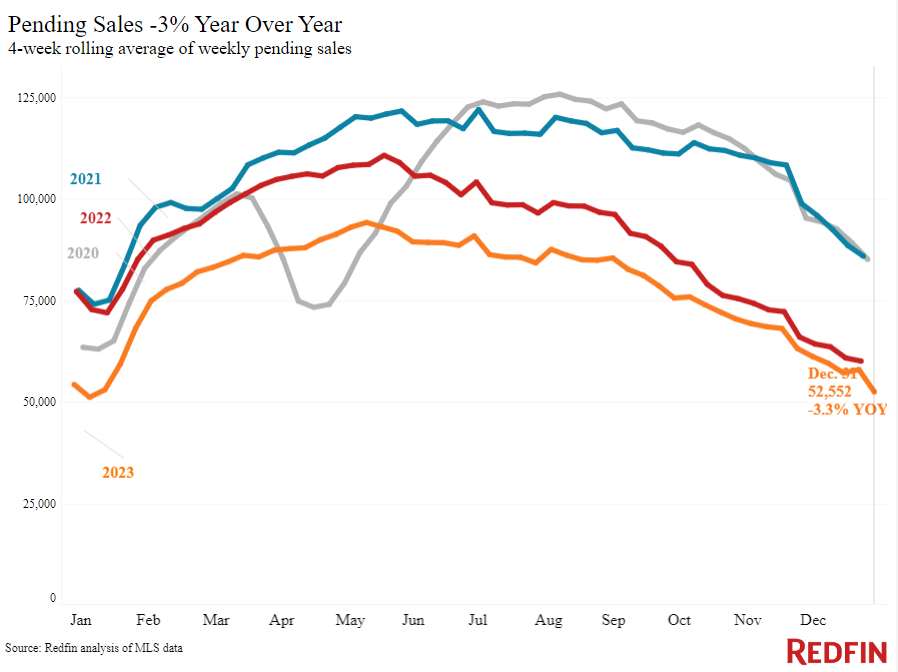
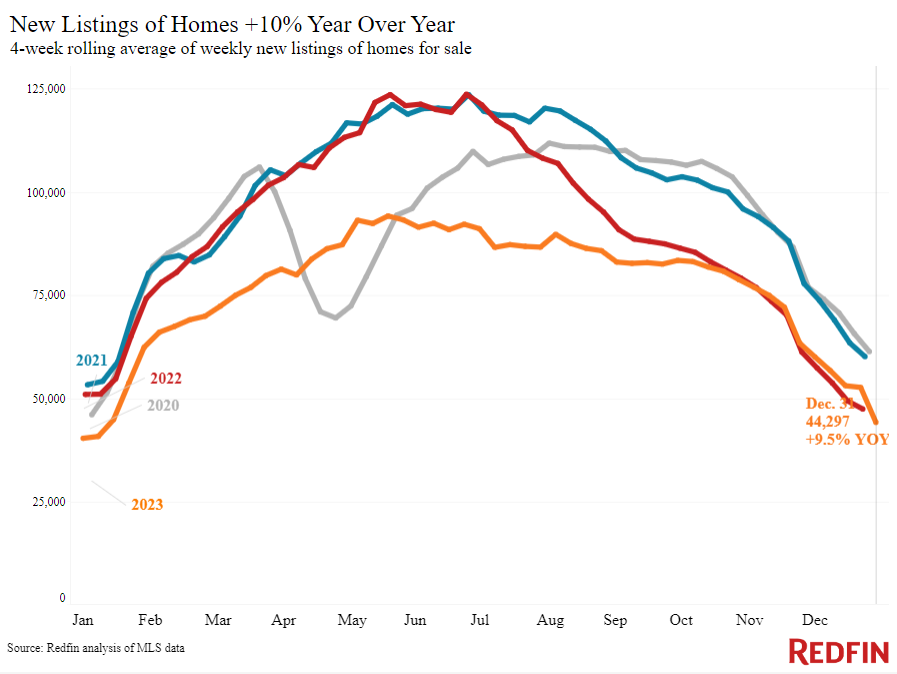
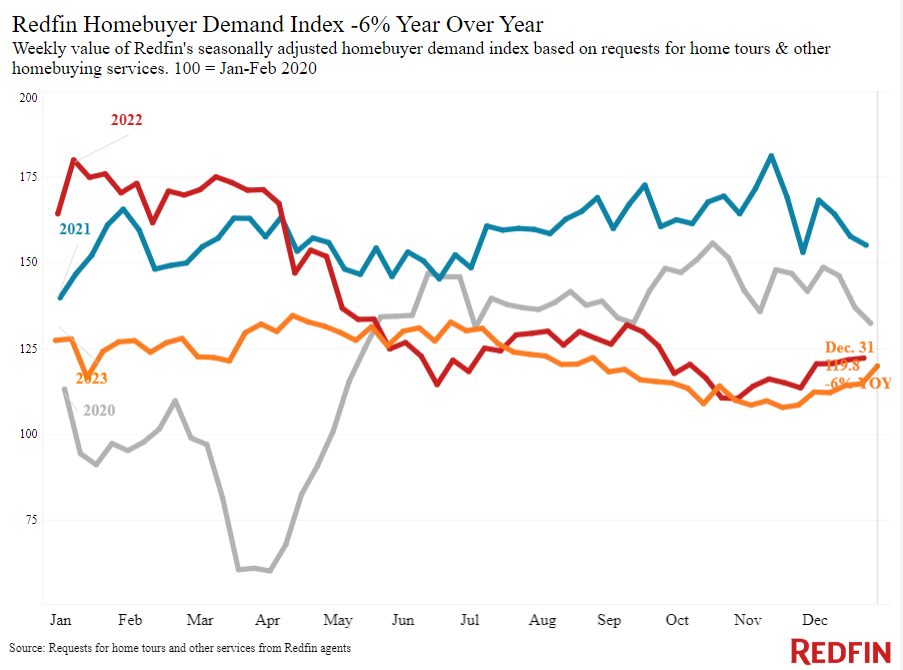
Early-stage homebuying demand is starting to pick up as buyers take advantage of lower rates and more homes to choose from (new listings are up 10% year over year). Redfin’s Homebuyer Demand Index–a seasonally adjusted measure of requests for tours and other homebuying services from Redfin agents–is up 10% from a month ago to its highest level since August. Pending sales are down just 3% annually, the smallest decline in two years.
“There have been more tours and more offers on my listings since mortgage rates started declining,” said Las Vegas Redfin Premier agent Shay Stein. “It’s all about perspective: Two years ago, buyers would have cried about a 6% mortgage rate. Now, they’re happy they’ve dropped down to the mid-6’s.”
Leading indicators
| Indicators of homebuying demand and activity | ||||
| Value (if applicable) | Recent change | Year-over-year change | Source | |
| Daily average 30-year fixed mortgage rate | 6.7% (Jan. 3) | Up from 6.61% a week earlier | Up from 6.45% | Mortgage News Daily |
| Weekly average 30-year fixed mortgage rate | 6.61% (week ending Dec. 28) | Lowest level since May | Up from 6.42% | Freddie Mac |
| Mortgage-purchase applications (seasonally adjusted) | Down 5% from two weeks earlier; down 3% from a month earlier (as of week ending Dec. 29) | Down 12% | Mortgage Bankers Association | |
| Redfin Homebuyer Demand Index (seasonally adjusted) | Highest level since August; Up 10% from a month earlier (as of the week ending Dec. 31) | Down 6% | Redfin Homebuyer Demand Index, a measure of requests for tours and other homebuying services from Redfin agents | |
| Google searches for “home for sale” | Up 3% from a month earlier (as of Dec. 30) | Down 20% | Google Trends | |
Key housing-market data
| U.S. highlights: Four weeks ending December 31, 2023
Redfin’s national metrics include data from 400+ U.S. metro areas, and is based on homes listed and/or sold during the period. Weekly housing-market data goes back through 2015. Subject to revision. |
|||
| Four weeks ending December 31, 2023 | Year-over-year change | Notes | |
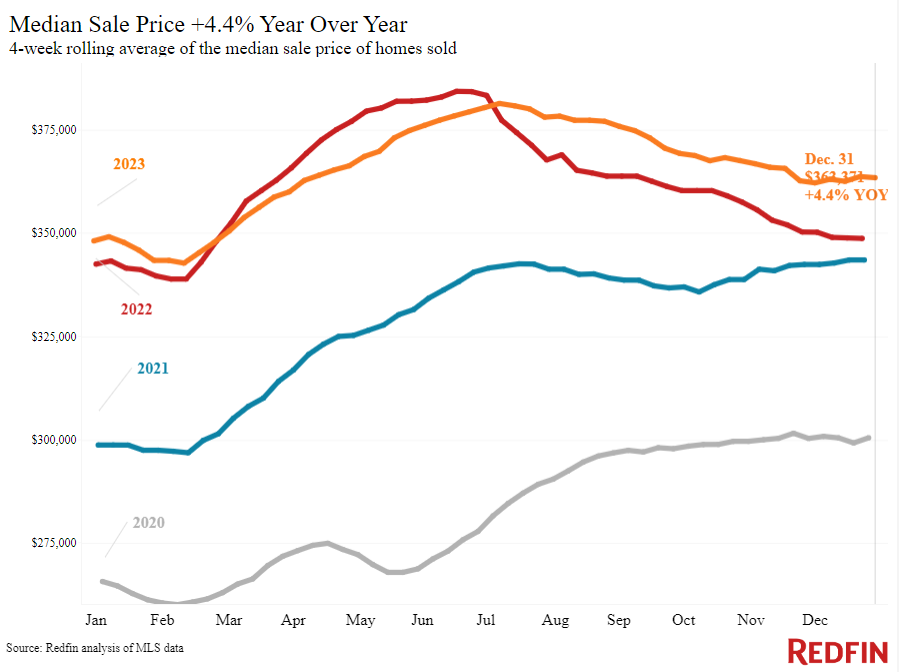
| Median sale price | $363,371 | 4.4% | Biggest increase since Oct. 2022. |
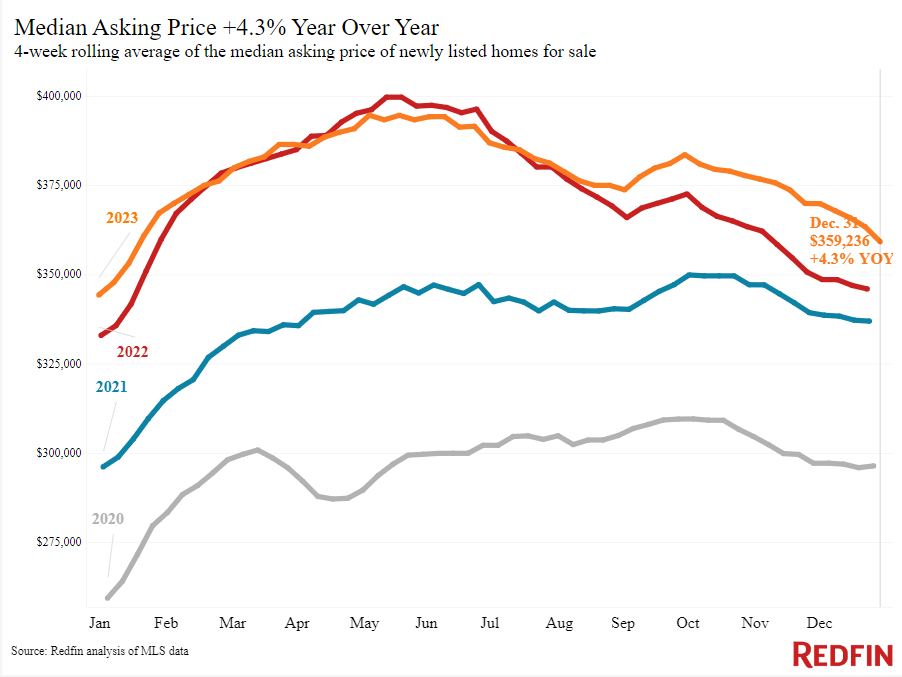
| Median asking price | $359,236 | 4.3% | |
| Median monthly mortgage payment | $2,361 at a 6.61% mortgage rate | 5.4% | Down $372 (-14%) from all-time high set during the four weeks ending Oct. 22. Lowest level since Feb. |
| Pending sales | 52,552 | -3.3% | Smallest decline since Jan. 2022. |
| New listings | 44,297 | 9.5% | |
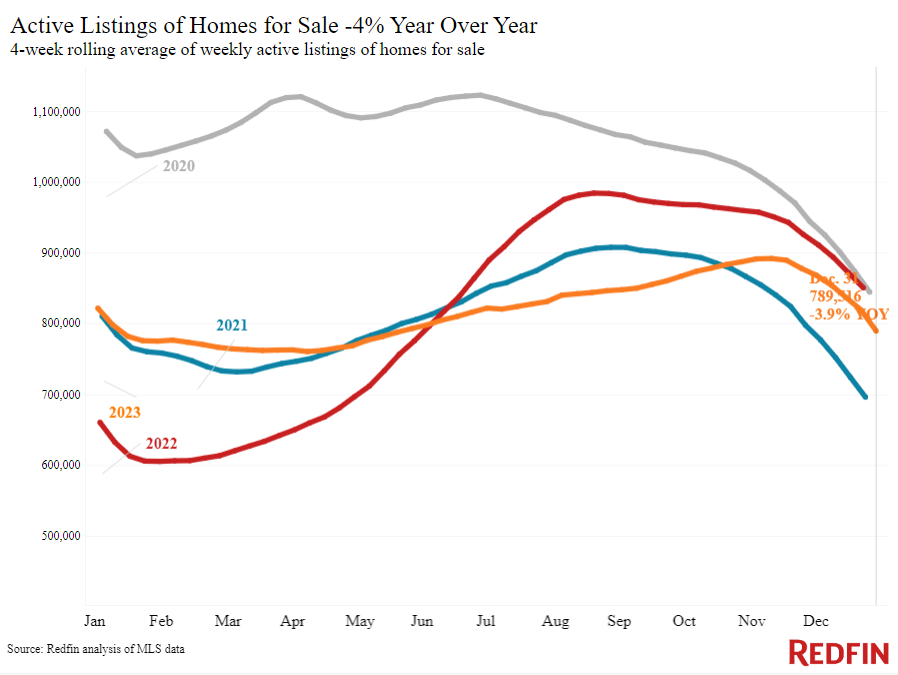
| Active listings | 789,516 | -3.9% | Smallest decline since June |
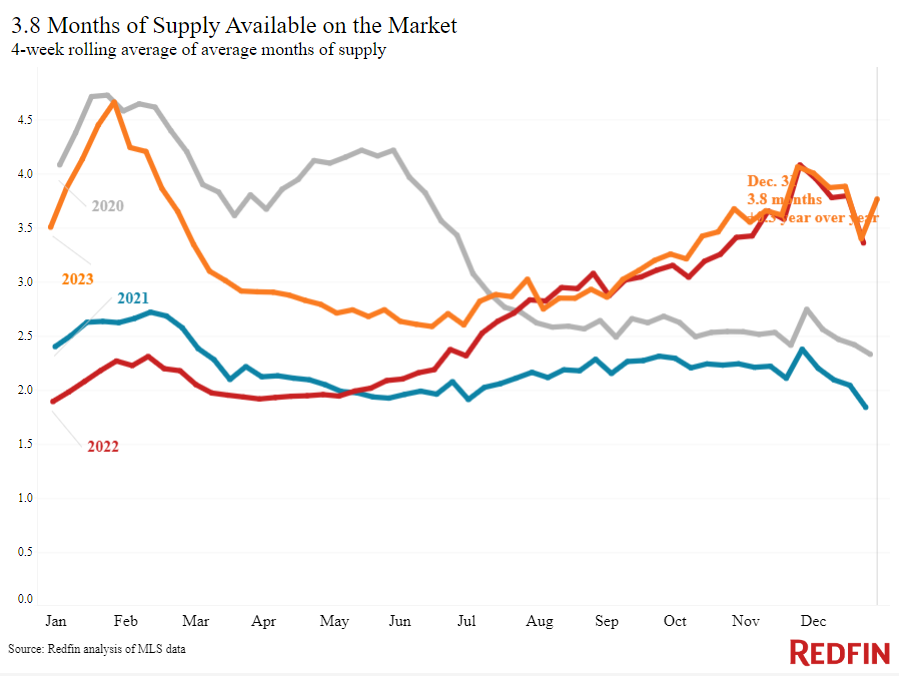
| Months of supply | 3.8 months | +0.3 pts. | 4 to 5 months of supply is considered balanced, with a lower number indicating seller’s market conditions. |
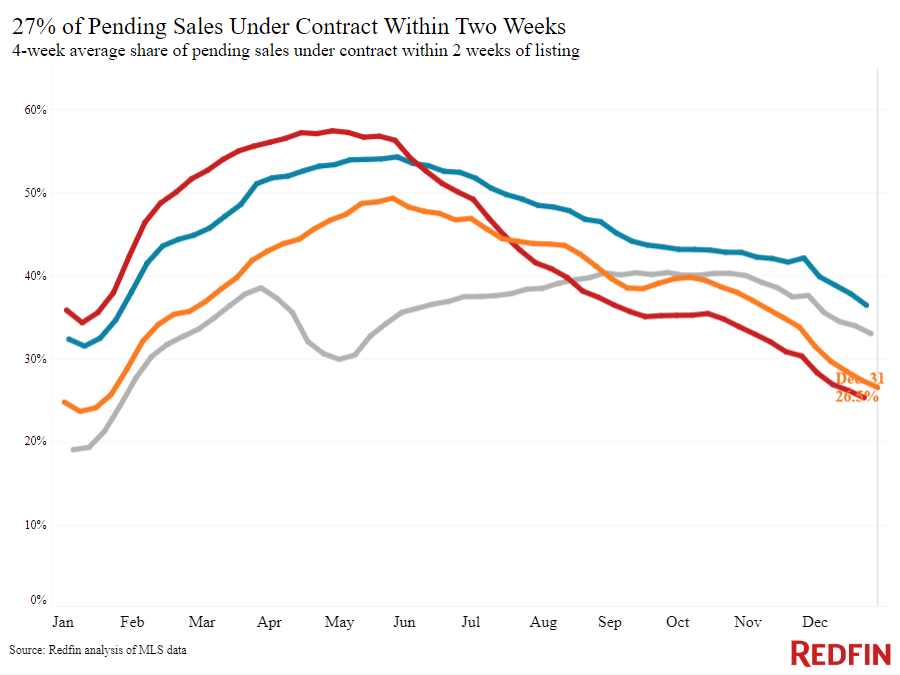
| Share of homes off market in two weeks | 26.5% | Up from 25% | |
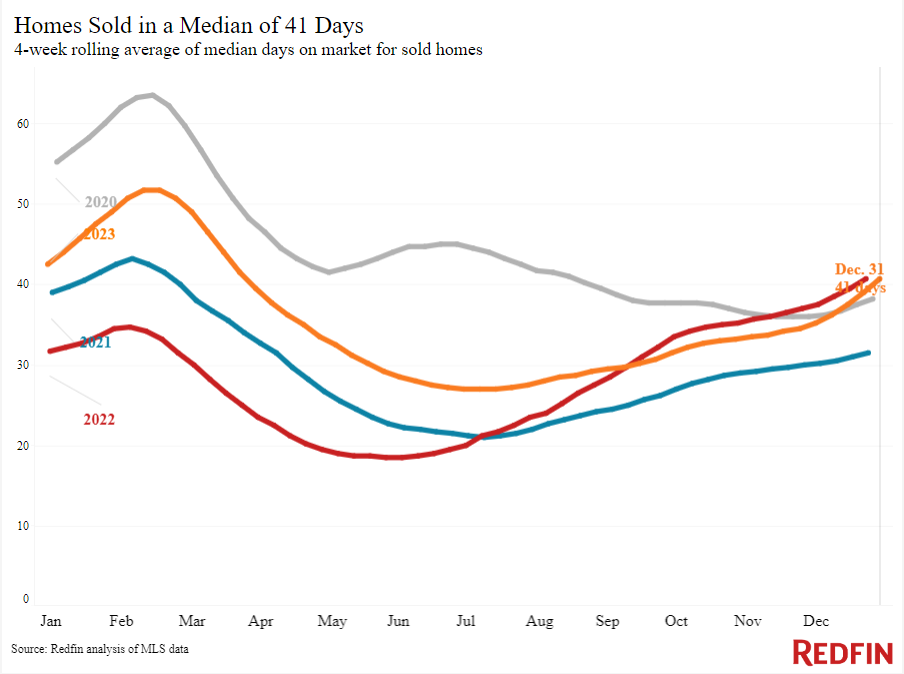
| Median days on market | 41 | -2 days | |
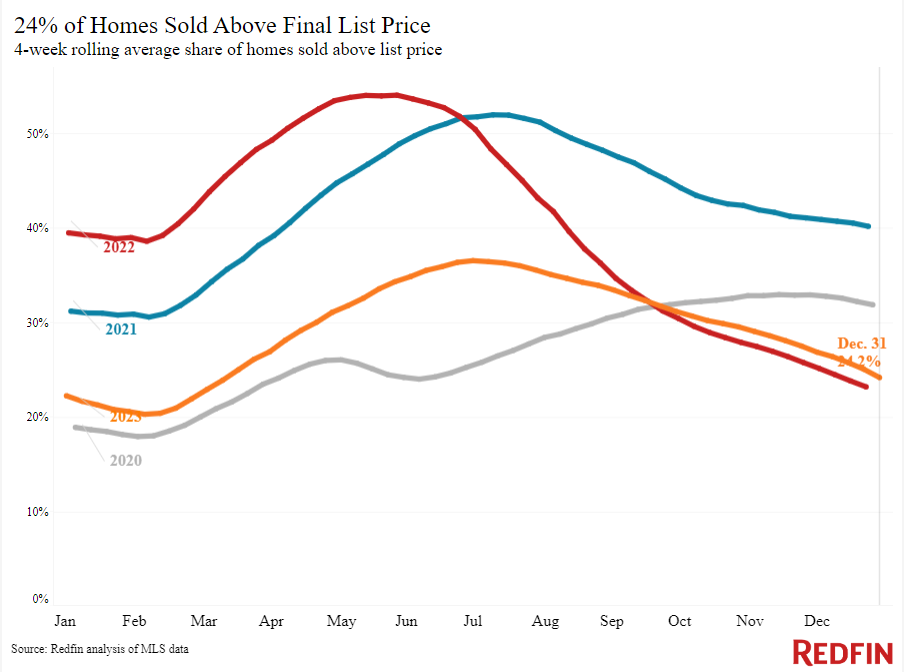
| Share of homes sold above list price | 24.2% | Up from 23% | |
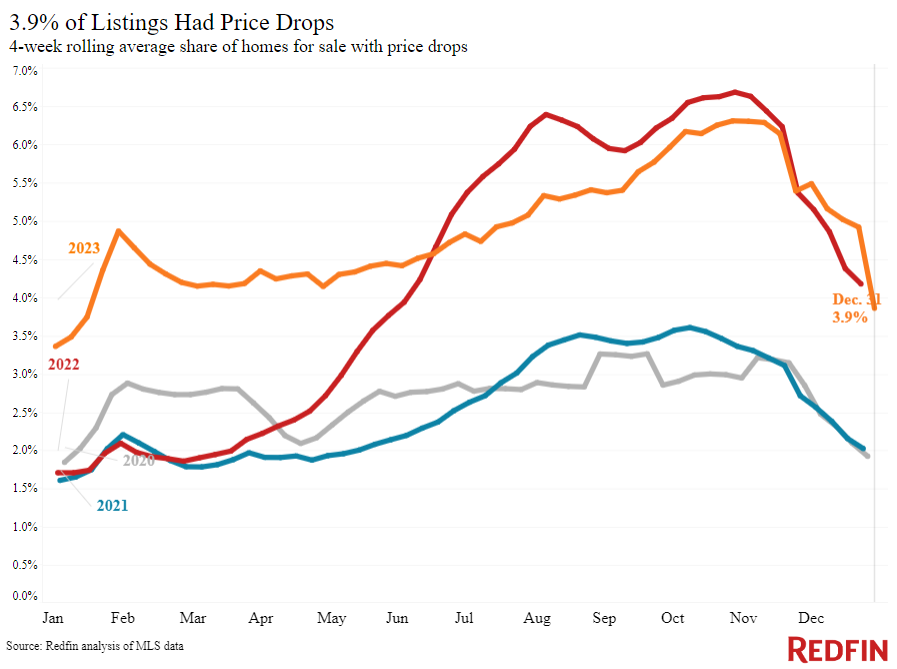
| Share of homes with a price drop | 3.9% | +0.5 pts. | |
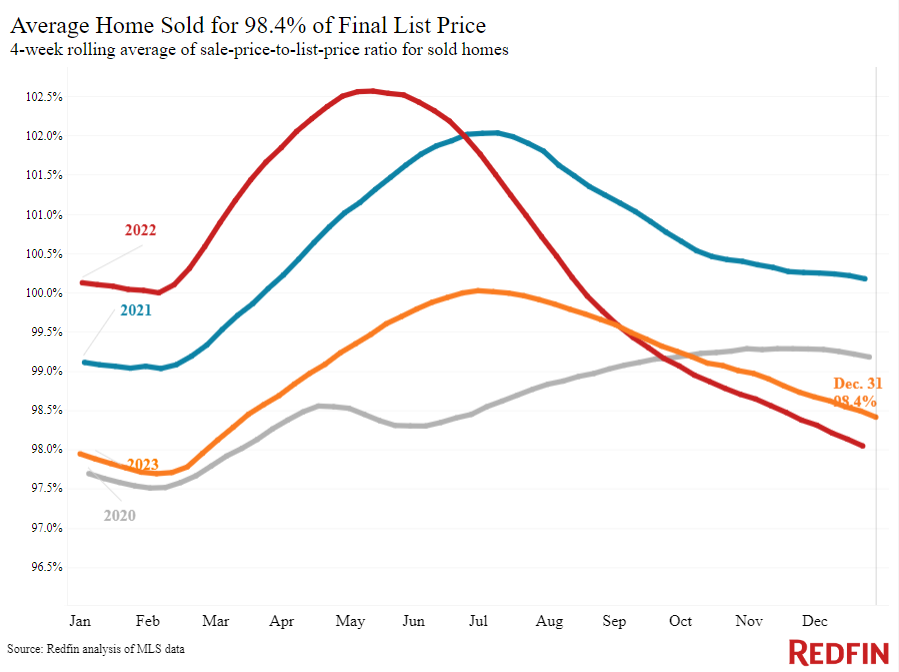
| Average sale-to-list price ratio | 98.4% | +0.5 pts. | |
| Metro-level highlights: Four weeks ending December 31, 2023
Redfin’s metro-level data includes the 50 most populous U.S. metros. Select metros may be excluded from time to time to ensure data accuracy. |
|||
| Metros with biggest year-over-year increases | Metros with biggest year-over-year decreases | Notes | |
| Median sale price | Newark, NJ (18.2%)
Anaheim, CA (18.1%) West Palm Beach, FL (15.2%) Fort Lauderdale, FL (15.1%) Miami (11.7%) |
Fort Worth, TX (-3.1%)
Austin, TX (-1.7%) San Francisco (-1.1%) Denver (-0.4%) |
Declined in 4 metros |
| Pending sales | Dallas (11.3%)
Milwaukee (9.3%) Cleveland, OH (6.3%) San Jose, CA (5.6%) Chicago (5.6%) |
Providence, RI (-15.4%)
New Brunswick, NJ (-13.6%) Newark, NJ (-12.5%) New York (-10.8%) Atlanta (-10%) |
Increased in 13 metros |
| New listings | Phoenix (23.5%)
Montgomery County, PA (21.9%) Austin, TX (20.9%) San Antonio, TX (18.3%) Dallas (16.4%) |
San Francisco (-35.3%)
Atlanta (-11.5%) Providence, RI (-9.8%) Indianapolis, IN (-6.9%) Warren, MI (-5.6%) |
Declined in 11 metros |
Refer to our metrics definition page for explanations of all the metrics used in this report.