Elevated mortgage rates, along with prices that remain high–despite posting a 1% annual drop– pushed monthly housing payments to a record high of nearly $2,600. That’s dampening demand and preventing many would-be sellers from listing their homes.
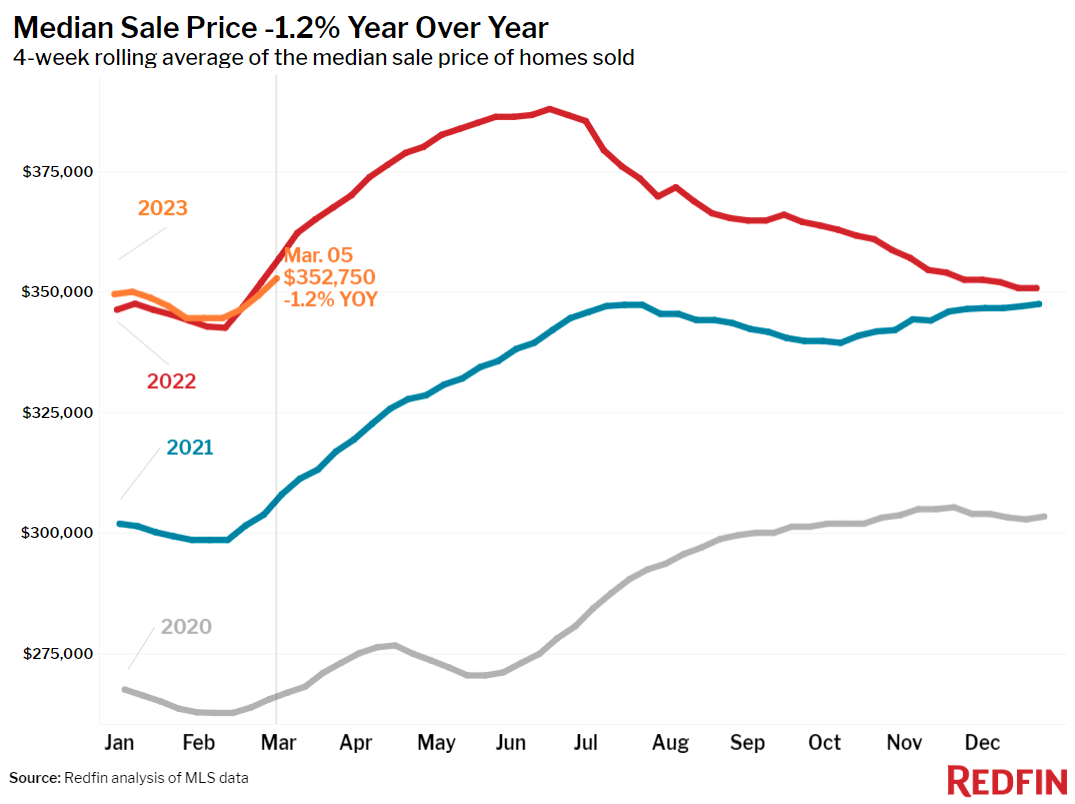
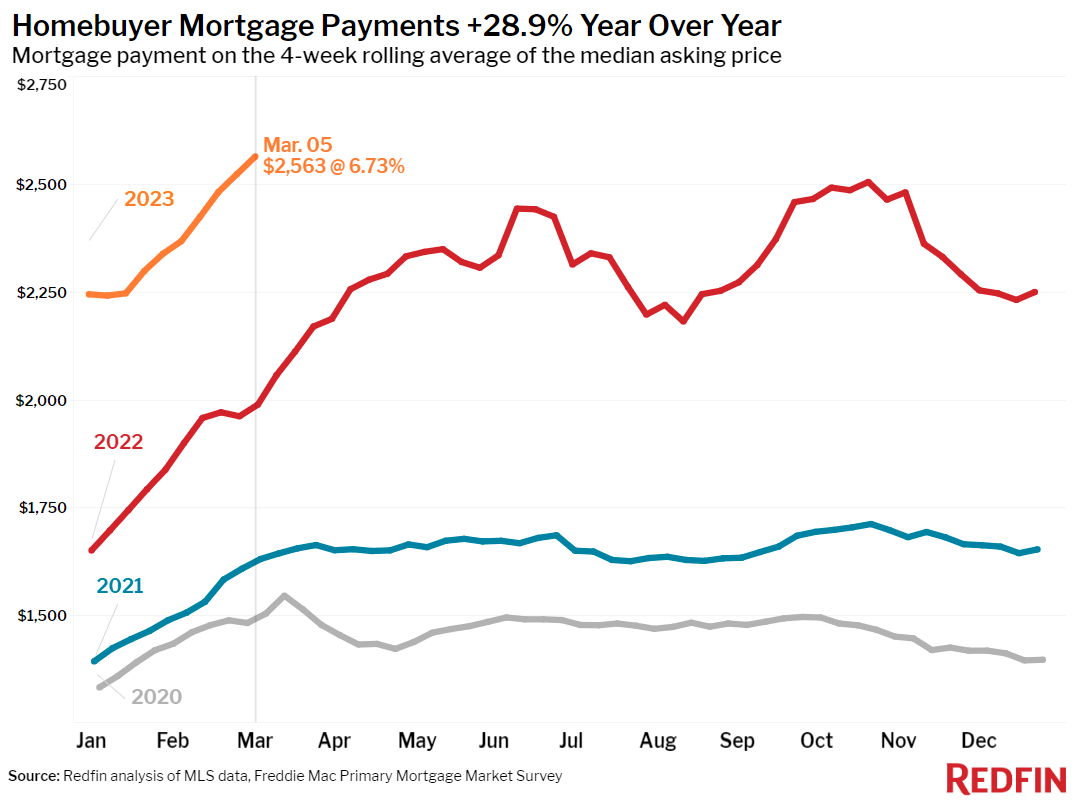
The typical homebuyer’s monthly payment hit a new all-time high of $2,563 this week, up 29% from $1,988 a year ago. Rising mortgage rates sent monthly payments to new heights this week despite home prices dropping: The typical U.S. home-sale price fell 1% year over year during the four weeks ending March 5.
To look at the hit on homebuying affordability another way, a homebuyer on a $2,500 monthly budget can afford a $376,000 home with today’s average rate. That’s down from the $400,000 home a buyer on the same budget could have bought a month ago when rates dropped to 6%.
Spending power has declined even more dramatically when compared to a year ago, when mortgage rates were sitting at 3.85% and the typical U.S. buyer could afford a $480,000 home.
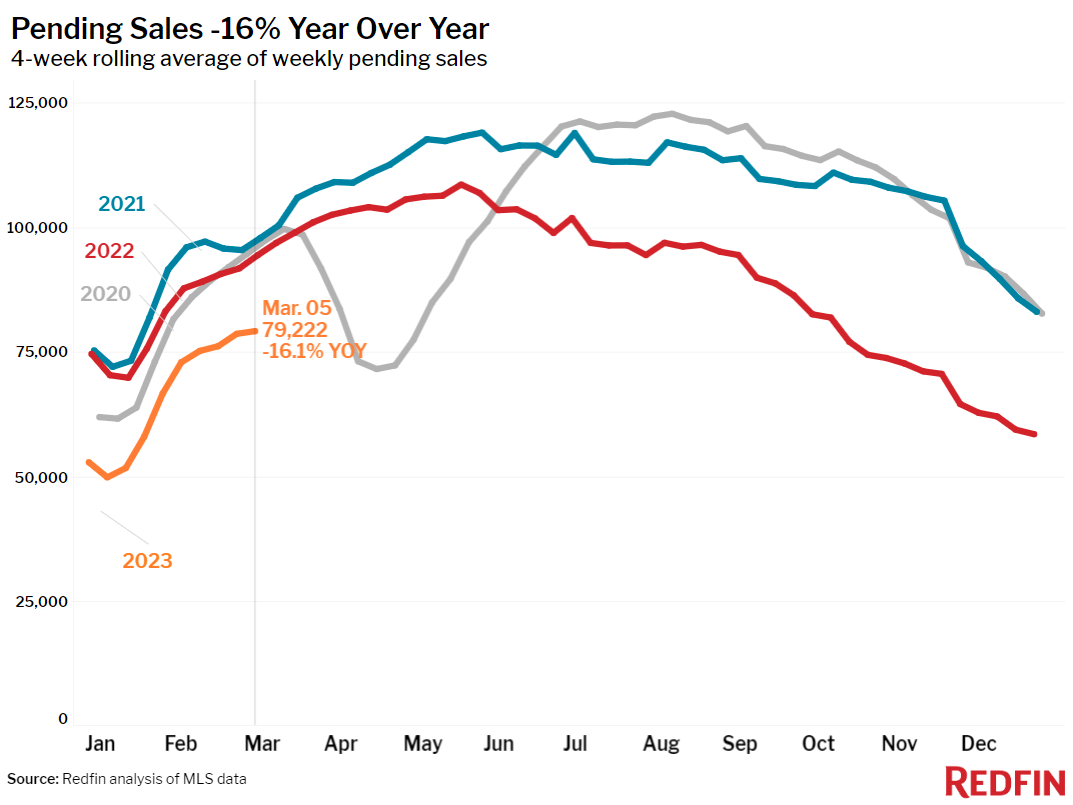
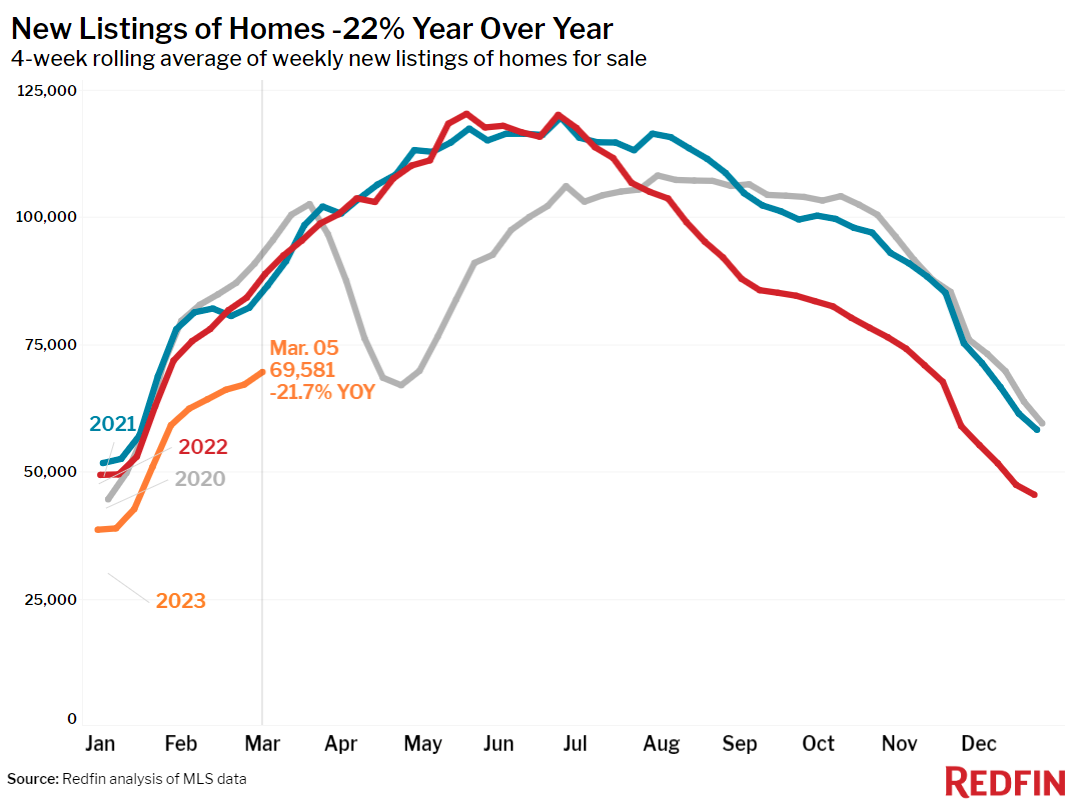
High monthly payments are deterring would-be homebuyers and sellers who want to hang onto their relatively low rates. Pending home sales declined 16.1% year over year and were essentially flat from a week earlier, defying seasonal trends; pending sales typically increase throughout March. New listings of homes for sale dropped 21.7%, the biggest decline in two months. That’s a reversal from January and early February, when the dropoff in both pending sales and new listings was easing as the housing market started to thaw. Redfin’s Homebuyer Demand Index–a measure of home tours and other buying services from Redfin agents–is down 4% from a week ago and 27% from a year ago.
“All eyes are on inflation as it continues to have a huge impact on mortgage rates and the housing market,” said Redfin Deputy Chief Economist Taylor Marr. “The Fed said this week that it may hike interest rates more than anticipated to combat persistent inflation. That news kept mortgage rates propped up, but next week’s official February inflation reading could send them meaningfully up or down. Homebuyers and sellers are ultra-sensitive to mortgage-rate fluctuations, so rates starting to decline would likely bring some buyers and sellers back–and rates rising would push more away.”
Some measures of homebuying demand are up from the low points they reached last fall. Redfin’s Homebuyer Demand Index is up 16% from its late-October trough and pending home sales aren’t declining nearly as fast as they were in November.
Leading indicators of homebuying activity:
- For the week ending March 9, average 30-year fixed mortgage rates rose to 6.73%, marking the fifth straight week of increases. The daily average was 7.05% on March 8.
- Mortgage-purchase applications during the week ending March 3 increased 7% from a week earlier, seasonally adjusted–but mortgage activity is still quite slow; applications had dropped to a 30-year low the week before and they’re down 3.7% from the low point they hit in October. Purchase applications were down 42% from a year earlier.
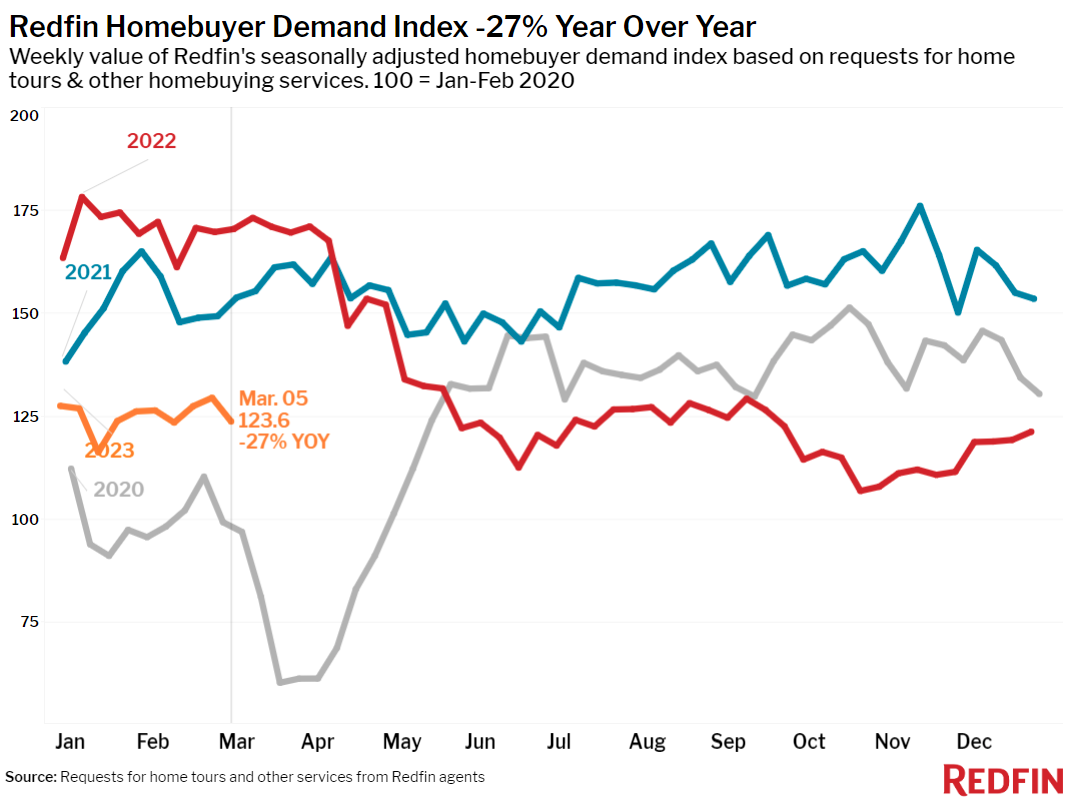
- The seasonally adjusted Redfin Homebuyer Demand Index–a measure of requests for home tours and other homebuying services from Redfin agents–fell 4% from a week earlier and 2% from a month earlier during the week ending March 5. It was down 27% from a year earlier.
- Google searches for “homes for sale” were up about 48% from the trough they hit in December during the week ending March 4, but down about 13% from a year earlier.
- Touring activity as of March 4 was up about 16% from the start of the year, compared with a 23% increase at the same time last year, according to home tour technology company ShowingTime.
Key housing market takeaways for 400+ U.S. metro areas:
Unless otherwise noted, the data in this report covers the four-week period ending March 5. Redfin’s weekly housing market data goes back through 2015.
Data based on homes listed and/or sold during the period:
- The median home sale price was $352,750, down 1.2% from a year earlier, the biggest decline in more than a decade. Redfin’s monthly dataset, which goes back through 2012, shows that the last time home prices declined more was February 2012, when they dropped 1.5%.
- Median sale prices fell in 23 of the 50 most populous U.S. metros, with the biggest drops in pandemic homebuying hotspots and northern California. San Jose, CA (-14.6% YoY) experienced the biggest decline, followed by San Francisco (-12.2%), Austin, TX (-12.1%), Oakland, CA (-10.7%) and Phoenix (-8.3%). That’s the biggest sale-price drop on record for all five of those metros.
- Sale prices increased most in Milwaukee (10.4% YoY), West Palm Beach, FL (10.3%), Columbus, OH (8.4%), Miami (7%) and Virginia Beach, VA (6.4%).
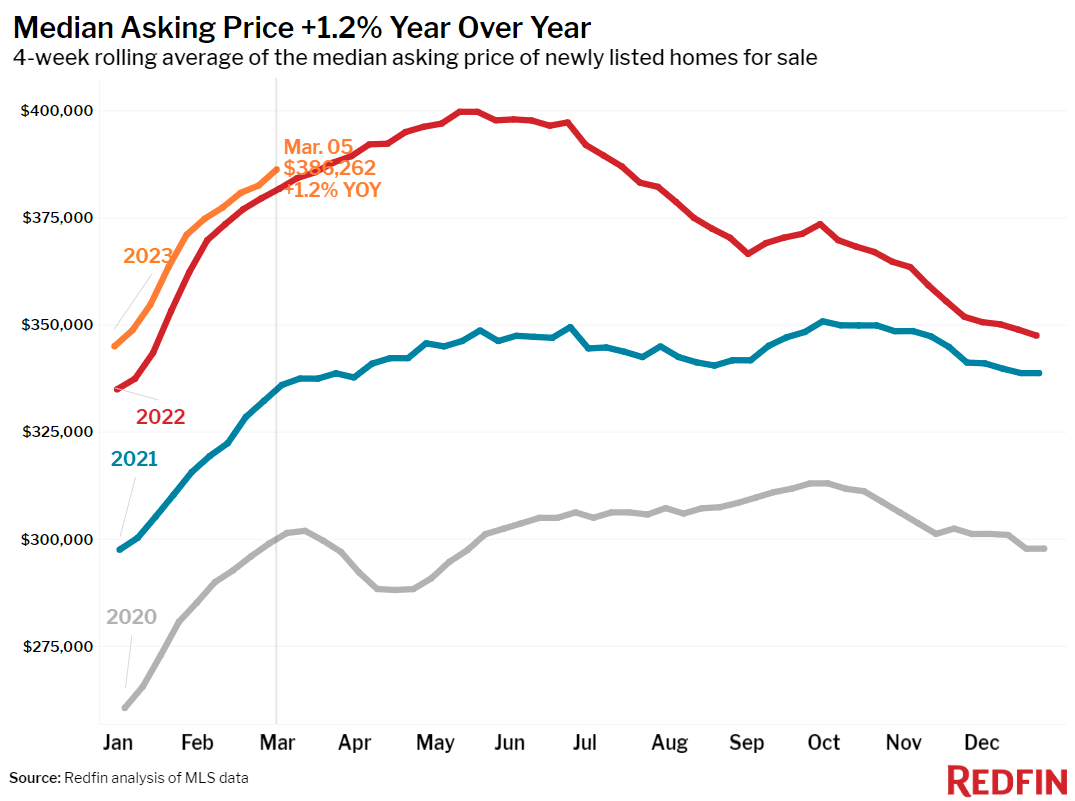
- The median asking price of newly listed homes was $386,262, up 1.2% year over year.
- The monthly mortgage payment on the median-asking-price home was $2,563 at a 6.73% mortgage rate, the current weekly average. That’s an all-time high. Monthly mortgage payments are up 29% ($575) from a year ago.
- Pending home sales were down 16.1% year over year.
- Pending home sales fell in all 50 of the most populous U.S. metros. They fell most in Las Vegas (-54.9% YoY), Portland, OR (-47.5%), Riverside, CA (-46.7%), Seattle (-45.4%) and Sacramento, CA (-44.9%).
- New listings of homes for sale fell 21.7% year over year, the biggest decline in two months.
- New listings declined in all 50 of the most populous U.S. metros, with the biggest declines in Sacramento (-45.6%), Oakland (-44.5%), Portland, OR (-42.3%), San Jose (-42.1%), and Seattle (-41.2%).
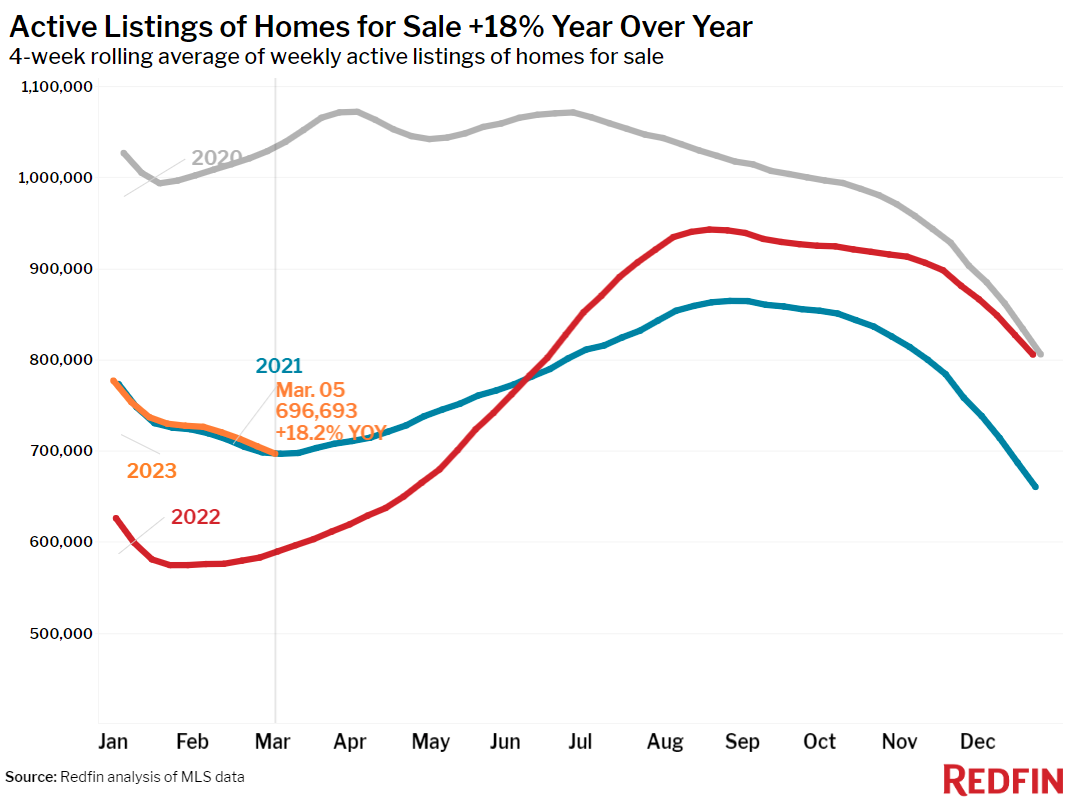
- Active listings (the number of homes listed for sale at any point during the period) were up 18.2% from a year earlier, the smallest increase in three months.
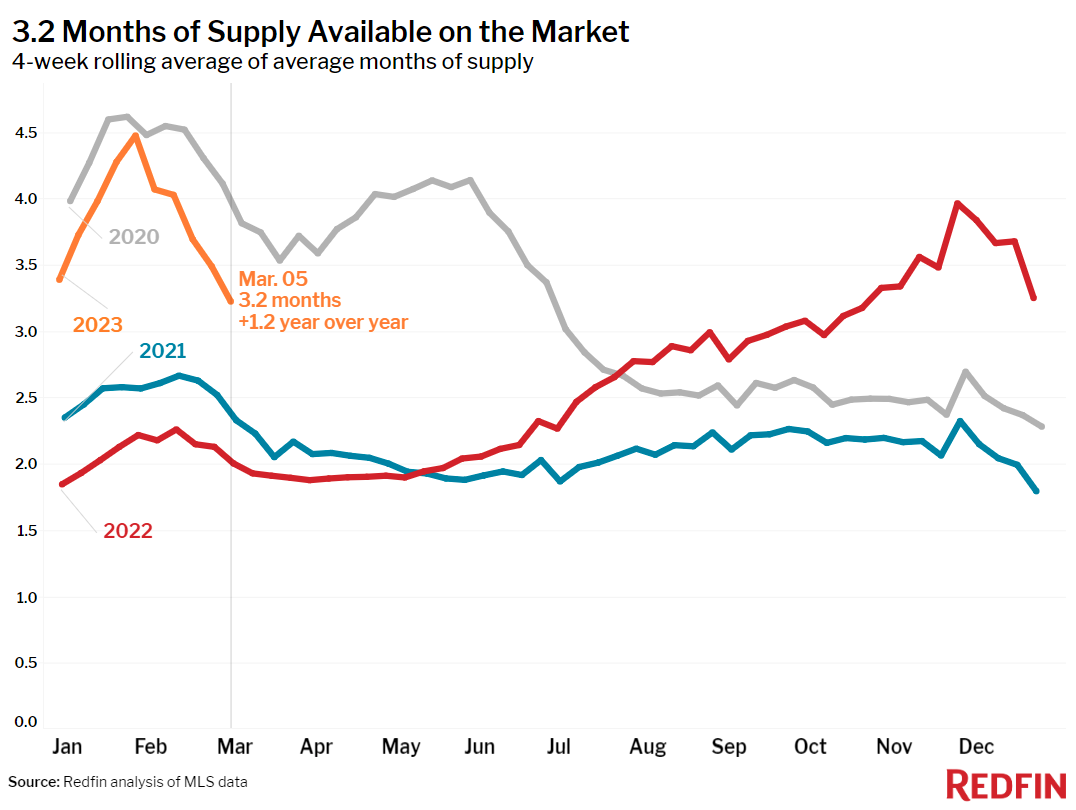
- Months of supply—a measure of the balance between supply and demand, calculated by the number of months it would take for the current inventory to sell at the current sales pace—was 3.2 months, down from 4.1 months a month earlier and up from 2 months a year earlier.
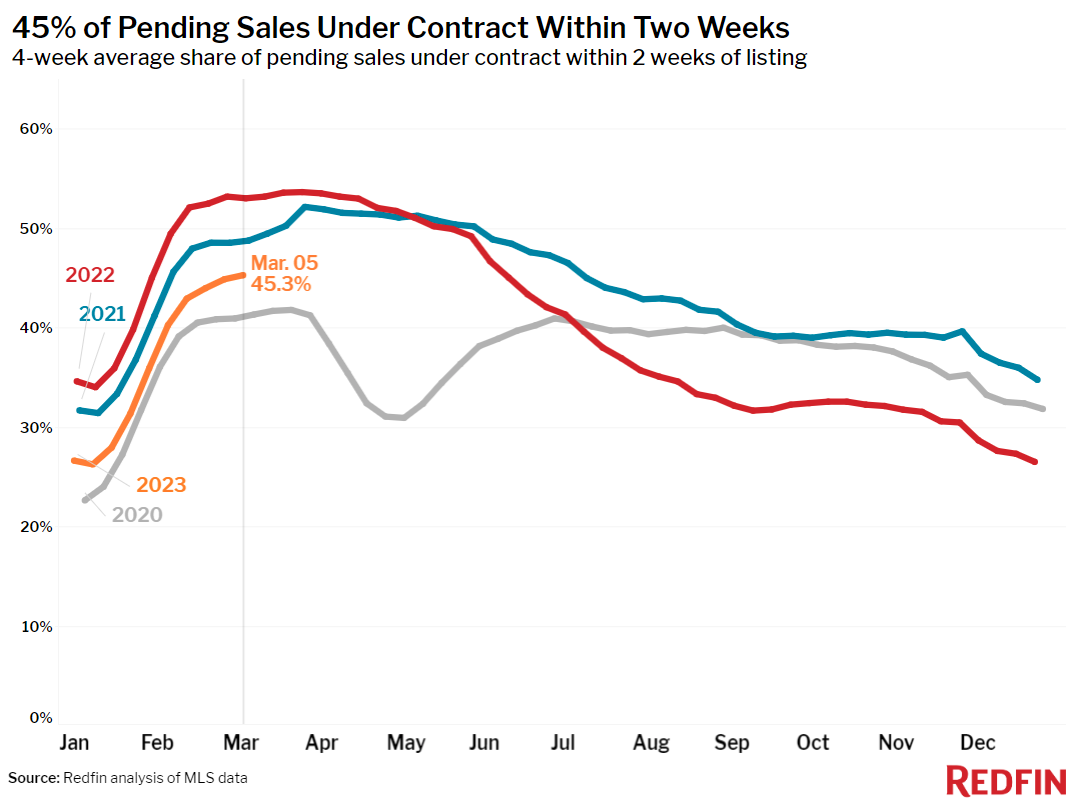
- 45% of homes that went under contract had an accepted offer within the first two weeks on the market, the highest level since June, but down from 53% a year earlier.
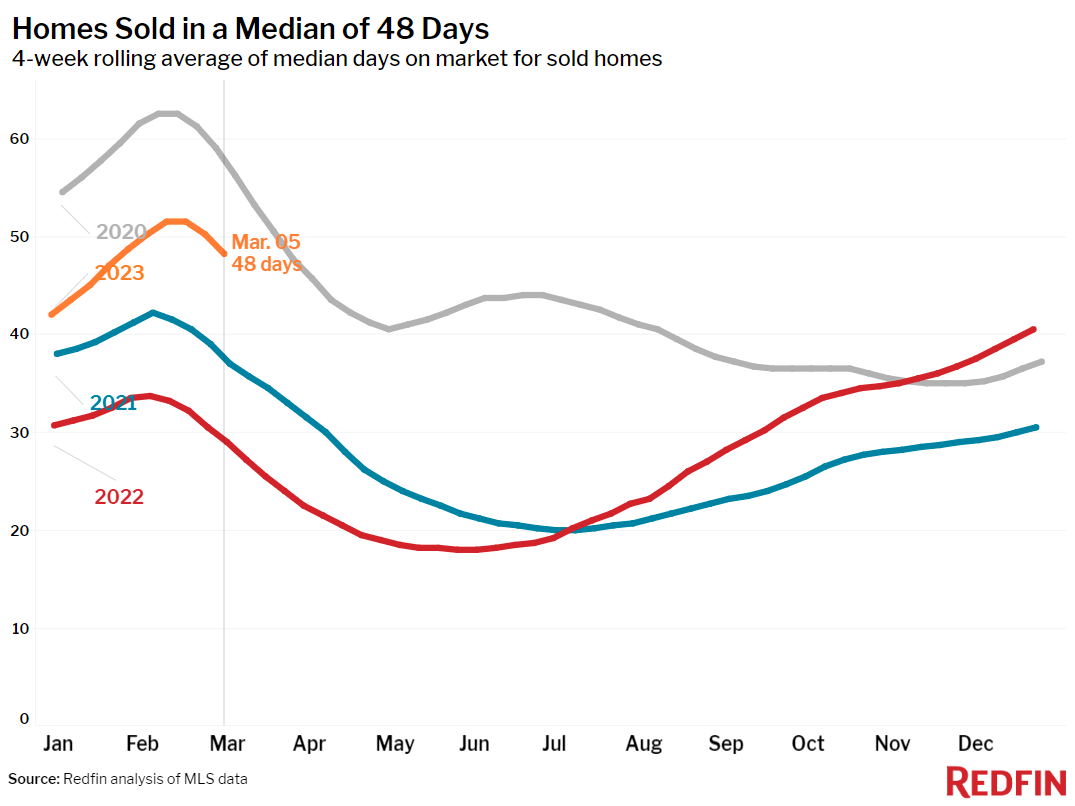
- Homes that sold were on the market for a median of 48 days. That’s up from 29 days a year earlier and the record low of 18 days set in May.
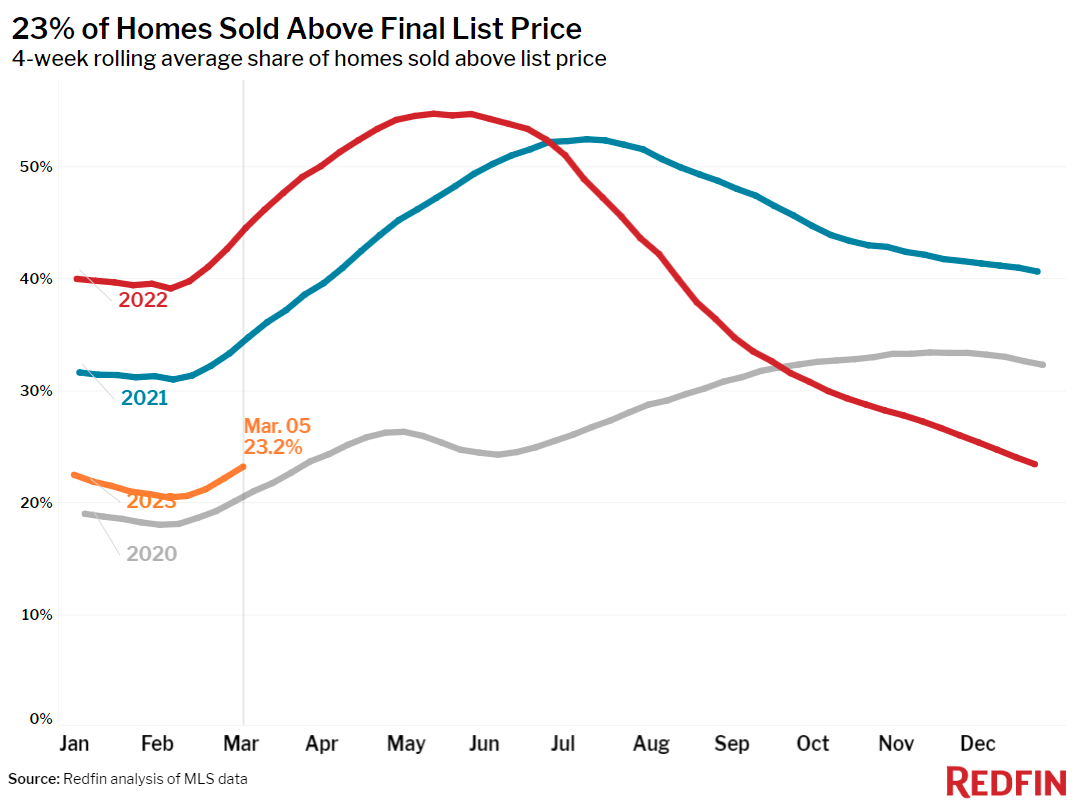
- 23% of homes sold above their final list price, down from 45% a year earlier.
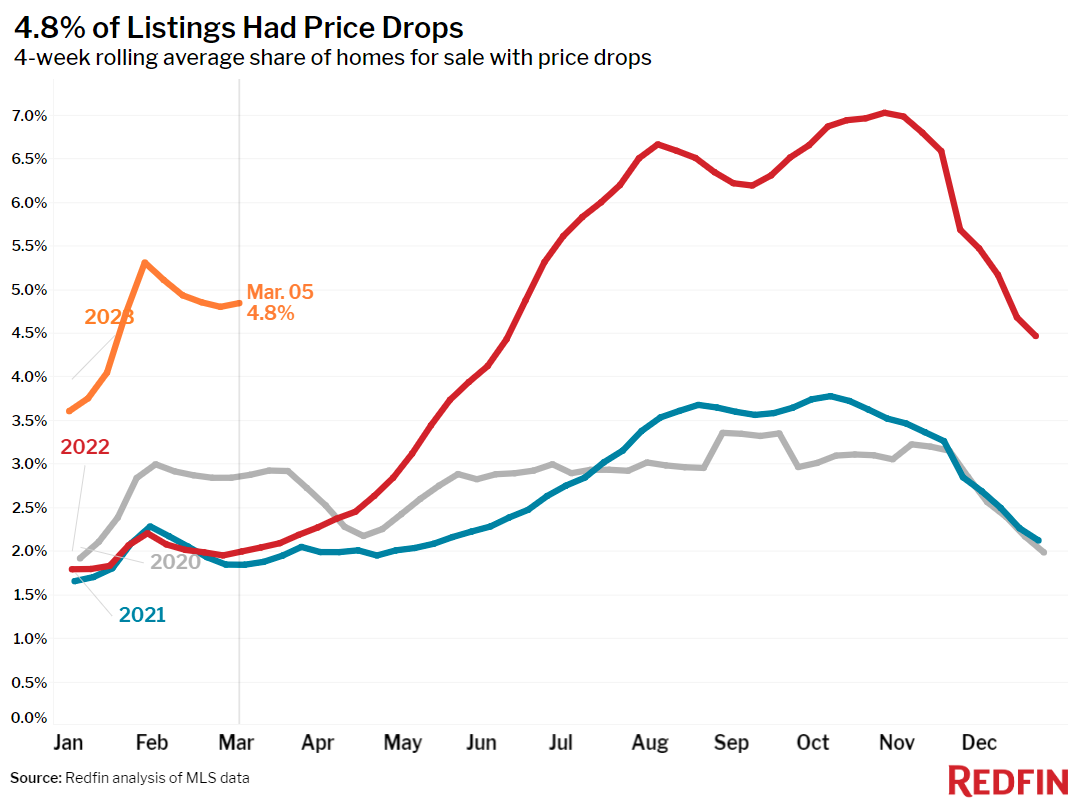
- On average, 4.8% of homes for sale each week had a price drop, up from 2% a year earlier.
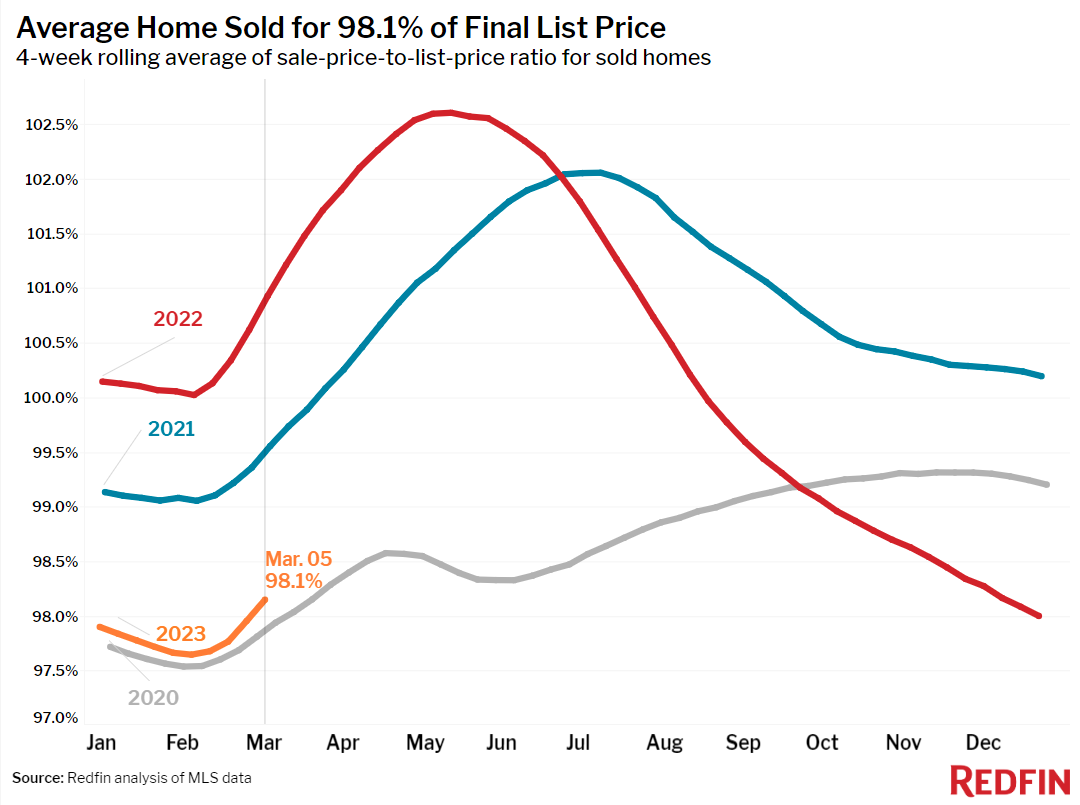
- The average sale-to-list price ratio, which measures how close homes are selling to their final asking prices, was 98.1%, the highest level in roughly three months but down from 100.9% a year earlier.
Refer to our metrics definition page for explanations of all the metrics used in this report.