A homebuyer on a $3,000 monthly budget has lost nearly $40,000 in purchasing power over the last year, as mortgage rates have risen from around 6.5% in October 2022 to nearly 8% today. The glimmer of hope for the housing market: a small September uptick in new listings.
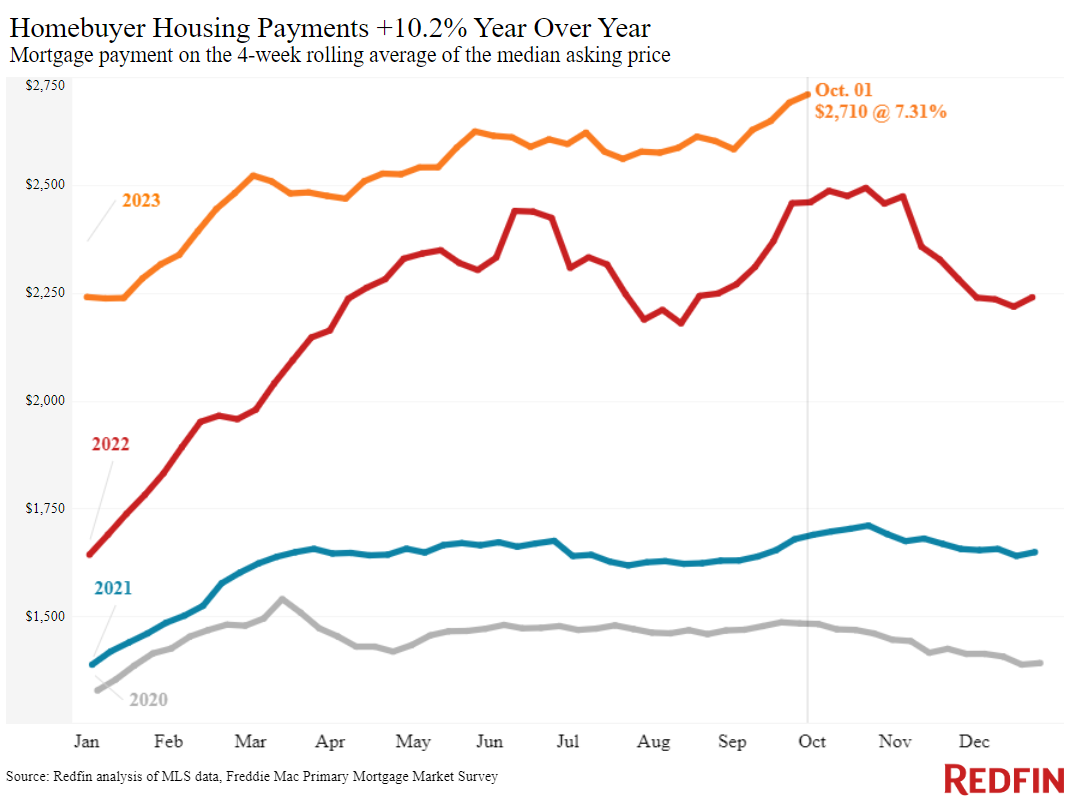
Mortgage rates hit their highest level in more than 20 years this week, pushing homebuyers’ monthly housing payments to all-time highs. A buyer on a $3,000 monthly budget, for instance, can afford a $419,000 home with a 7.7% mortgage rate, roughly the daily average on October 4. That buyer has lost $38,000 in purchasing power since last October, when they could have bought a $457,000 home with a 6.6% rate. And by that time, buyers had already lost a significant amount of purchasing power since the start of the year, as mortgage rates doubled throughout 2022: A buyer on a $3,000 budget could have purchased a $595,000 home with the 3.5% rates common at the start of 2022.
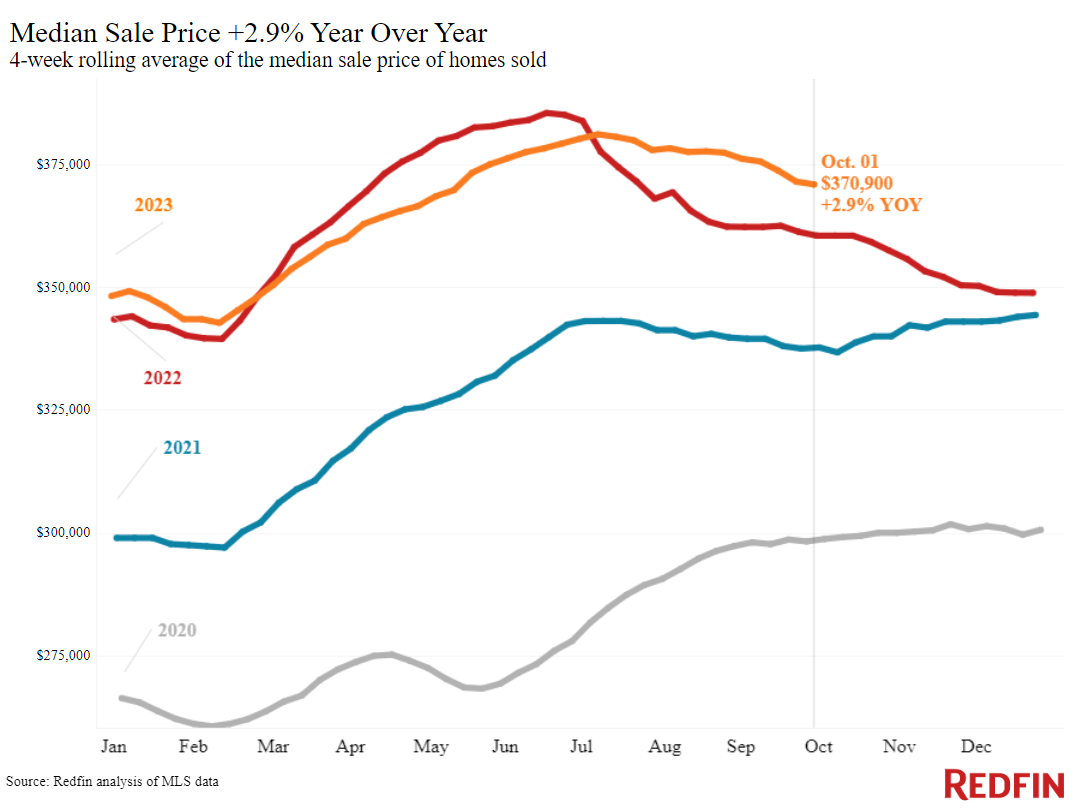
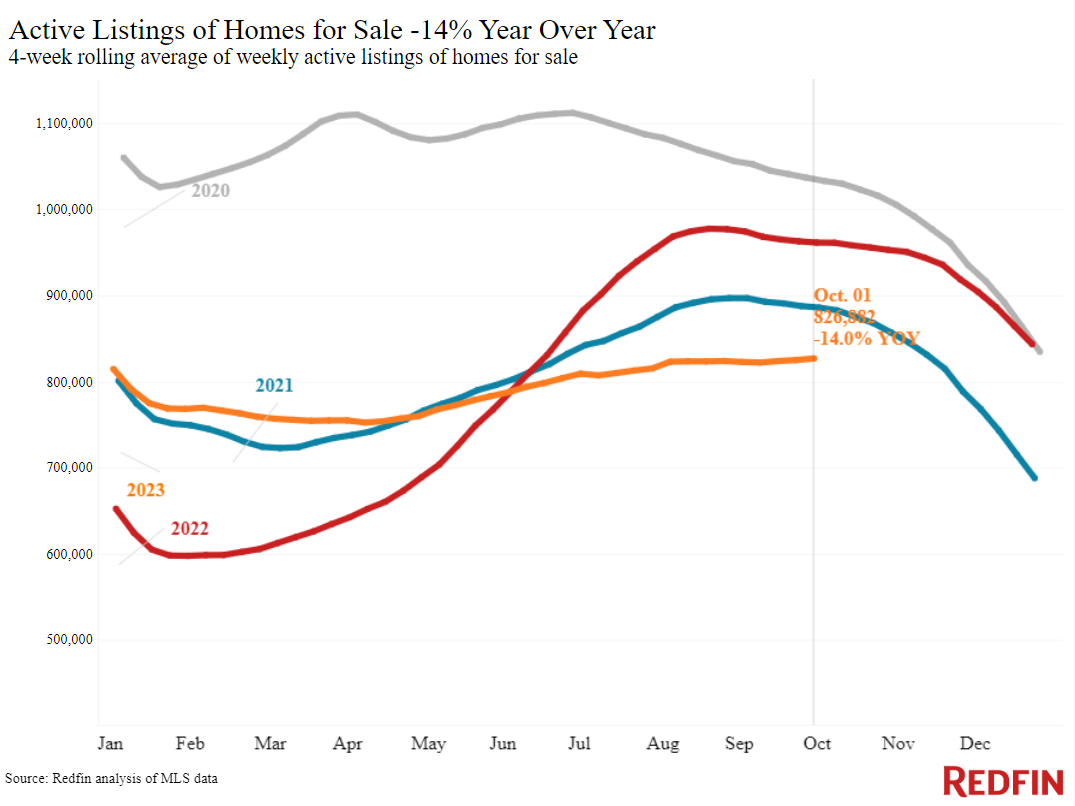
In addition to sky-high mortgage rates, rising home prices are cutting into buyers’ budgets. The typical U.S. home sold for $371,000 during the four weeks ending October 1, up 3% from a year earlier. That’s because there aren’t enough homes for sale. High housing costs are pushing demand down, with mortgage-purchase applications dropping to their lowest level in nearly 30 years. But inventory is falling significantly, too, as homeowners hang onto relatively low rates: The total number of homes for sale is down 14%.
Why mortgage rates are rising–again: “There are several reasons why mortgage rates are still climbing,” said Redfin Economic Research Lead Chen Zhao. “The Fed hinted that another interest-rate hike before the end of the year is likely, the latest job market data came in stronger than expected, and the yield curve is steepening as investors prepare for higher rates for longer. Turmoil in Congress isn’t helping, either, as the clash among House Republicans stemming from the narrowly missed government shutdown is causing volatility in stock and bond markets. ”
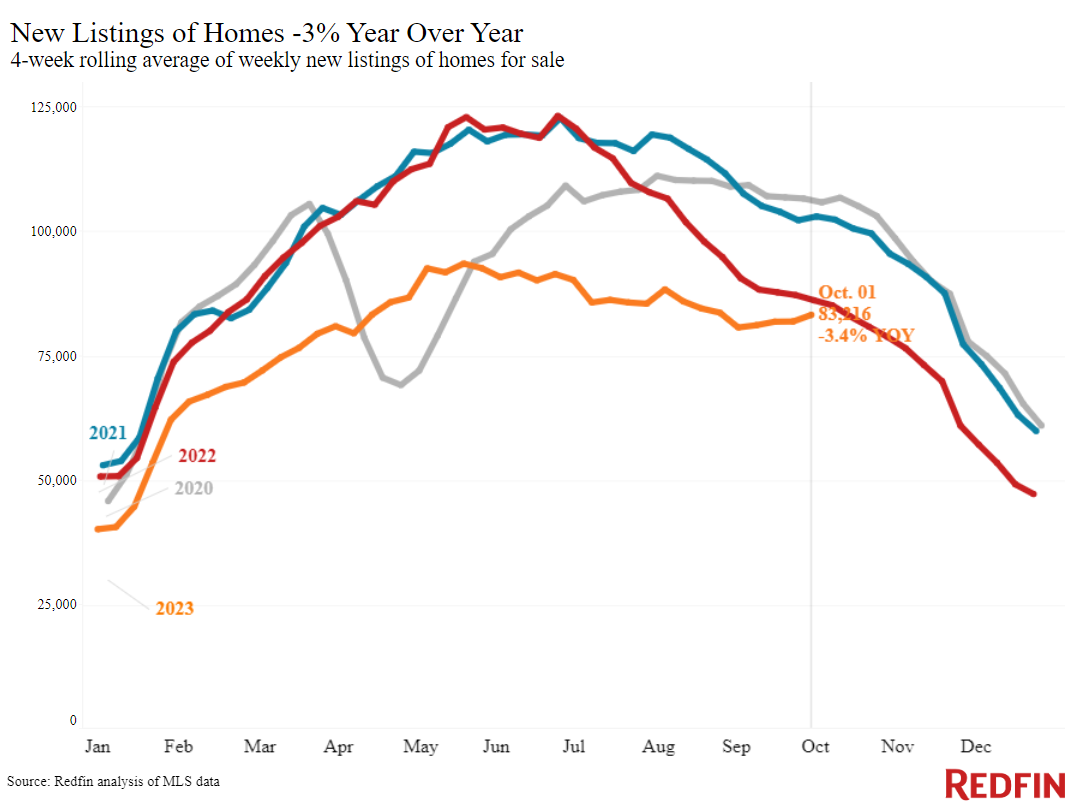
The silver lining for buyers: More homeowners are listing their homes for sale after months of steady decline. New listings rose 3% in September, and so far this fall listings haven’t declined as much from the summer as they typically do. That may be partly because listings didn’t have much more room to fall–but nonetheless, it’s a glimmer of hope for buyers because it means they have a bit more to choose from and could eventually ease price increases.
Leading indicators
| Indicators of homebuying demand and activity | ||||
| Value (if applicable) | Recent change | Year-over-year change | Source | |
| Daily average 30-year fixed mortgage rate | 7.7% (Oct. 4) | Highest level in over 2 decades | Up from 6.65% | Mortgage News Daily |
| Weekly average 30-year fixed mortgage rate | 7.31% (week ending Sept. 28) | Highest level in nearly 23 years | Up from 6.7% | Freddie Mac |
| Mortgage-purchase applications (seasonally adjusted) | Down 6% from a week earlier (as of week ending Sept. 29) | Down 22% to lowest level in nearly 30 years | Mortgage Bankers Association | |
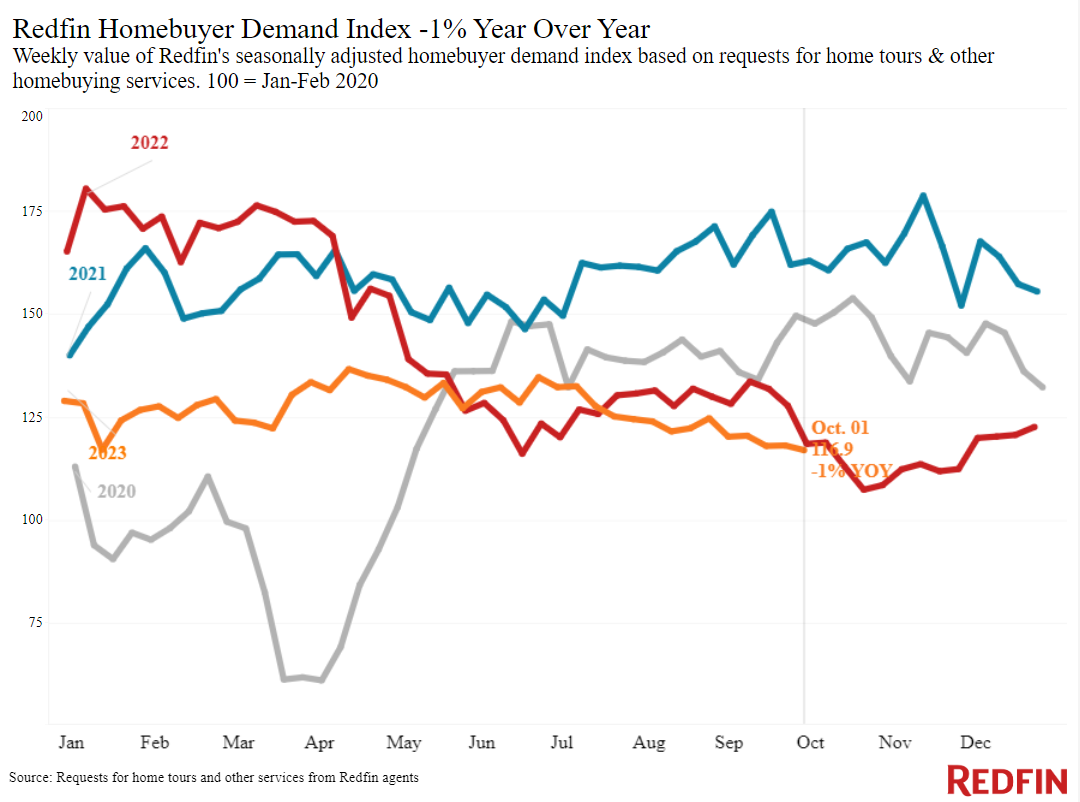
| Redfin Homebuyer Demand Index (seasonally adjusted) | Down 3% from a month earlier (as of the 4 weeks ending Oct. 1), close to its lowest level since January | Down 1% | Redfin Homebuyer Demand Index, a measure of requests for tours and other homebuying services from Redfin agents | |
| Google searches for “home for sale” | Down 9% from a month earlier (as of Sept. 30) | Down 6% | Google Trends | |
Key housing-market data
| U.S. highlights: Four weeks ending October 1, 2023
Redfin’s national metrics include data from 400+ U.S. metro areas, and is based on homes listed and/or sold during the period. Weekly housing-market data goes back through 2015. Subject to revision. |
|||
| Four weeks ending October 1, 2023 | Year-over-year change | Notes | |
| Median sale price | $370,900 | 2.9% | Prices are up partly because elevated mortgage rates were hampering prices during this time last year |
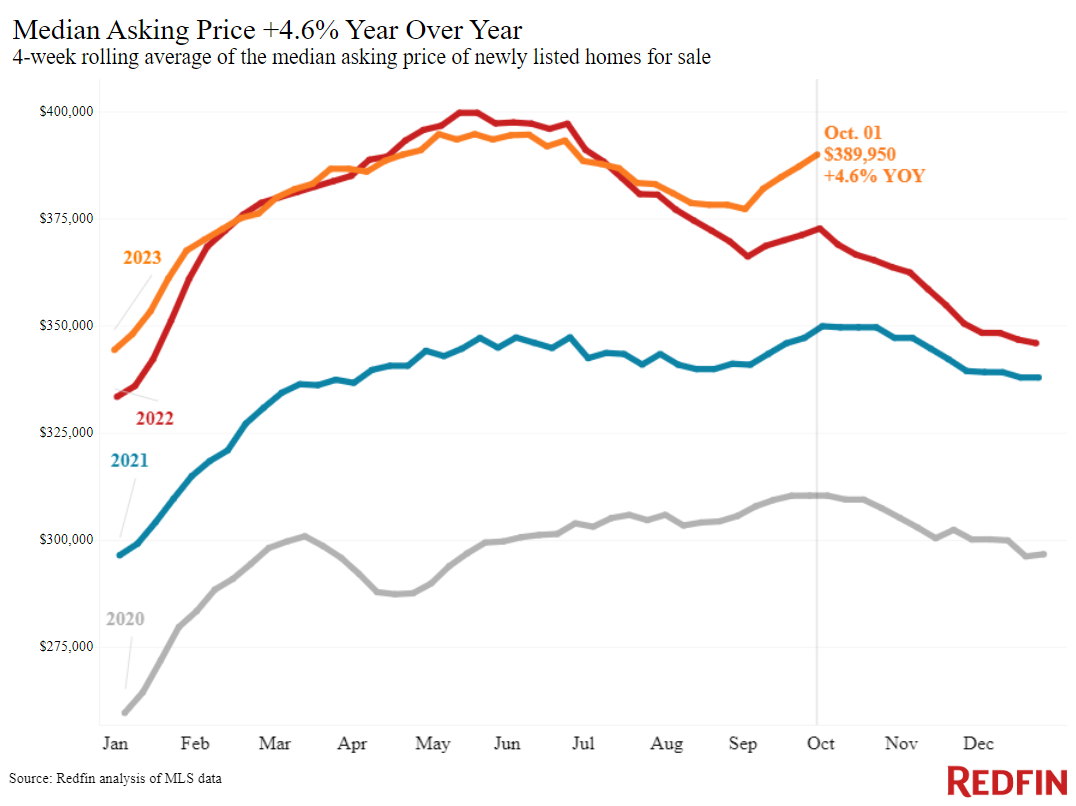
| Median asking price | $389,950 | 4.6% | Biggest increase since Oct. 2022 |
| Median monthly mortgage payment | $2,710 at a 7.31% mortgage rate | 10% | All-time high |
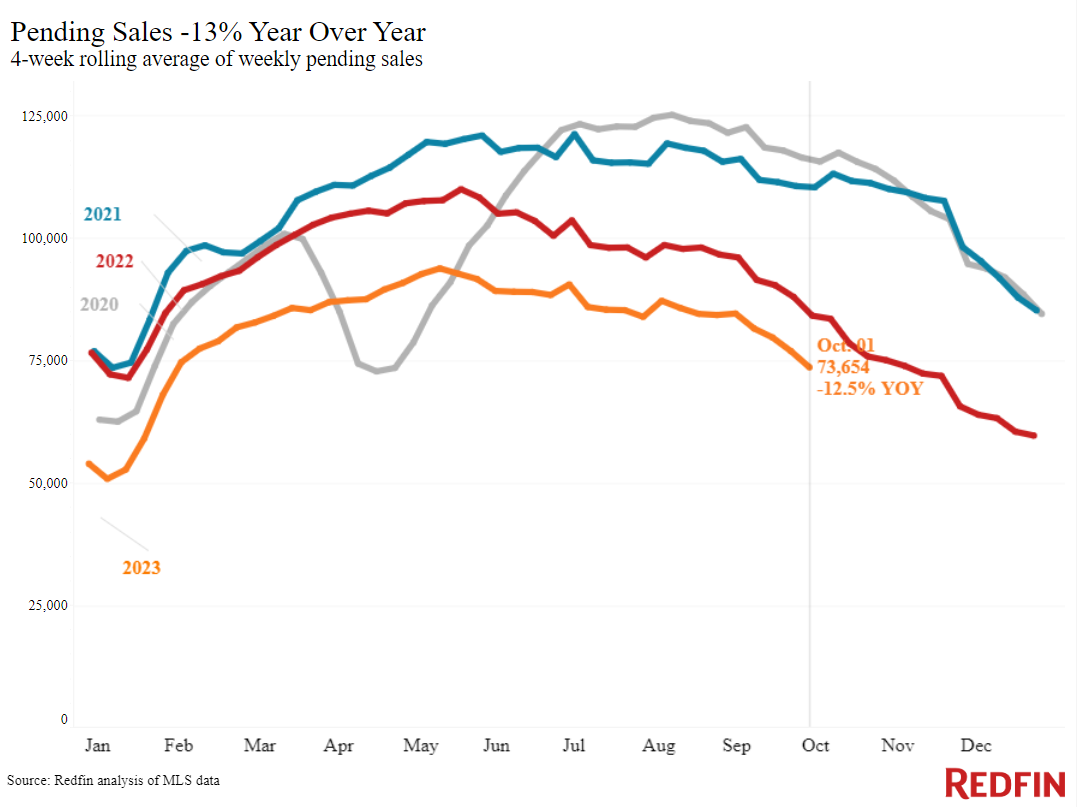
| Pending sales | 73,654 | -12.5% | |
| New listings | 83,216 | -3.4% | Smallest decline since July 2022, in part because new listings fell rapidly at this time in 2022 |
| Active listings | 826,882 | -14% | |
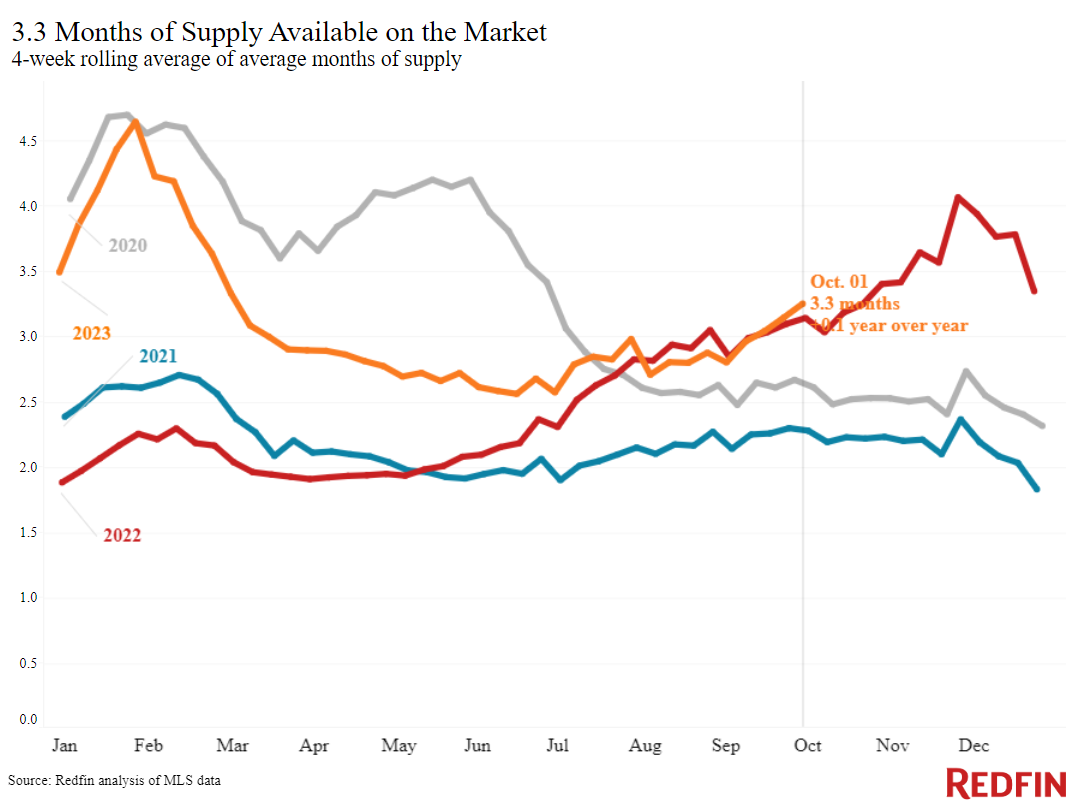
| Months of supply | 3.3 months | +0.2 pts. | Highest level since March.
4 to 5 months of supply is considered balanced, with a lower number indicating seller’s market conditions. |
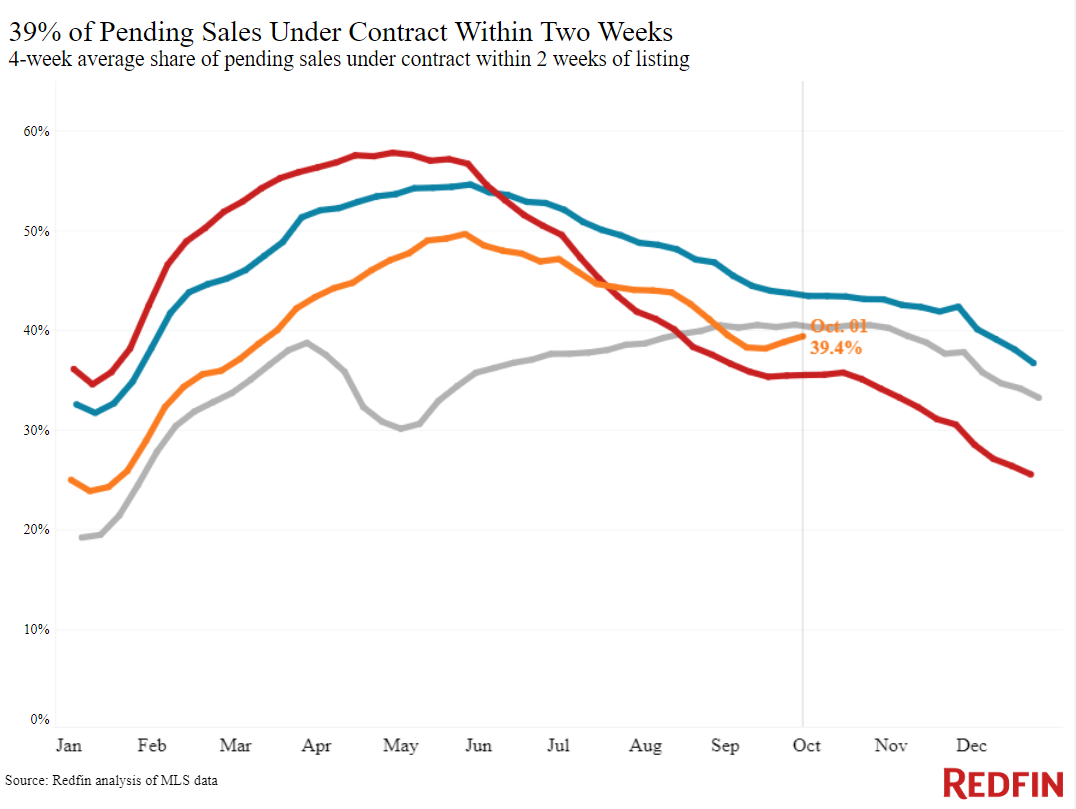
| Share of homes off market in two weeks | 39.4% | Up from 35% | |
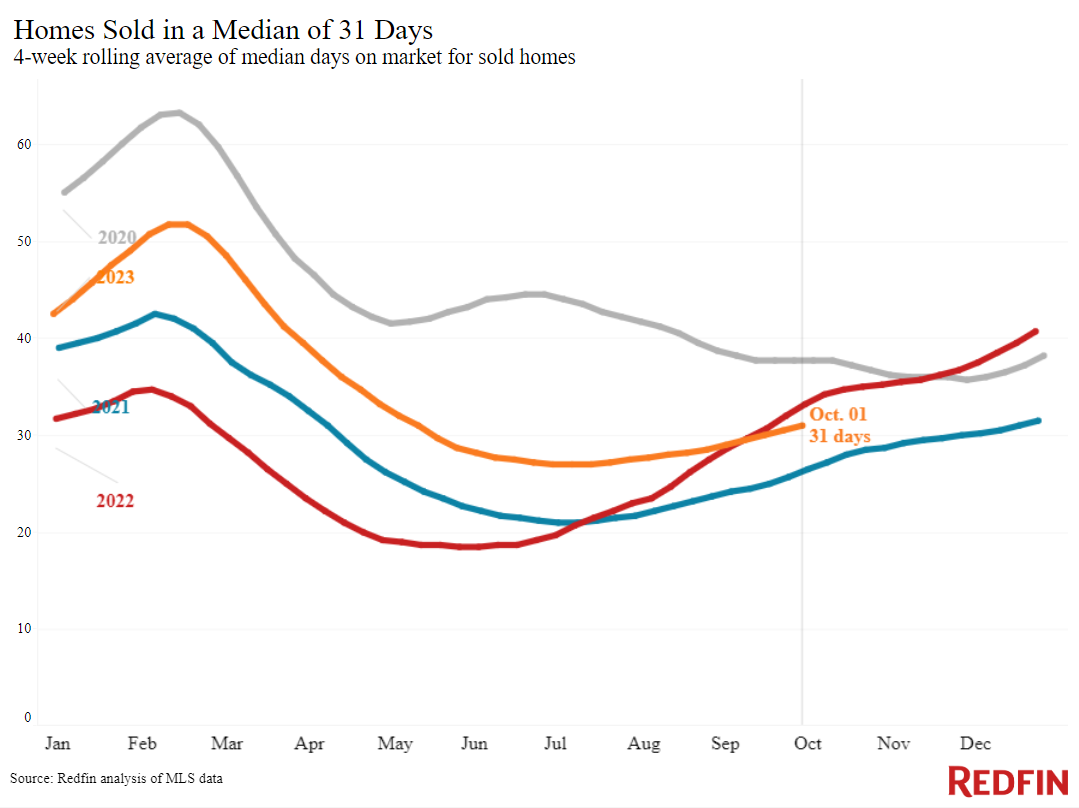
| Median days on market | 31 | -2 days | |
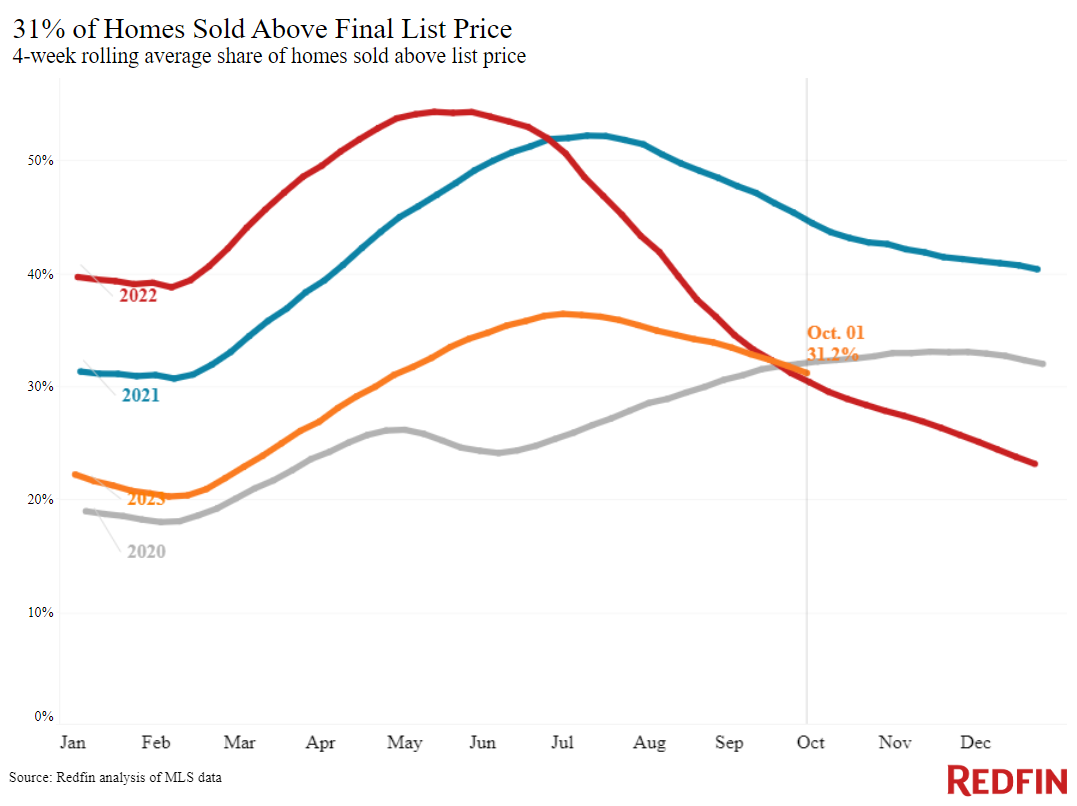
| Share of homes sold above list price | 31.2% | Up from 30% | |
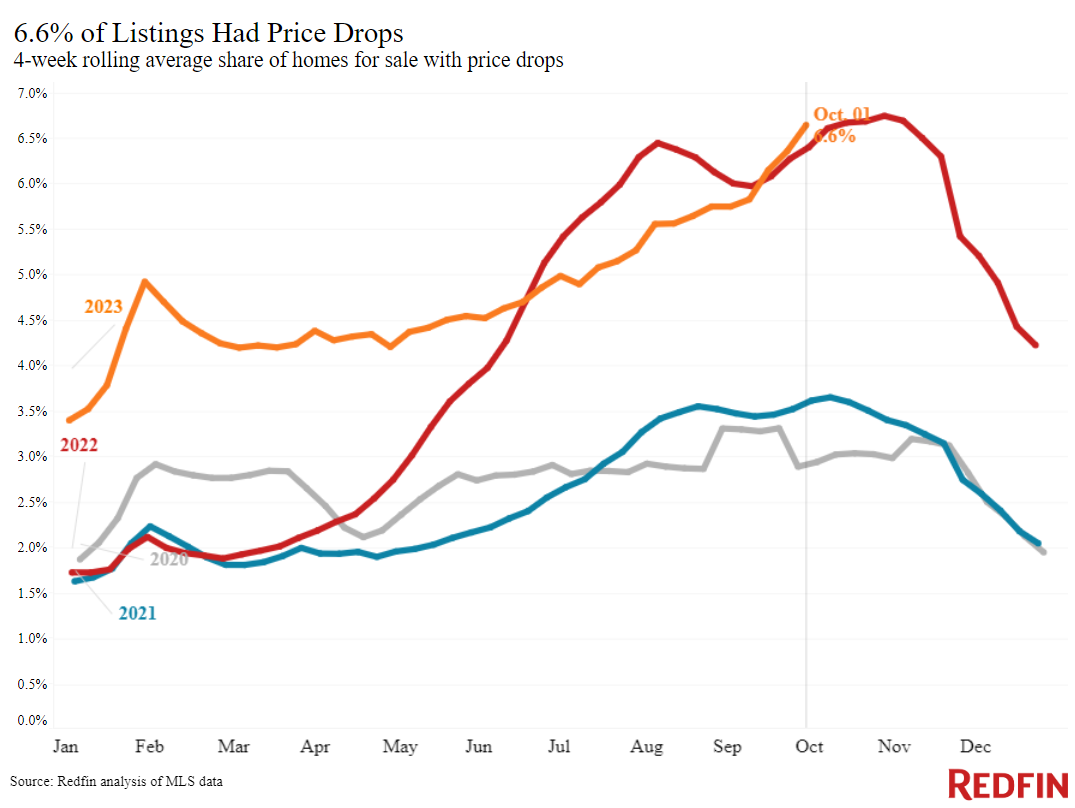
| Share of homes with a price drop | 6.6% | +0.2 pts. | Highest share since November 2022 |
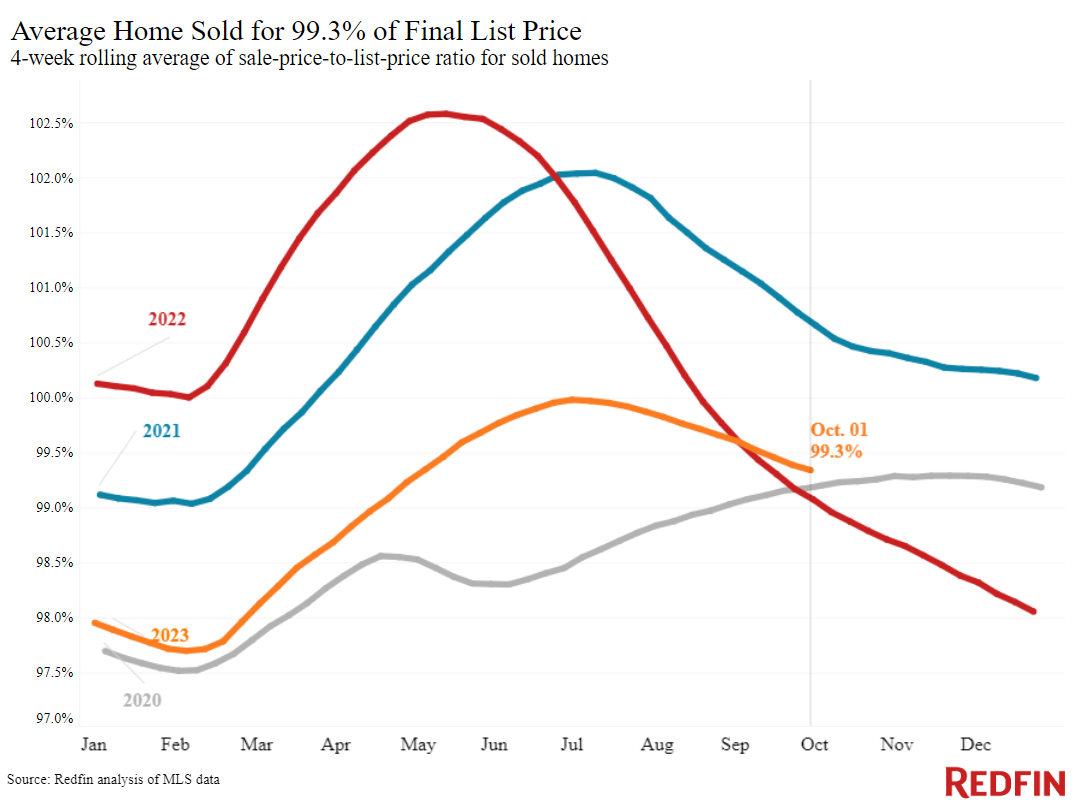
| Average sale-to-list price ratio | 99.3% | +0.2 pts. | |
| Metro-level highlights: Four weeks ending October 1, 2023
Redfin’s metro-level data includes the 50 most populous U.S. metros. Select metros may be excluded from time to time to ensure data accuracy. |
|||
| Metros with biggest year-over-year increases | Metros with biggest year-over-year declines | Notes | |
| Median sale price | Anaheim, CA (13%)
New Brunswick, NJ (10.6%) Providence, RI (10.5%) Newark, NJ (9.1%) San Jose, CA (9.1%) |
Austin, TX (-4.1%)
Houston, TX (-2.8%) San Francisco (-2.1%) San Antonio, TX (-1.5%) Phoenix (-1.3%) Nashville, TN (-1.1%) Las Vegas (-0.8%) Portland, OR (-0.1%) |
Declined in 8 metros |
| Pending sales | West Palm Beach, FL (1.8%) | New York (-31.2%)
New Brunswick, NY (-24.1%) Portland, OR (-22.2%) Atlanta (-22.2%) Virginia Beach, VA (-20.3%) |
Declined in all but 1 metro |
| New listings | Orlando, FL (14.2%)
Jacksonville, FL (10.6%) West Palm Beach, FL (9.4%) Miami (8.1%) San Jose, CA (6.9%) |
Atlanta (-28.3%)
Newark, NJ (-17%) Portland, OR (-15.2%) Providence, RI (-14.2%) Chicago (-14%) |
Declined in all but 12 metros |
Refer to our metrics definition page for explanations of all the metrics used in this report.
 United States
 Canada