As mortgage rates hold steady in the 6% range and new listings tick up, mortgage-purchase applications and Redfin home tours are rising.
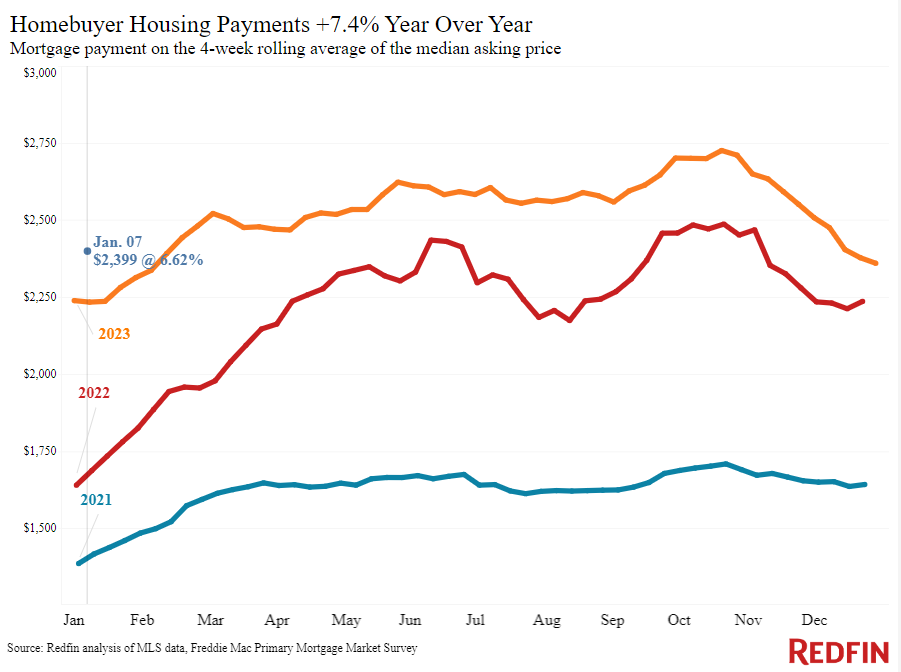
Redfin agents report that as the new year kicks off, more sellers are listing and more buyers are going on tours and applying for mortgages as rates remain in the mid-6% range, down from 8% in October. Buyers are motivated by lower mortgage payments–the median U.S. housing payment is down $325 (-12%) from October’s all-time high–and sellers are motivated by increased demand and the lock-in effect easing.
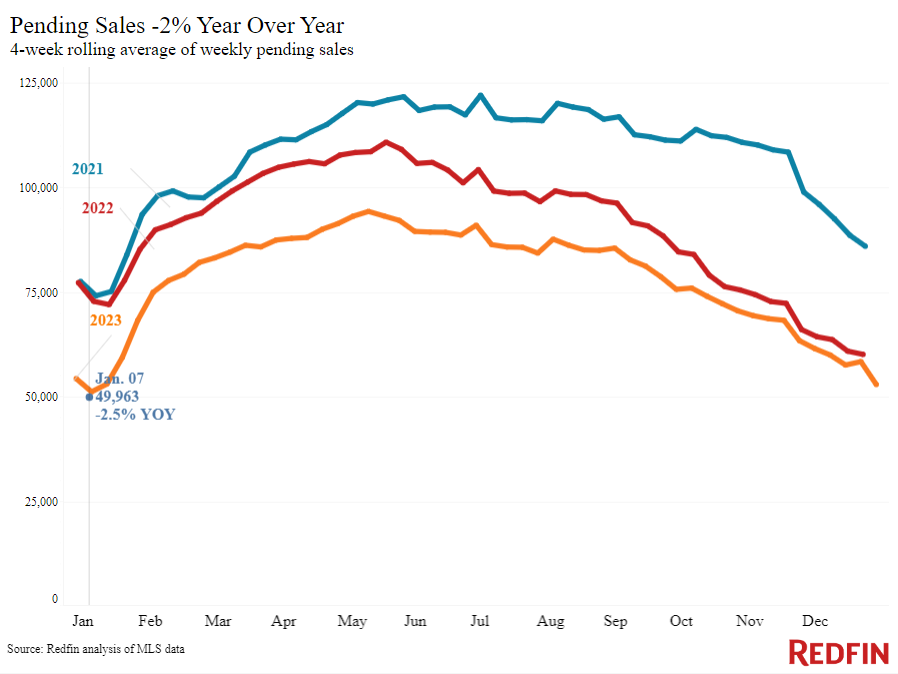
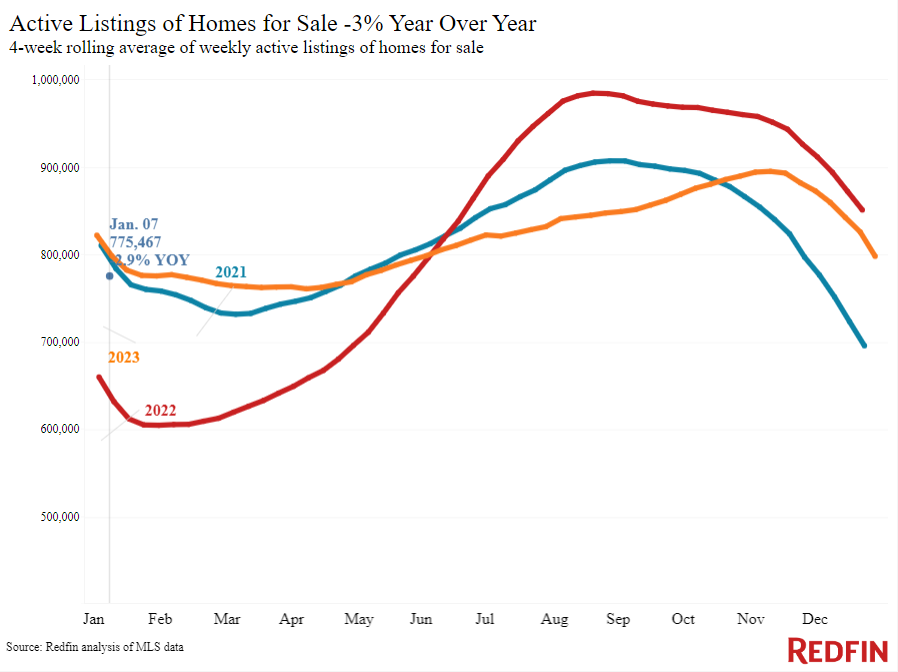
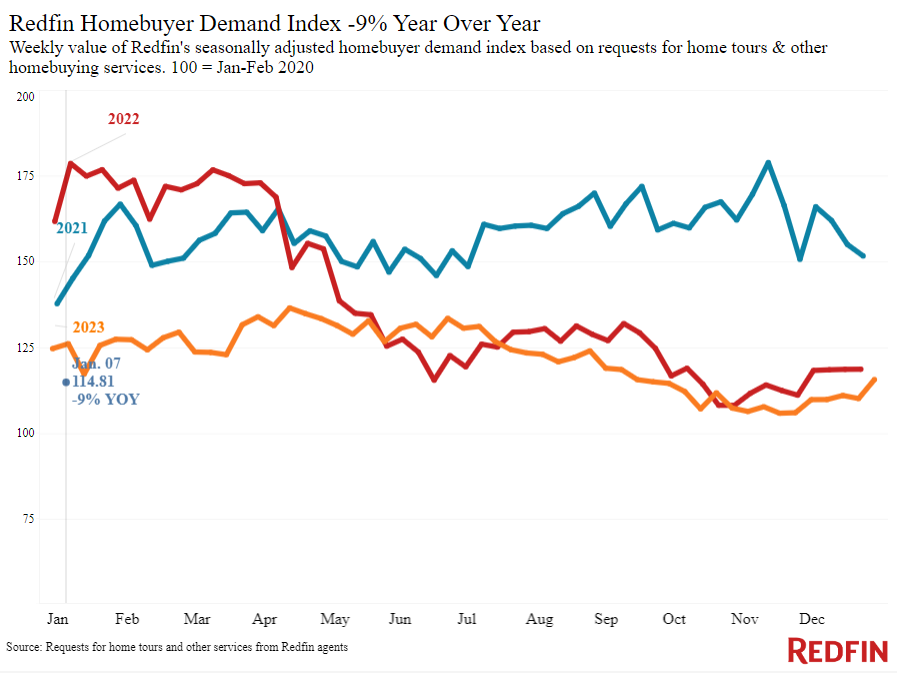
Mortgage-purchase applications are up 3% from a month ago, and Redfin’s Homebuyer Demand Index–a seasonally adjusted measure of requests for tours and other buying services from Redfin’s agents–is up 5% from a month ago. Pending U.S. home sales posted their smallest year-over-year decline in two years (-3%) during the four weeks ending January 7. There are 9% more new listings than there were a year ago, and while the total number of listings is down 3% annually, that’s the smallest decline since June.
“More buyers are out there touring this week; they feel optimistic now that rates have come down a bit,” said Phoenix Redfin Premier agent Heather Mahmood-Corley. “I’m advising house hunters to start making offers now because the market feels pretty balanced. Interest rates are lower and there are more listings, but there’s not much competition yet. With activity picking up, I think prices will rise and bidding wars will become more common.”
Leading indicators
| Indicators of homebuying demand and activity | ||||
| Value (if applicable) | Recent change | Year-over-year change | Source | |
| Daily average 30-year fixed mortgage rate | 6.78% (Jan. 10) | Up just slightly from 6.72% a week earlier | Up from 6.14% | Mortgage News Daily |
| Weekly average 30-year fixed mortgage rate | 6.62% (week ending Jan. 4) | Near lowest level since May | Up from 6.48% | Freddie Mac |
| Mortgage-purchase applications (seasonally adjusted) | Up 6% from a week earlier; up 3% from a month earlier (as of week ending Jan. 5) | Down 16% | Mortgage Bankers Association | |
| Redfin Homebuyer Demand Index (seasonally adjusted) | Up 5% from a month earlier (as of the week ending Jan. 7) | Down 9% | Redfin Homebuyer Demand Index, a measure of requests for tours and other homebuying services from Redfin agents | |
| Google searches for “home for sale” | Up 10% from a month earlier (as of Jan. 8) | Down 20% | Google Trends | |
Key housing-market data
| U.S. highlights: Four weeks ending January 7, 2024
Redfin’s national metrics include data from 400+ U.S. metro areas, and is based on homes listed and/or sold during the period. Weekly housing-market data goes back through 2015. Subject to revision. |
|||
| Four weeks ending January 7, 2024 | Year-over-year change | Notes | |
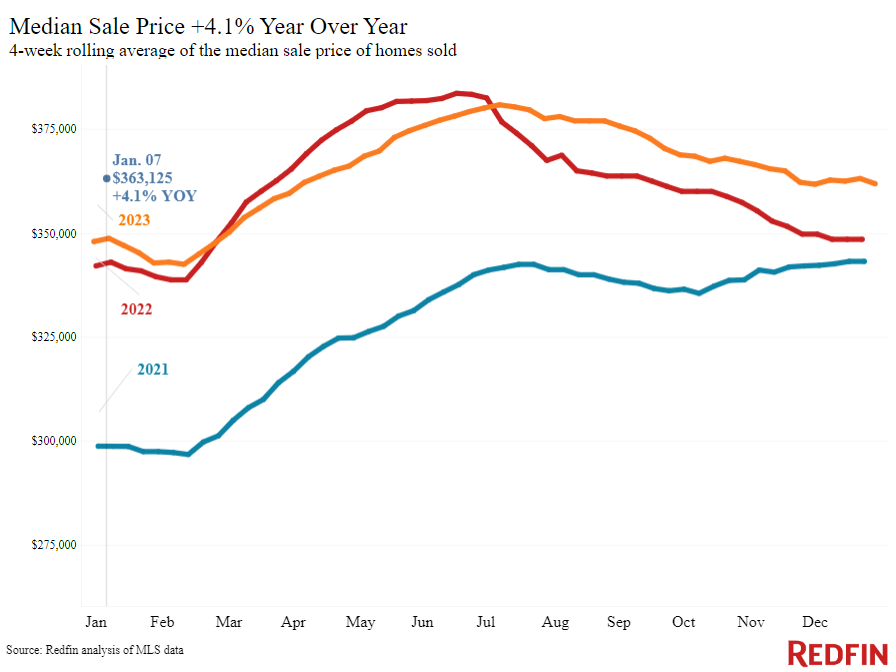
| Median sale price | $363,125 | 4.1% | Close to the biggest increase since Oct. 2022. |
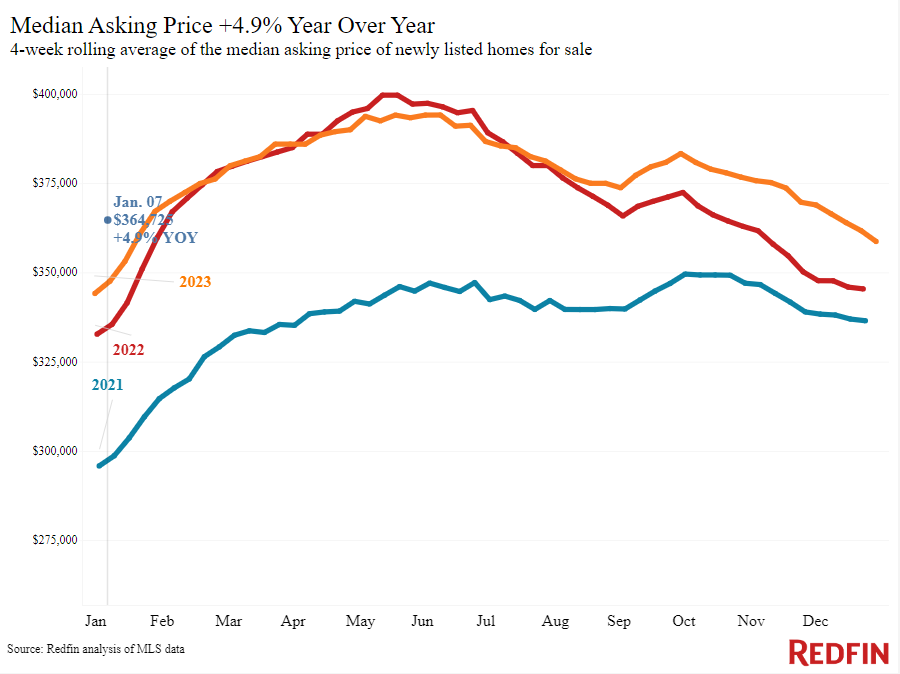
| Median asking price | $364,725 | 4.9% | |
| Median monthly mortgage payment | $2,399 at a 6.62% mortgage rate | 7.4% | Down $325 from all-time high set during the four weeks ending Oct. 22. Near lowest level in about a year. |
| Pending sales | 49,963 | -2.5% | Smallest decline since Jan. 2022 |
| New listings | 44,682 | 9% | |
| Active listings | 775,467 | -2.9% | Smallest decline since June |
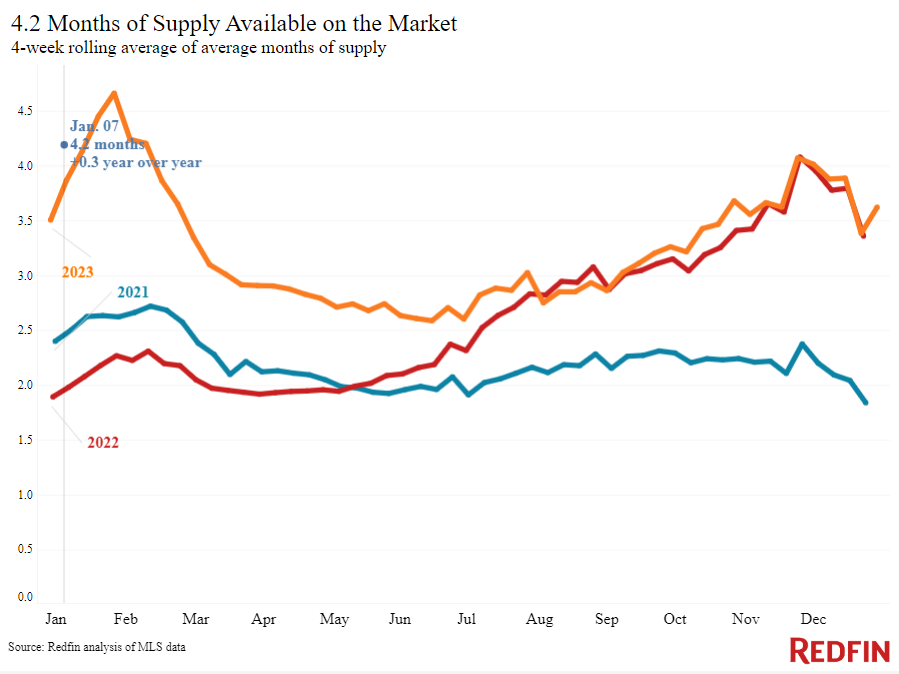
| Months of supply | 4.2 months | +0.3 pts. | 4 to 5 months of supply is considered balanced, with a lower number indicating seller’s market conditions. |
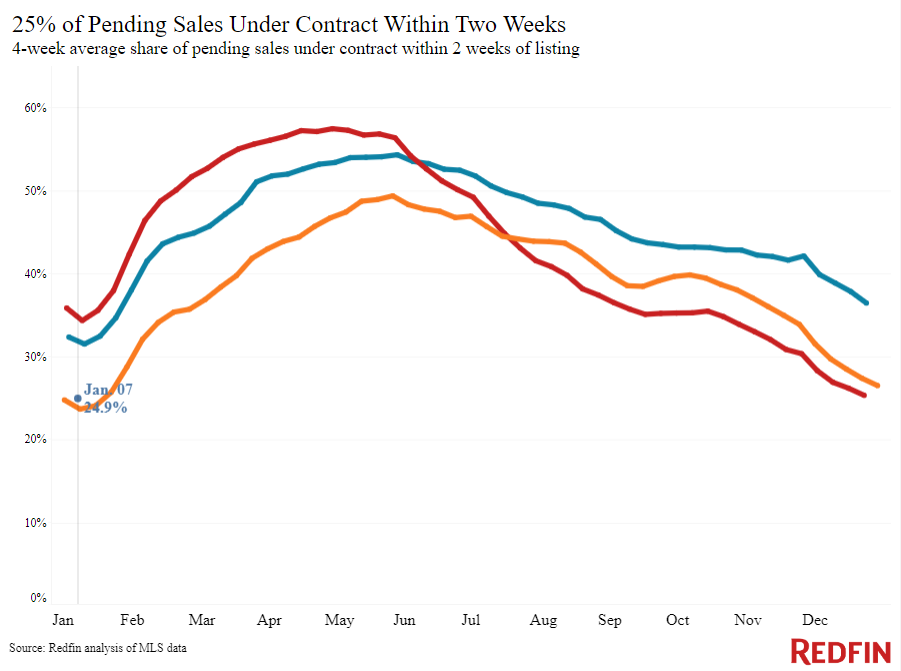
| Share of homes off market in two weeks | 24.9% | Up from 24% | |
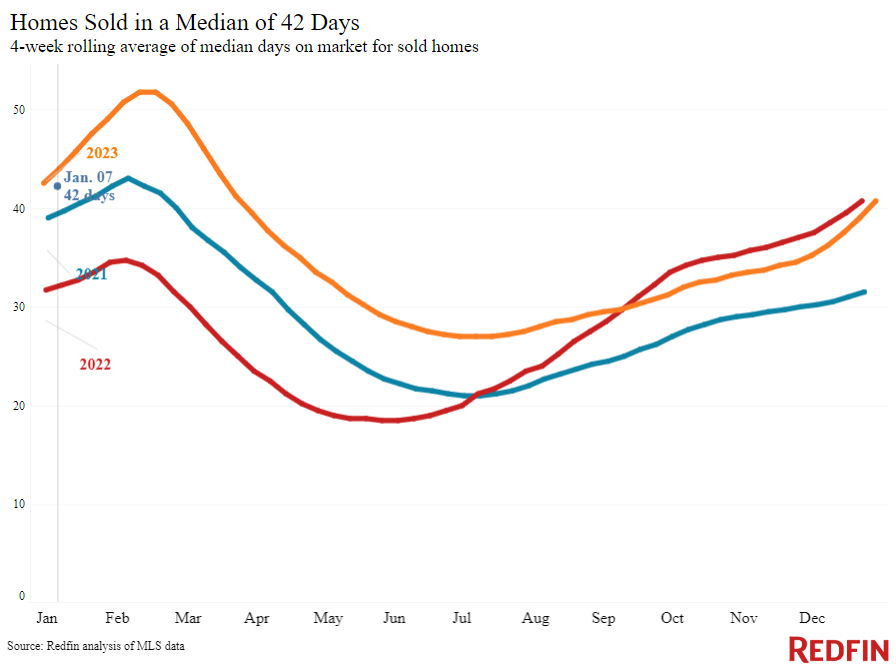
| Median days on market | 42 | -2 days | |
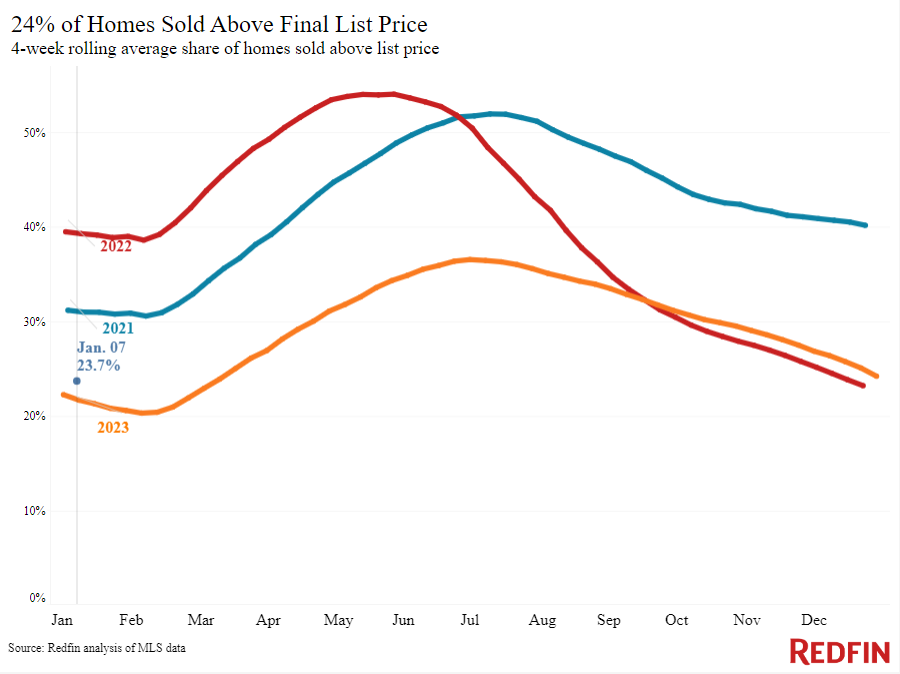
| Share of homes sold above list price | 23.7% | Up from 22% | |
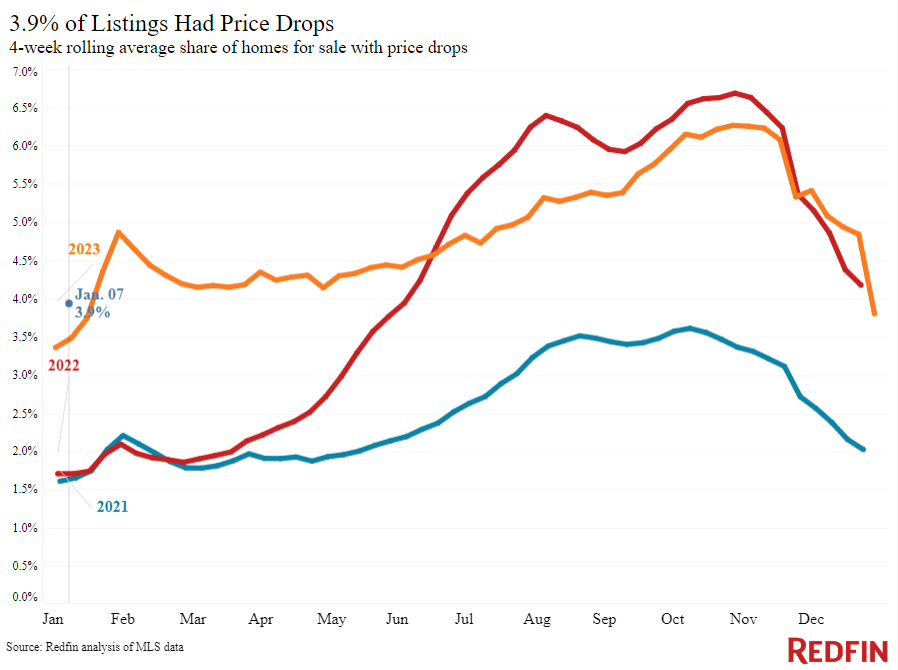
| Share of homes with a price drop | 3.9% | +0.4 pts. | |
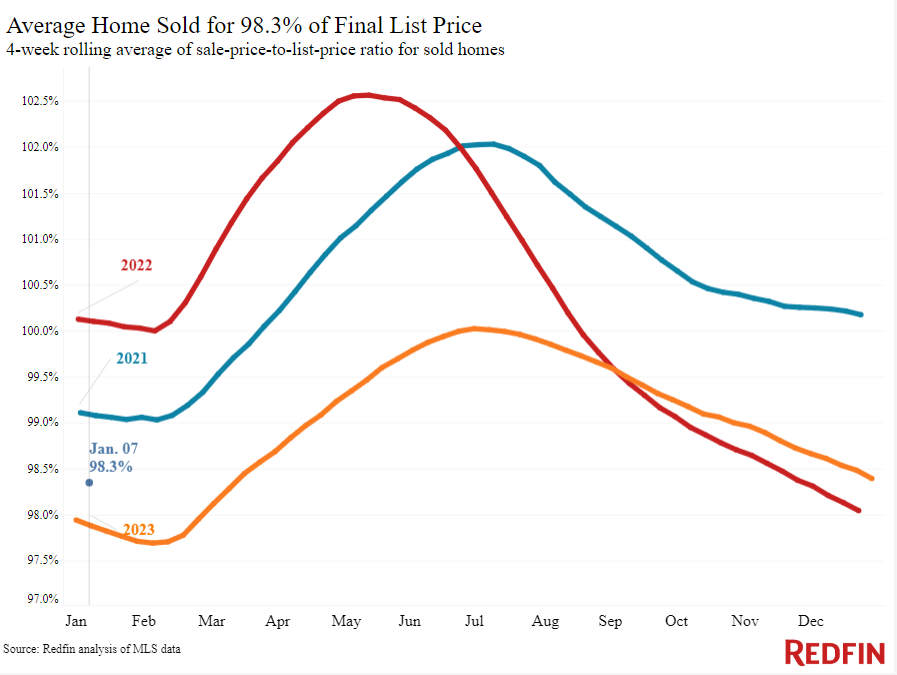
| Average sale-to-list price ratio | 98.3% | +0.4 pts. | |
| Metro-level highlights: Four weeks ending January 7, 2024
Redfin’s metro-level data includes the 50 most populous U.S. metros. Select metros may be excluded from time to time to ensure data accuracy. |
|||
| Metros with biggest year-over-year increases | Metros with biggest year-over-year decreases | Notes | |
| Median sale price | West Palm Beach, FL (19.1%)
Newark, NJ (17.6%) Anaheim, CA (16.4%) Boston (13.1%) Miami (12.2%) |
Austin, TX (-3.3%)
Fort Worth, TX (-3.2%) San Francisco (-2.5%) San Antonio, TX (-0.9%) Philadelphia (-0.1%) |
Declined in 5 metros |
| Pending sales | Milwaukee, WI (12.3%)
Austin, TX (10.6%) Dallas (10.2%) San Jose, CA (10%) Cleveland, OH (7.5%) |
New York (-16.1%)
Newark, NJ (-13.4%) San Diego (-12.2%) New Brunswick, NJ (-11.9%) Providence, RI (-10.9%) |
Increased in 14 metros |
| New listings | Phoenix (21.6%)
Austin, TX (20.3%) Nassau County, NY (19.2%) Minneapolis, MN (17.7%) Milwaukee, WI (17.6%) |
Atlanta (-12.2%)
San Francisco (-11.2%) Indianapolis, IN (-7.7%) Providence, RI (-6.5%) Newark, NJ (-6.5%) |
Declined in 10 metros |
Refer to our metrics definition page for explanations of all the metrics used in this report.