Homebuying demand has softened somewhat and the share of home sellers dropping their price each week rose to 5.1%, but pending sales are still 10% above this time last year.
Although the share of home sellers dropping their asking price each week continues to increase, so does the median home sale price, which was up 16% from a year ago. Pending sales are declining seasonally but are still up 10% from a year ago. Overall homebuying demand is still very strong. The market frenzy of 2021 has cooled somewhat, but home sellers are still very much in the driver’s seat in the housing market today.
“Demand for homes is making a comeback because even though home prices are high and competition is still steep, homebuyers don’t have many alternatives but to keep trying,” said Redfin Chief Economist Daryl Fairweather. “This continued demand for homes is enticing more homeowners to sell in order to avoid the fear of missing out on historically high prices. This enthusiasm from both buyers and sellers is translating into continued growth in pending sales compared to last year.”
Key housing market takeaways for 400+ U.S. metro areas:
Unless otherwise noted, the data in this report covers the four-week period ending August 22. Redfin’s housing market data goes back through 2012.
Data based on homes listed and/or sold during the period:
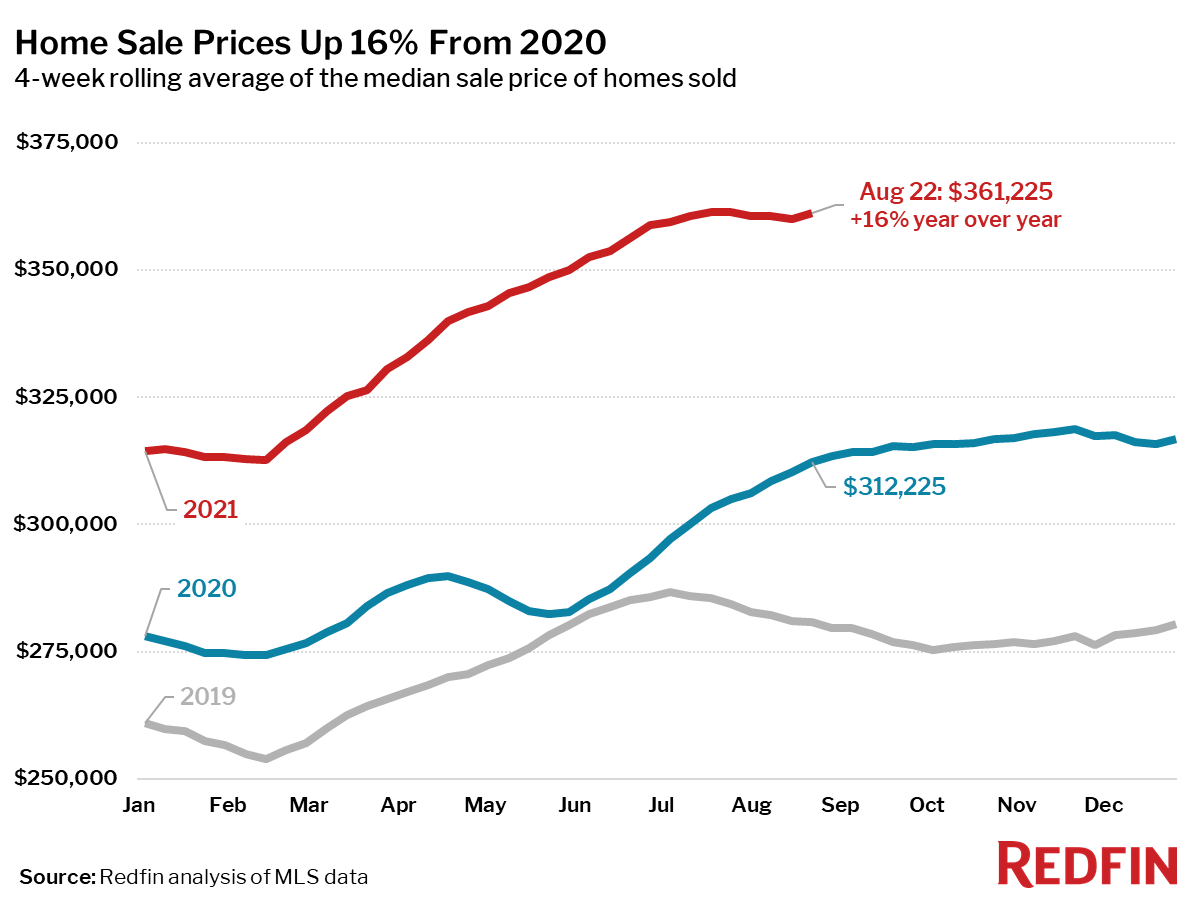
- The median home-sale price increased 16% year over year to $361,225.
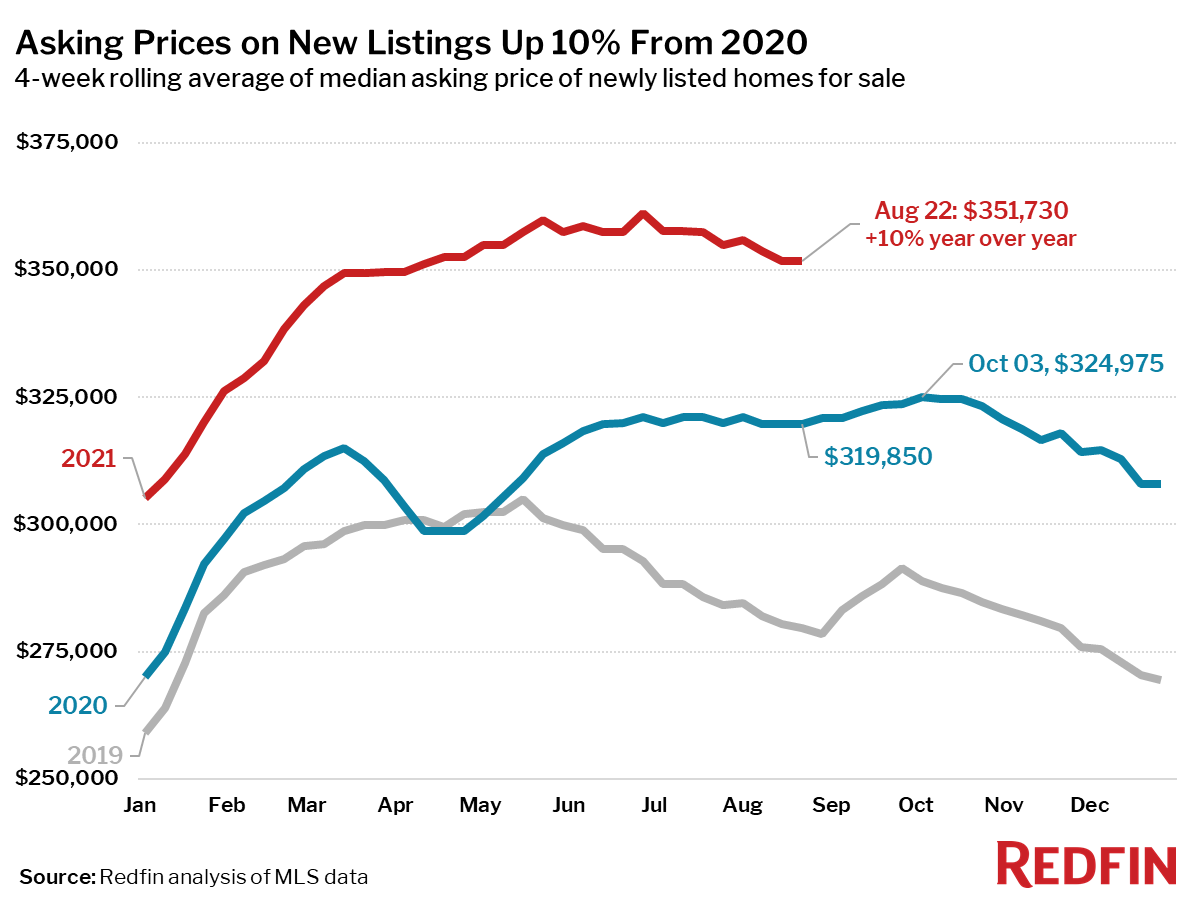
- Asking prices of newly listed homes were up 10% from the same time a year ago to a median of $351,730, the lowest level since mid-April. This is down 2.7% from the all-time high set during the four-week period ending June 27.
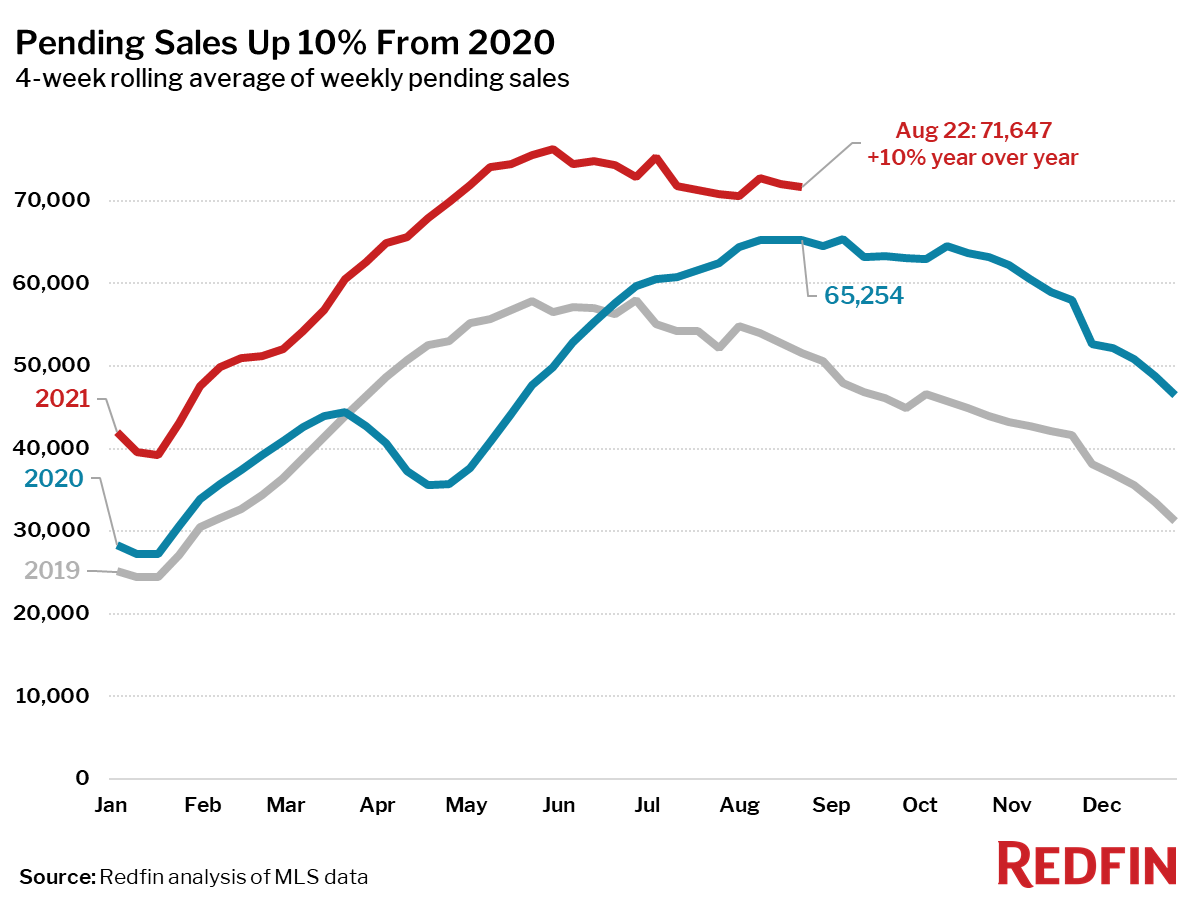
- Pending home sales were up 10% year over year. Pending sales were down 6% from their 2021 peak during the four-week period ending May 30.
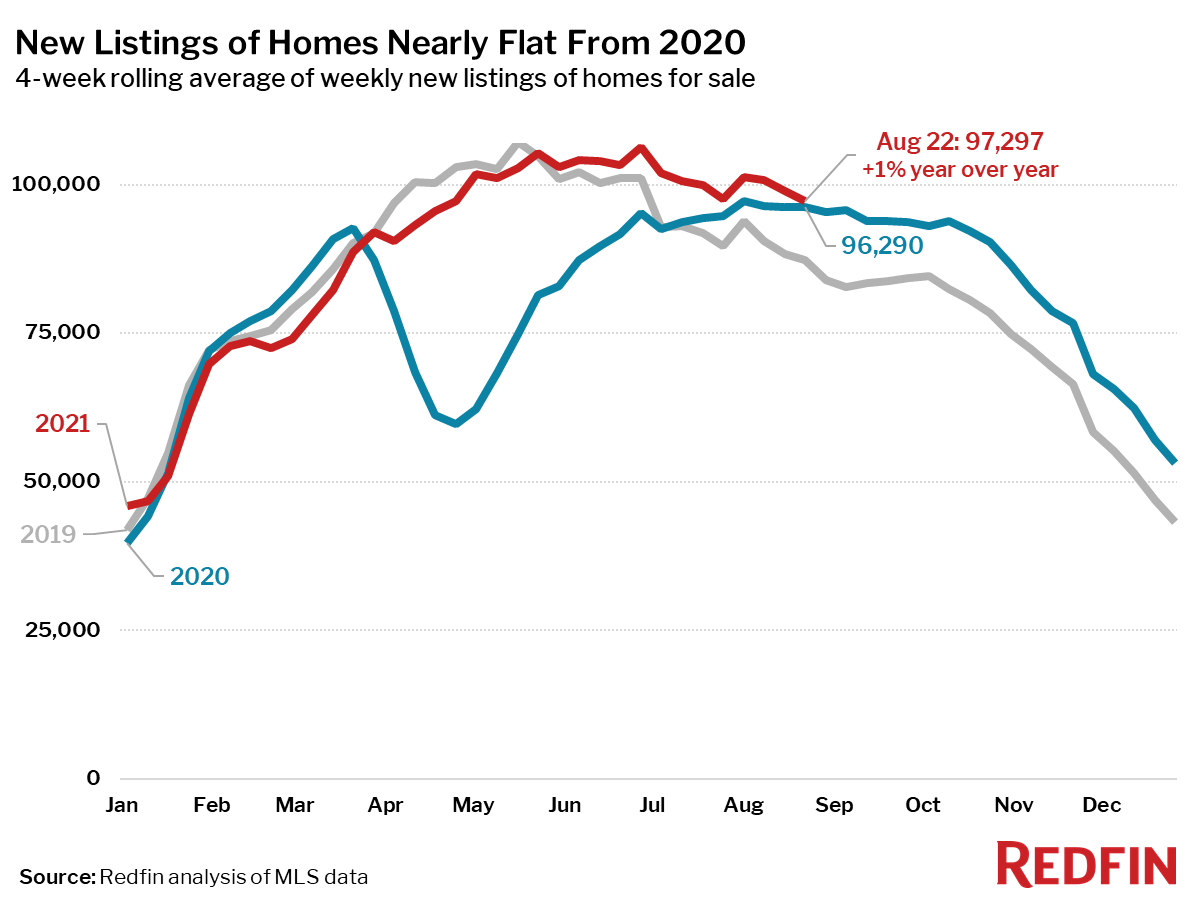
- New listings of homes for sale were nearly flat (+1%) from a year earlier. The number of homes being listed is in a typical seasonal decline, down 9% from the 2021 peak during the four-week period ending June 27.
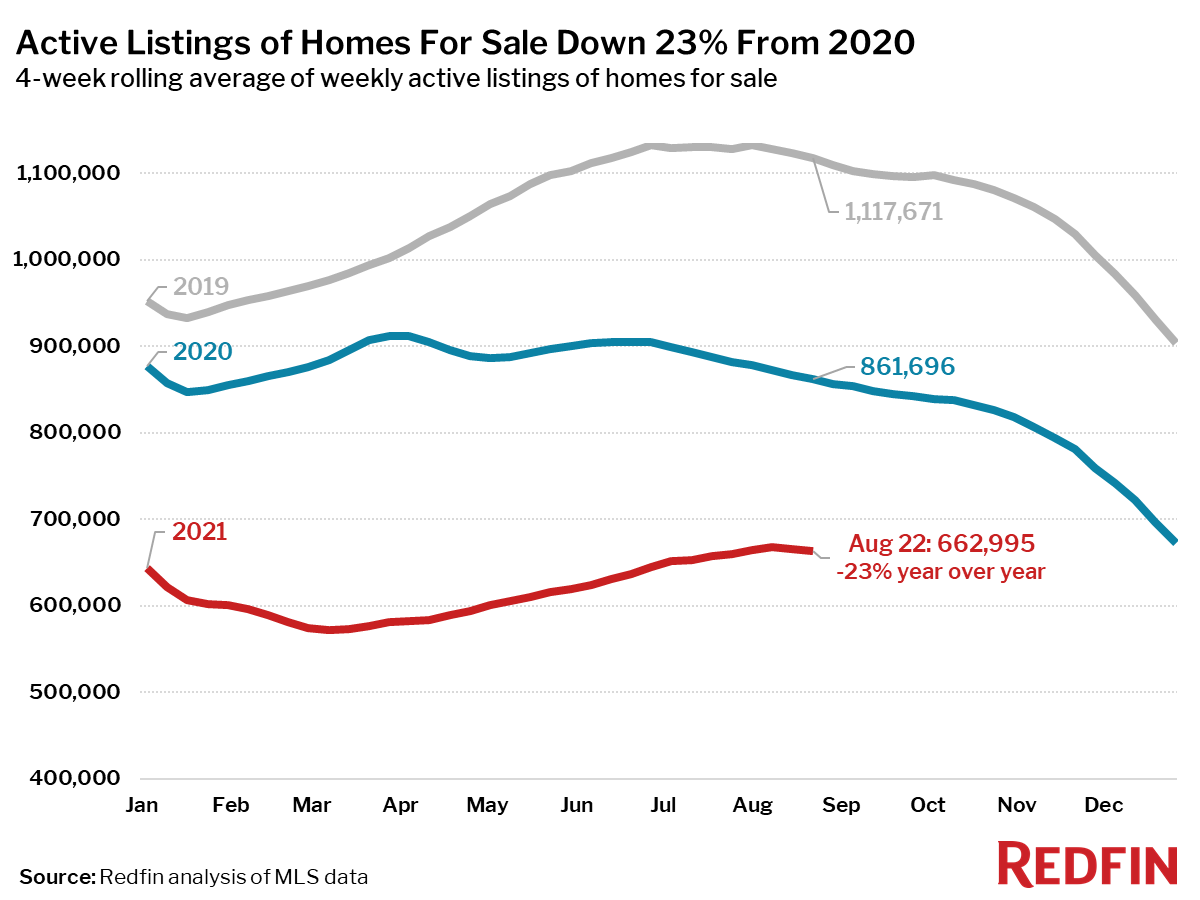
- Active listings (the number of homes listed for sale at any point during the period) fell 23% from 2020—the smallest decline since the four-week period ending September 20, 2020. Active listings are up 16% since their 2021 low during the four-week period ending March 7, but have declined 1% from their 2021 peak during the four-week period ending August 8.
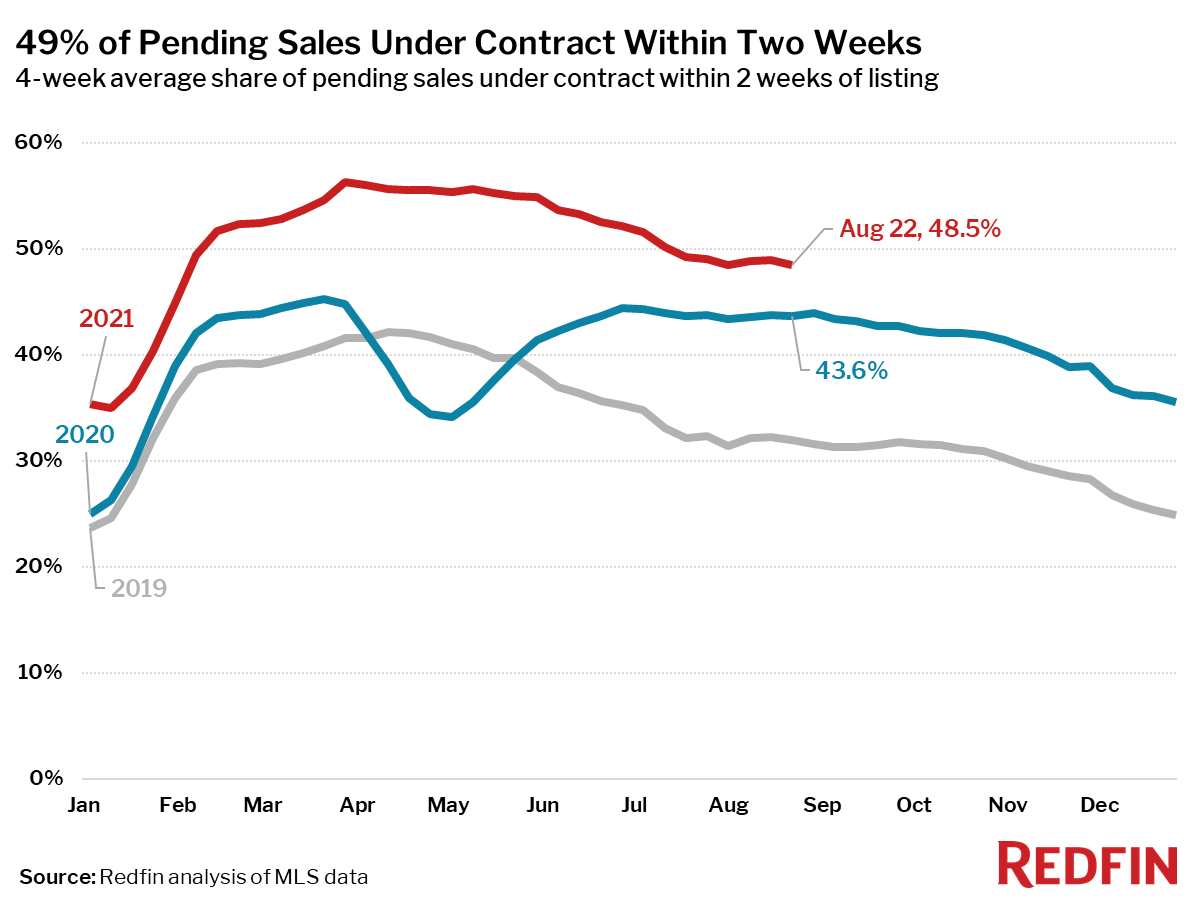
- 49% of homes that went under contract had an accepted offer within the first two weeks on the market, above the 44% rate during the same period a year ago, but down 8 percentage points from the 2021 peak, set during the four-week period ending March 28.
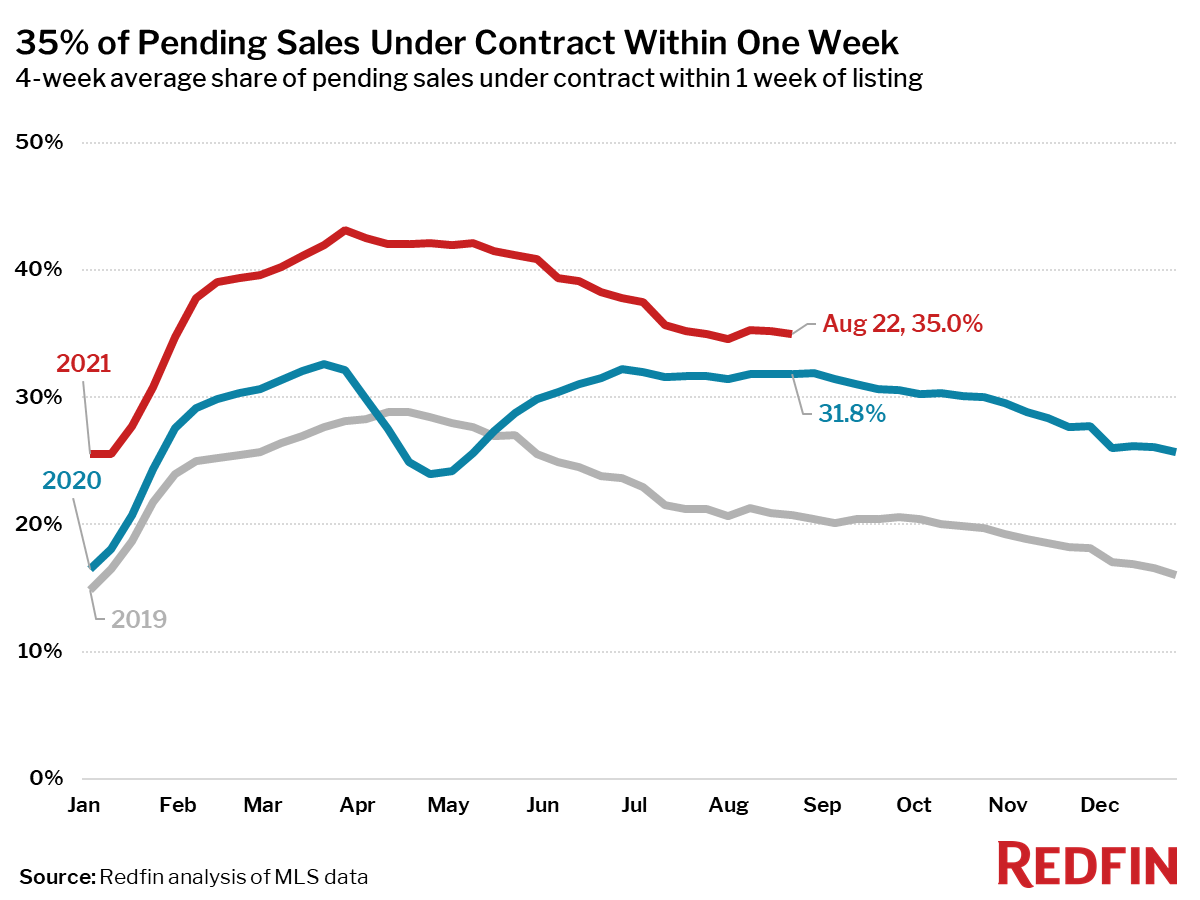
- 35% of homes that went under contract had an accepted offer within one week of hitting the market, up from 32% during the same period a year earlier, but down 8 percentage points from the 2021 peak during the four-week period ending March 28.
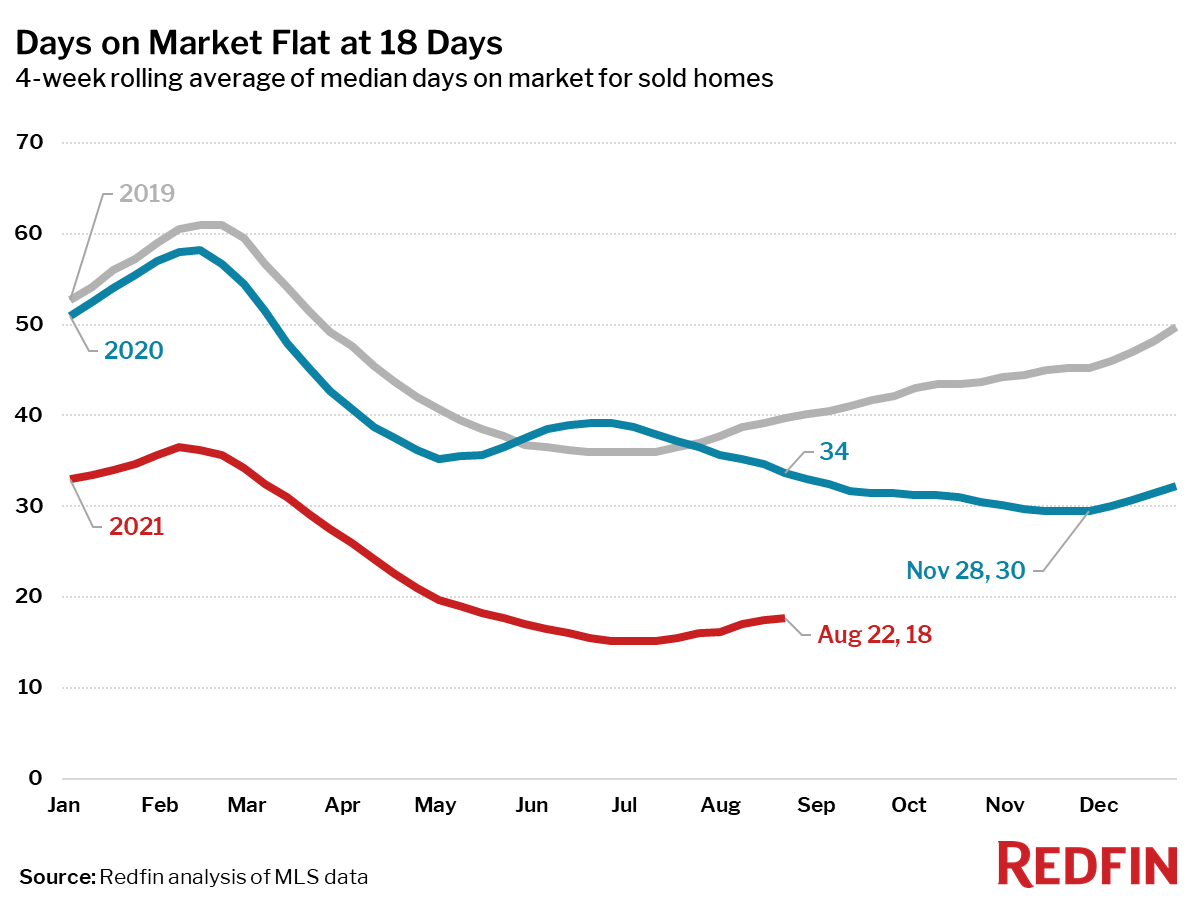
- Homes that sold were on the market for a median of 18 days, up from the all-time low of 15 days seen in late June and July, and down from 34 days a year earlier.
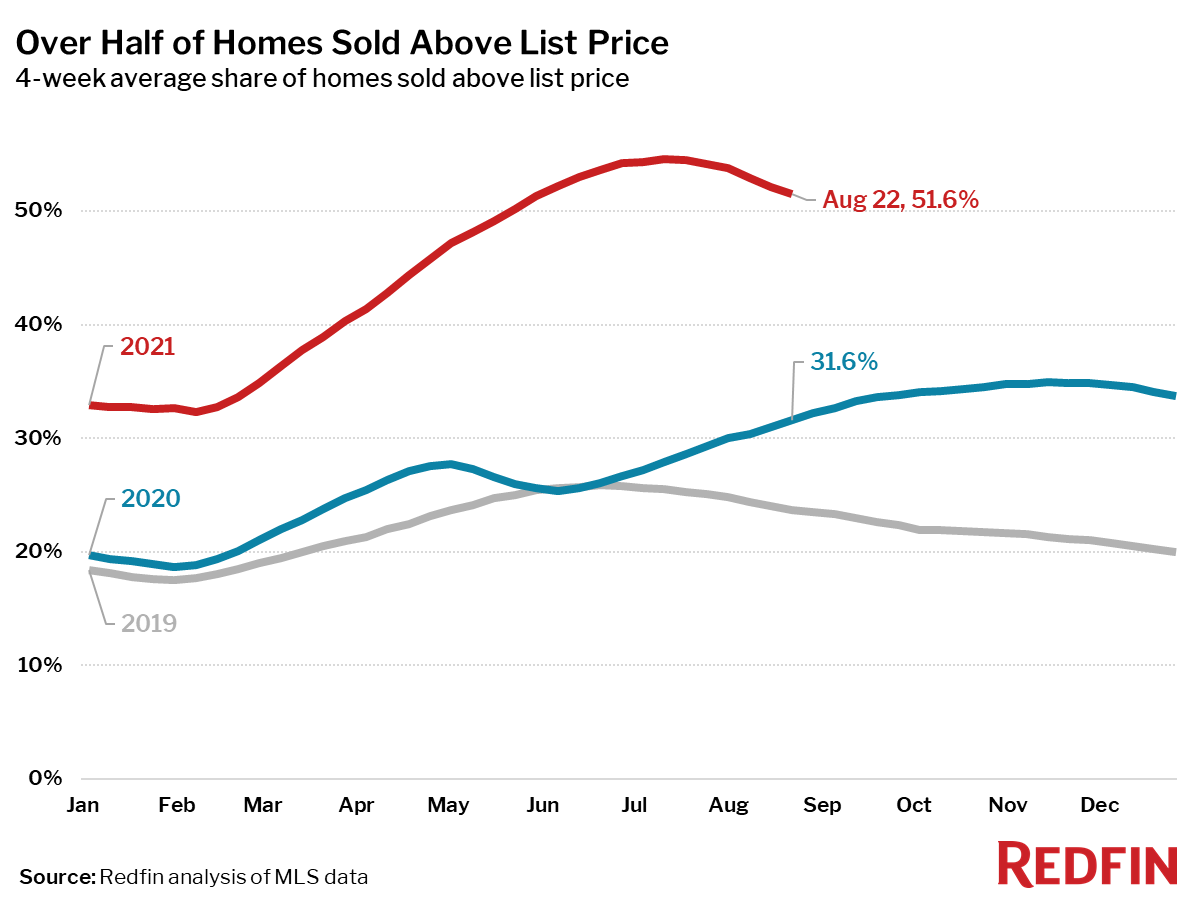
- 52% of homes sold above list price, up from 32% a year earlier. This measure has been falling since the four-week period ending July 11 when it peaked at 55%.
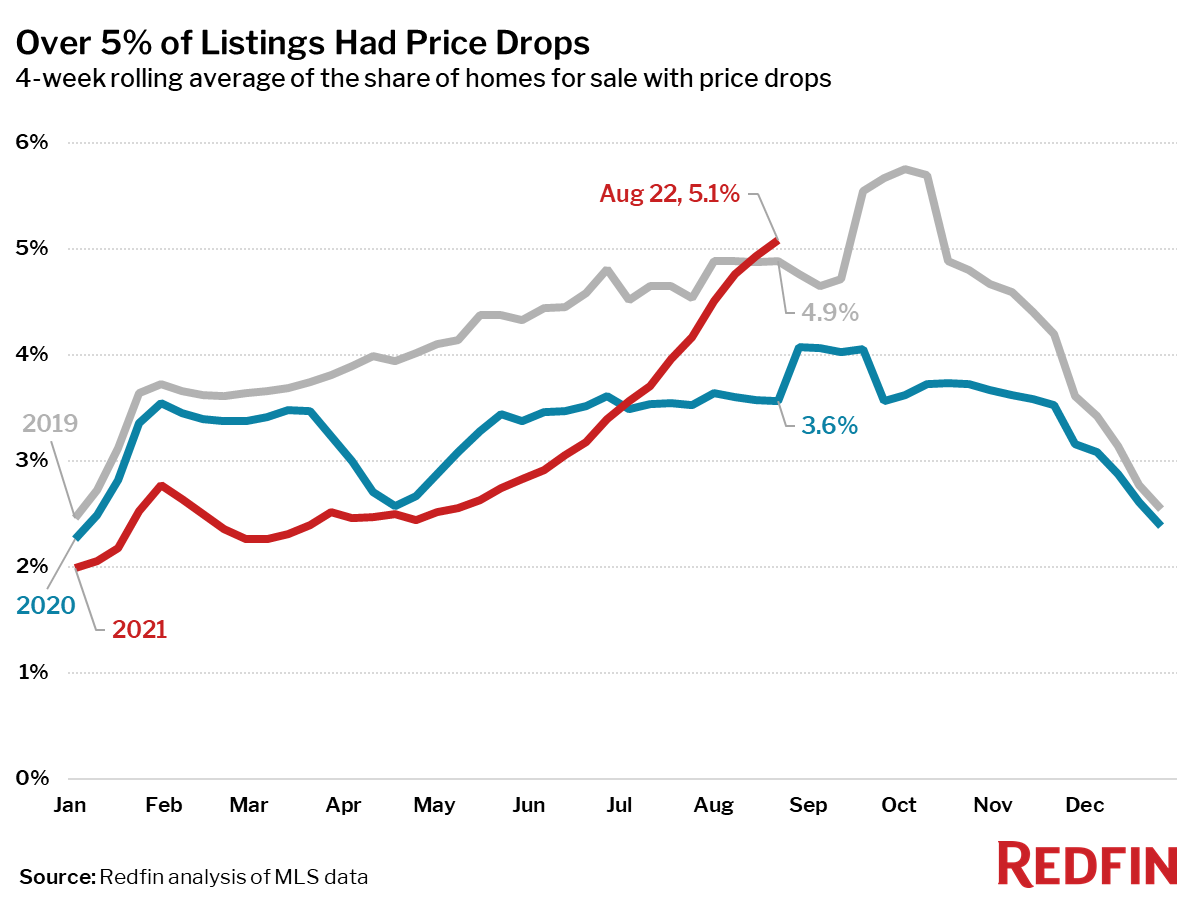
- On average 5.1% of homes for sale each week had a price drop, up 1.5 percentage points from the same time in 2020, and the highest level since the four-week period ending October 13, 2019.
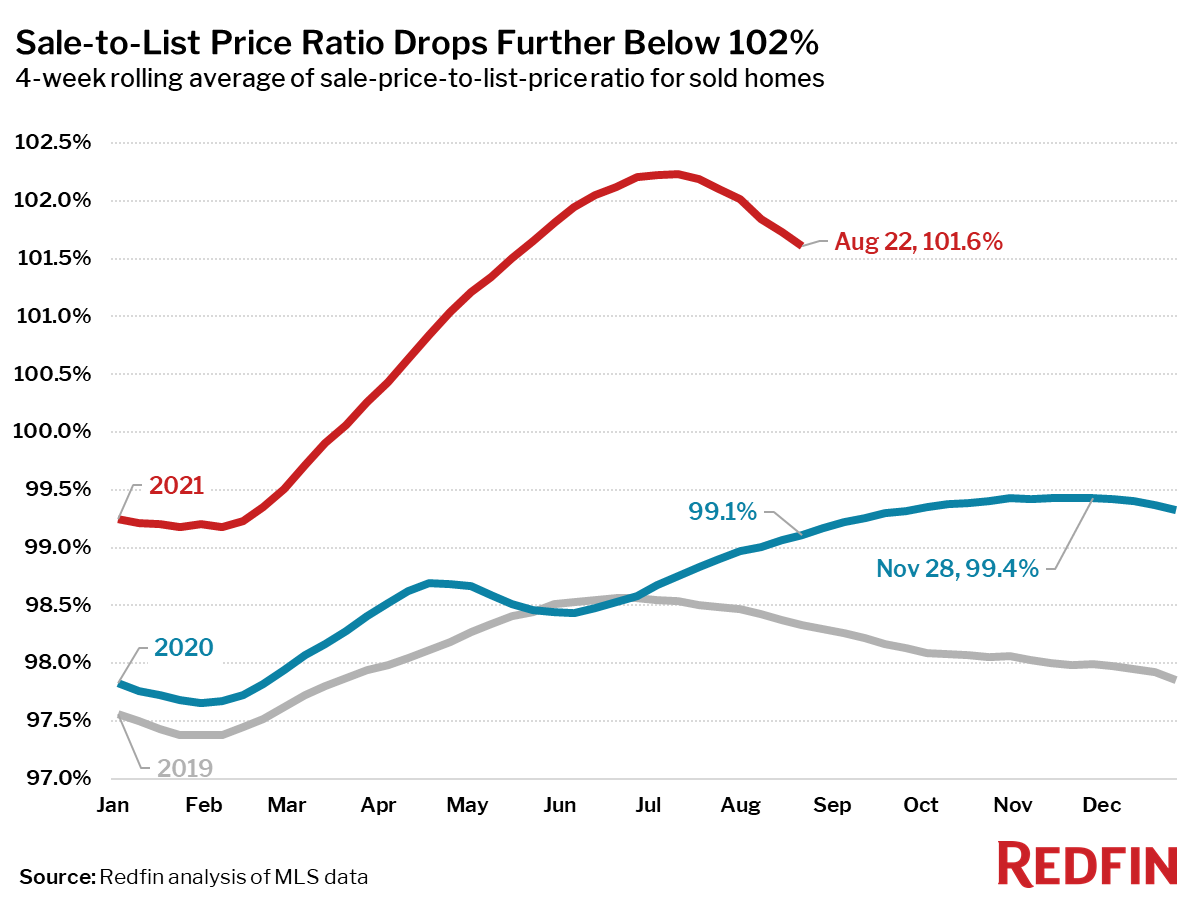
- The average sale-to-list price ratio, which measures how close homes are selling to their asking prices, decreased to 101.6%. In other words, the average home sold for 1.6% above its asking price. This measure is down 0.6 percentage points from its peak during the four-week period ending July 11 and up 2.5 percentage points from a year earlier.
Other leading indicators of homebuying activity:
- Mortgage purchase applications increased 3% week over week (seasonally adjusted) during the week ending August 20. For the week ending August 19, 30-year mortgage rates fell slightly to 2.86%.
- From January 1 to August 22, home tours went up 11%, compared to a 30% increase over the same period last year according to home tour technology company ShowingTime.
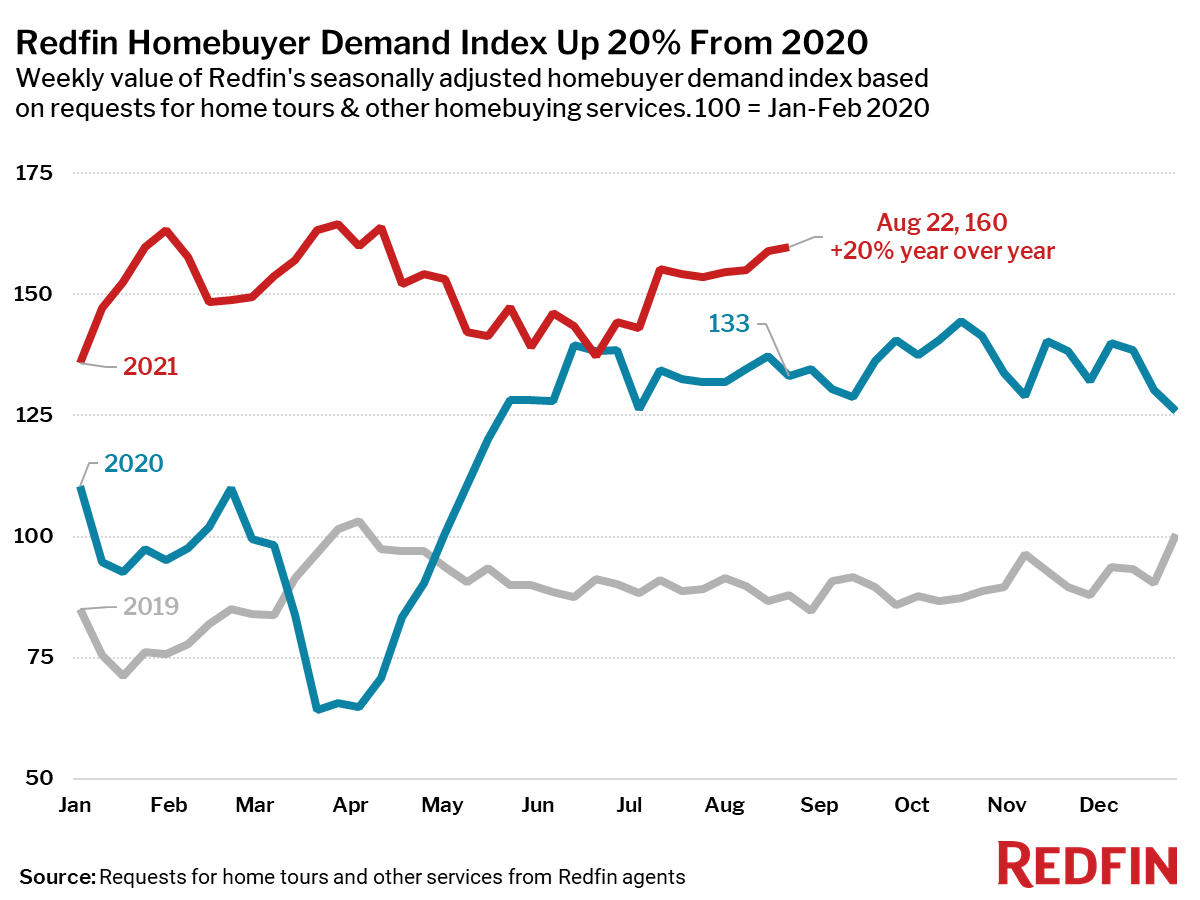
- During the week ending August 22, the seasonally adjusted Redfin Homebuyer Demand Index—a measure of requests for home tours and other services from Redfin agents—edged up slightly from the previous week to its highest point since the week ending April 11, and was up 20% from a year earlier.
Refer to our metrics definition page for explanations of all the metrics used in this report.