More sellers are listing their homes, but 7% mortgage rates and still-high home prices are pushing down sales.
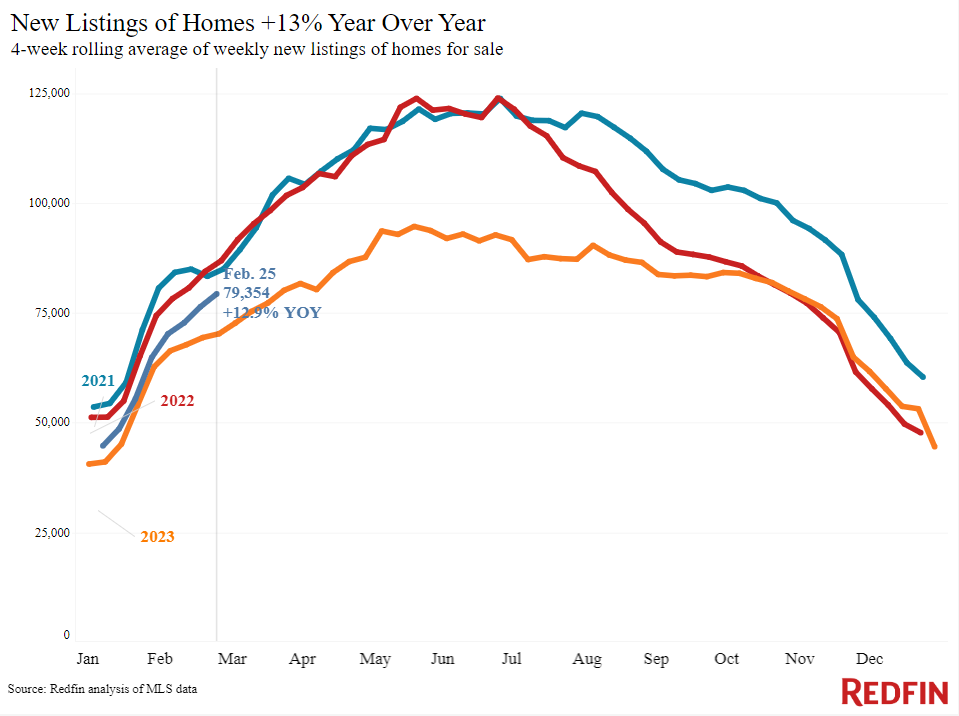
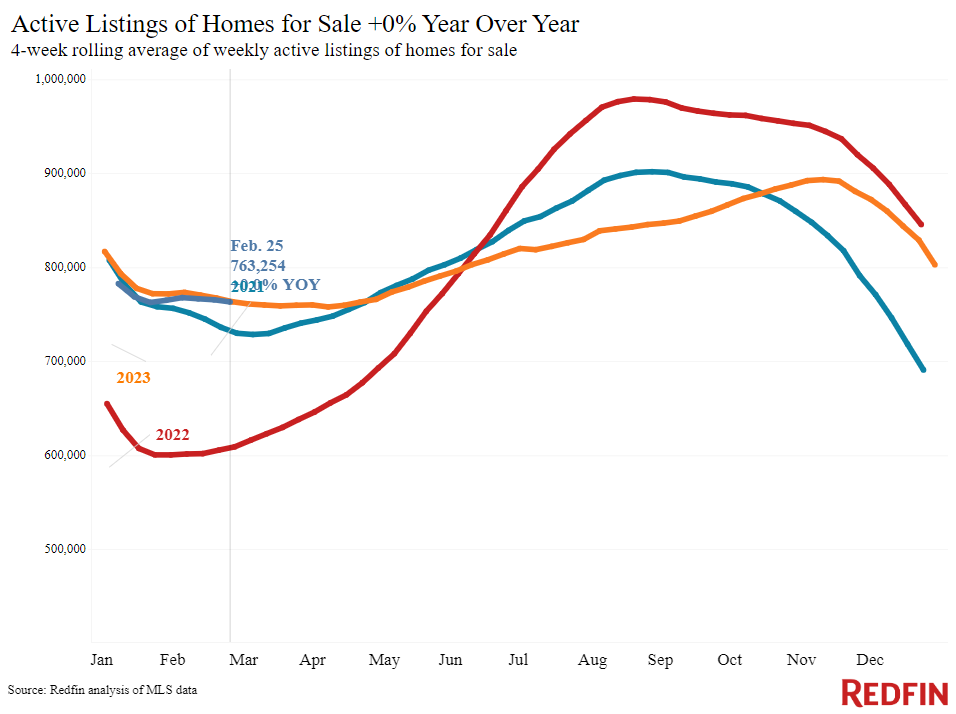
New listings of U.S. homes for sale rose 13% year over year during the four weeks ending February 25, the biggest increase in nearly three years. Total inventory is also improving: Active listings are flat from a year ago, marking the first time in nine months the total number of homes for sale hasn’t declined.
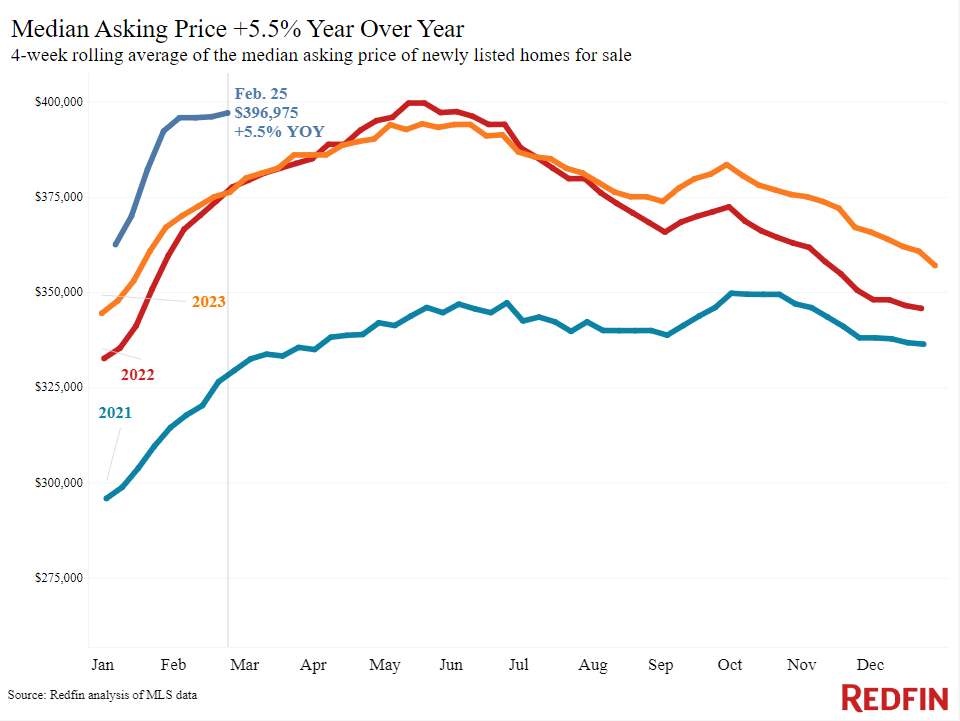
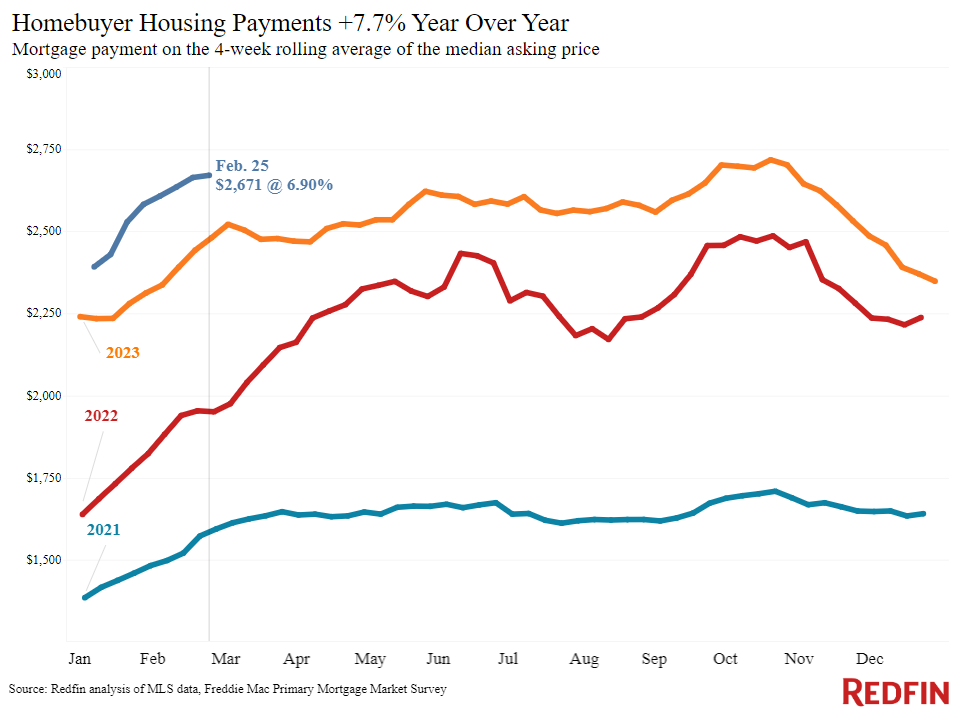
That’s welcome news for homebuyers, who have been battling the dual challenges of low inventory and high mortgage rates for over a year. But while today’s buyers have a few more homes to choose from, they’re still facing historically high housing costs. The typical homebuyer’s mortgage payment is $2,671, just $47 shy of last October’s record high.
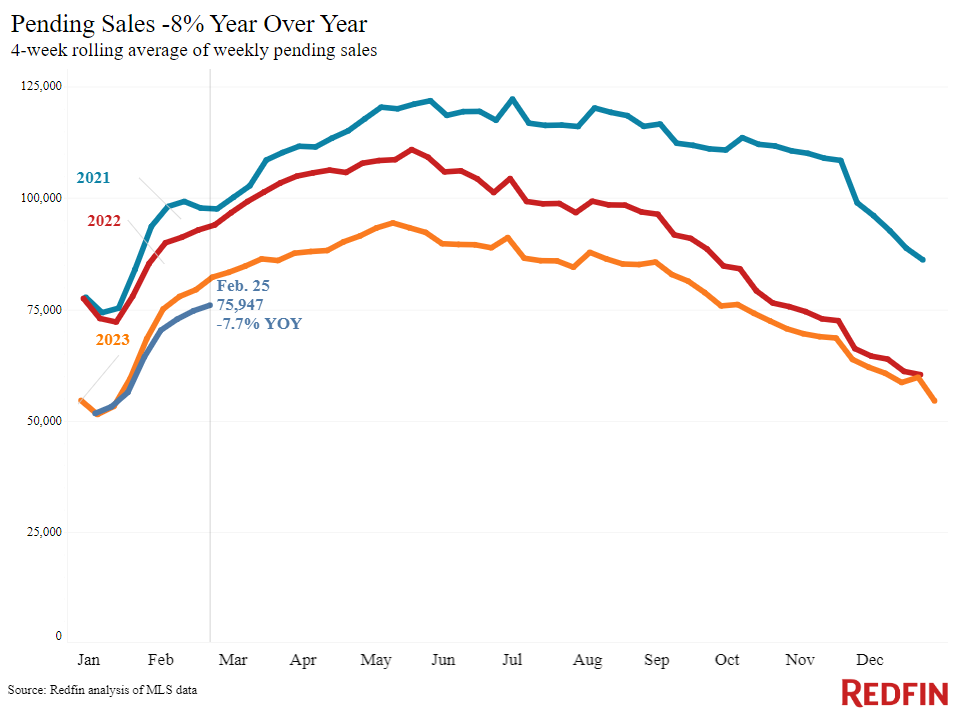
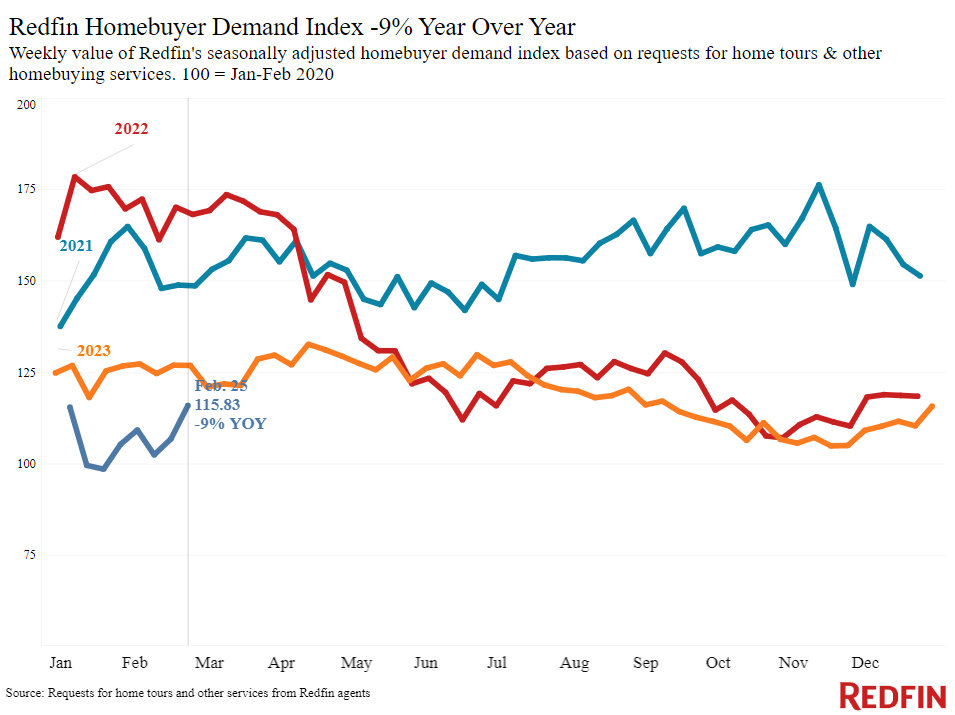
High costs pushed pending sales down 8%, the biggest decline in five months, and mortgage-purchase applications declined for the fourth straight week. But more house hunters are out there searching as more homes hit the market. Redfin’s Homebuyer Demand Index–a measure of requests for tours and other services from Redfin agents–is up 10% from a month ago to its highest level since last September. Pending sales could improve in the next few months if rates don’t increase further and new listings continue to rise.
“House hunters are out there, and competition picks up every time mortgage rates decline a bit,” said Brynn Rea, a Redfin Premier agent in Spokane, WA. “I’m telling buyers who can afford it to look now while they have more breathing room and less competition. They have a good chance of negotiating the price down or getting some concessions from the seller, which could make up for getting a 7% mortgage rate instead of 6%.”
Leading indicators
| Indicators of homebuying demand and activity | ||||
| Value (if applicable) | Recent change | Year-over-year change | Source | |
| Daily average 30-year fixed mortgage rate | 7.15% (Feb. 28) | Up from 6.92% a month earlier | Up from 6.78% | Mortgage News Daily |
| Weekly average 30-year fixed mortgage rate | 6.9% (week ending Feb. 22) | Up from 6.77% a week earlier | Up from 6.5% | Freddie Mac |
| Mortgage-purchase applications (seasonally adjusted) | Down 5% from a week earlier (as of week ending Feb. 23) | Down 12% | Mortgage Bankers Association | |
| Redfin Homebuyer Demand Index (seasonally adjusted) | Up 8% from a week earlier; up 10% from a month earlier (as of week ending Feb. 25) | Down 9% | Redfin Homebuyer Demand Index, a measure of requests for tours and other homebuying services from Redfin agents | |
| Google searches for “home for sale” | Up 7% from a month earlier (as of Feb. 24) | Down 8% | Google Trends | |
| Touring activity | Up 12% from the start of the year (as of Feb. 25) | At this time last year, it was up 14% from the start of 2023 | ShowingTime, a home touring technology company | |
Key housing-market data
| U.S. highlights: Four weeks ending February 25, 2024
Redfin’s national metrics include data from 400+ U.S. metro areas, and is based on homes listed and/or sold during the period. Weekly housing-market data goes back through 2015. Subject to revision. |
|||
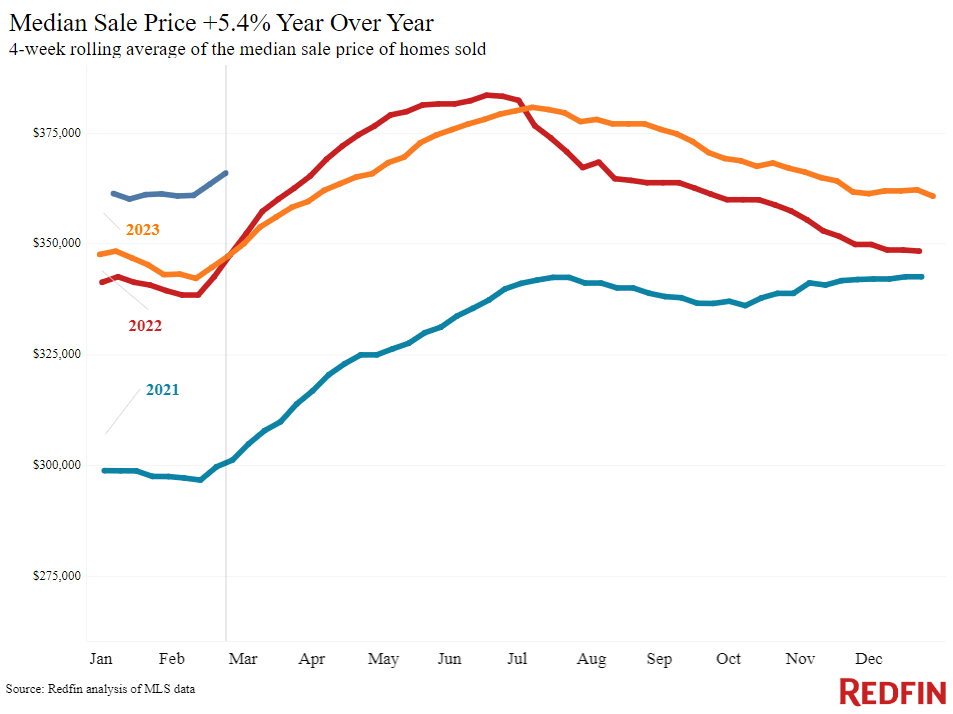
| Four weeks ending February 25, 2024 | Year-over-year change | Notes | |
| Median sale price | $365,888 | 5.4% | Biggest increase since Oct. 2022 (with the exception of the 4 weeks ending Feb. 11, when there was a 5.5% increase) |
| Median asking price | $396,975 | 5.5% | |
| Median monthly mortgage payment | $2,671 at a 6.9% mortgage rate | 7.7% | Down less than $50 from all-time high set in October 2023 |
| Pending sales | 75,947 | -7.7% | Biggest decline since Oct. 2022 |
| New listings | 79,354 | 12.9% | Biggest increase since June 2021 |
| Active listings | 763,254 | Unchanged | First time active listings haven’t posted a YoY decline since June 2023 |
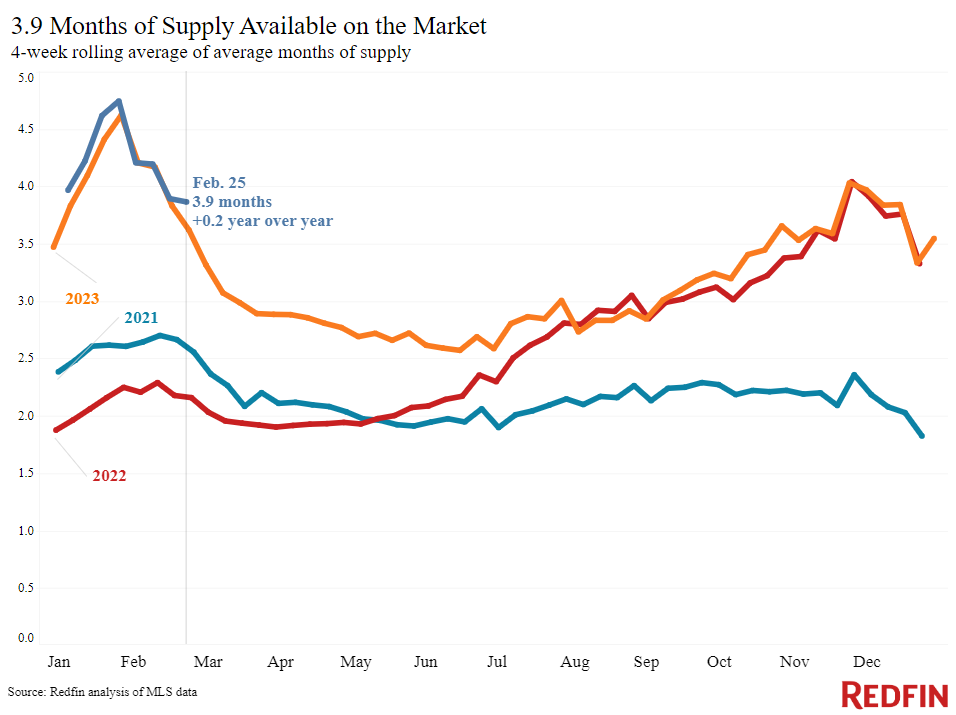
| Months of supply | 3.9 months | +0.2 pts. | 4 to 5 months of supply is considered balanced, with a lower number indicating seller’s market conditions. |
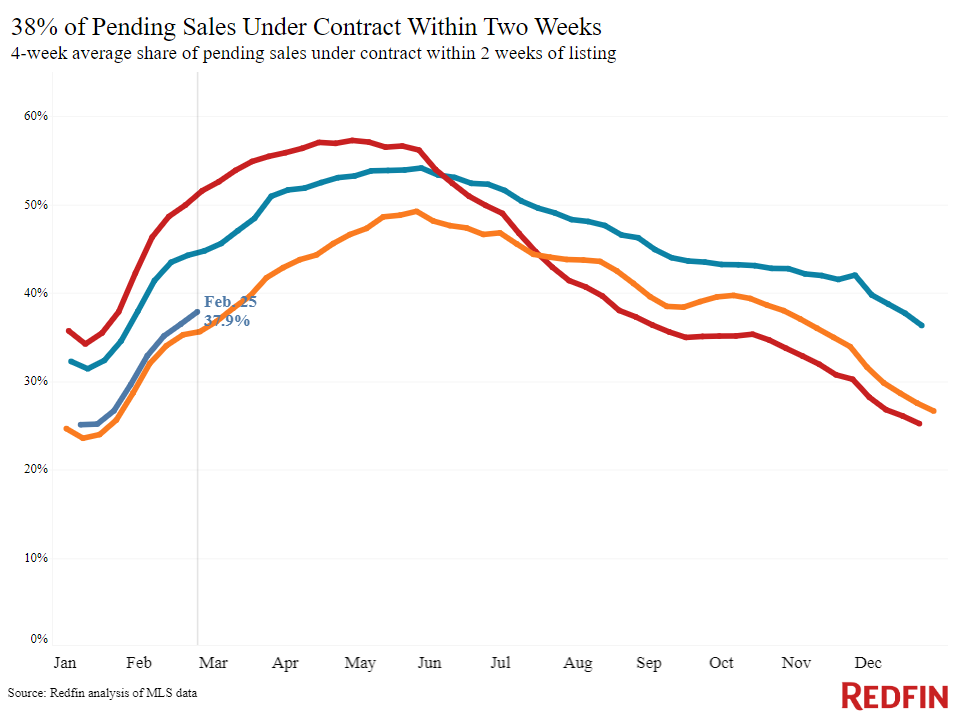
| Share of homes off market in two weeks | 37.9% | Up from 36% | |
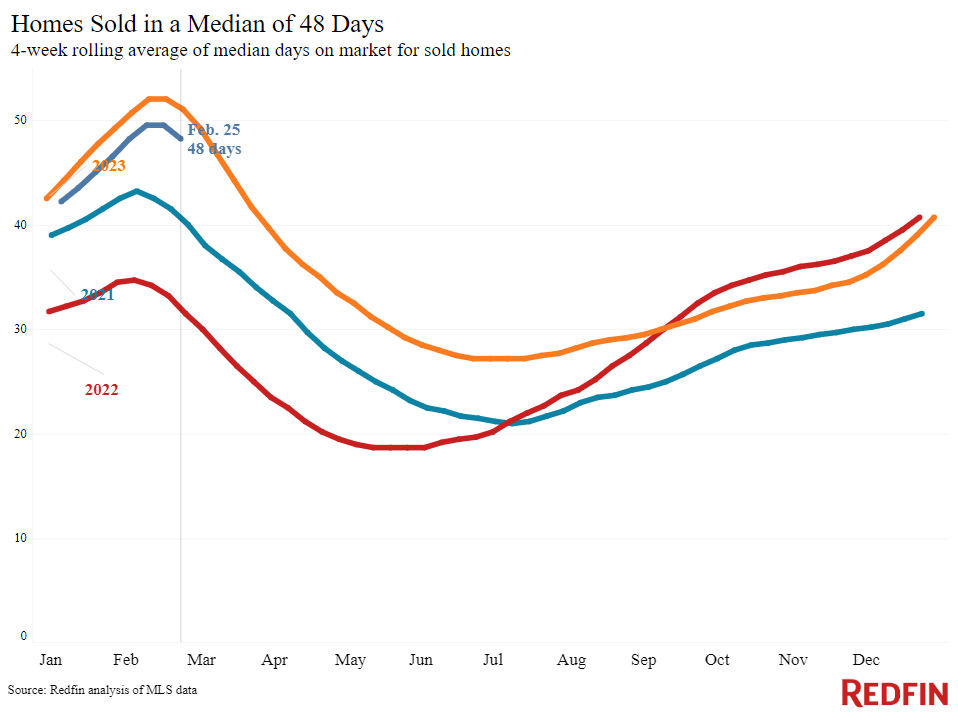
| Median days on market | 48 | -3 days | |
| Share of homes sold above list price | 23.6% | Up from 22% | |
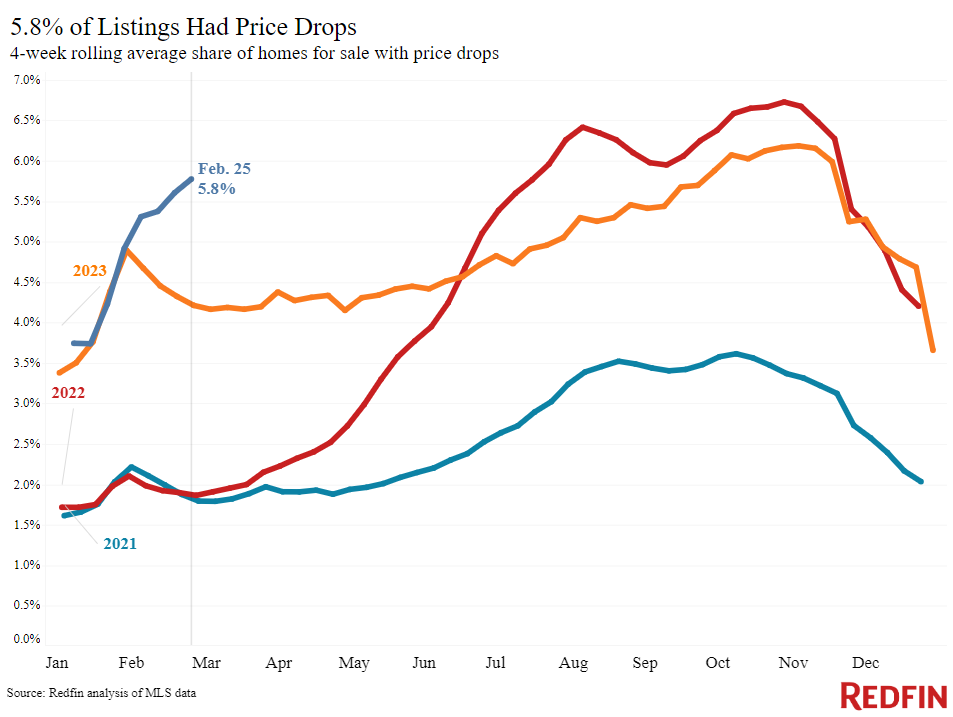
| Share of homes with a price drop | 5.8% | +1.6 pts. | |
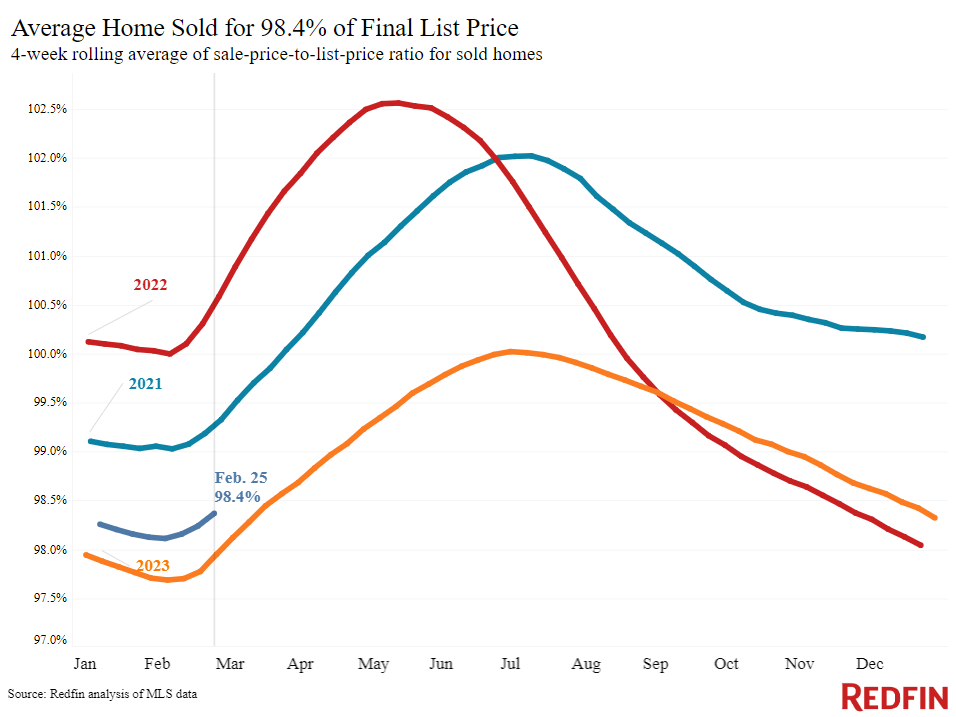
| Average sale-to-list price ratio | 98.4% | +0.4 pts. | |
|
Metro-level highlights: Four weeks ending February 25, 2024 Redfin’s metro-level data includes the 50 most populous U.S. metros. Select metros may be excluded from time to time to ensure data accuracy. |
|||
|---|---|---|---|
| Metros with biggest year-over-year increases | Metros with biggest year-over-year decreases | Notes | |
|
Median sale price |
Newark, NJ (15.5%) San Diego, CA (15.3%) Montgomery County, PA (14.5%) Pittsburgh (13.9%) Anaheim, CA (13.5%) |
San Antonio, TX (-5%) Detroit (-0.4%) |
Declined in 2 metros |
| Pending sales | Austin, TX (5.7%)
Milwaukee (3.7%) Minneapolis (2.6%) Cleveland (1.2%) Pittsburgh (0.6%) Cincinnati (0.6%) |
San Antonio, TX (-29.8%)
New Brunswick, NJ (-19.4%) Warren, MI (-18.3%) Atlanta (-16%) Houston (-15.6%) |
Increased in 6 metros |
| New listings | Dallas (35.5%)
Jacksonville, FL (34.3%) Austin, TX (31.6%) Fort Worth, TX (29.8%) Miami (25.7%) |
Atlanta (-5.8%)
Newark, NJ (-5.4%) Milwaukee (-4.6%) Providence, RI (-4.3%) Chicago (-1.5%) Warren, MI (-0.9%) |
Declined in 6 metros |
Refer to our metrics definition page for explanations of all the metrics used in this report.