New listings posted their biggest increase in two months this week, but mortgage applications and pending sales declined as mortgage rates stay stubbornly high.
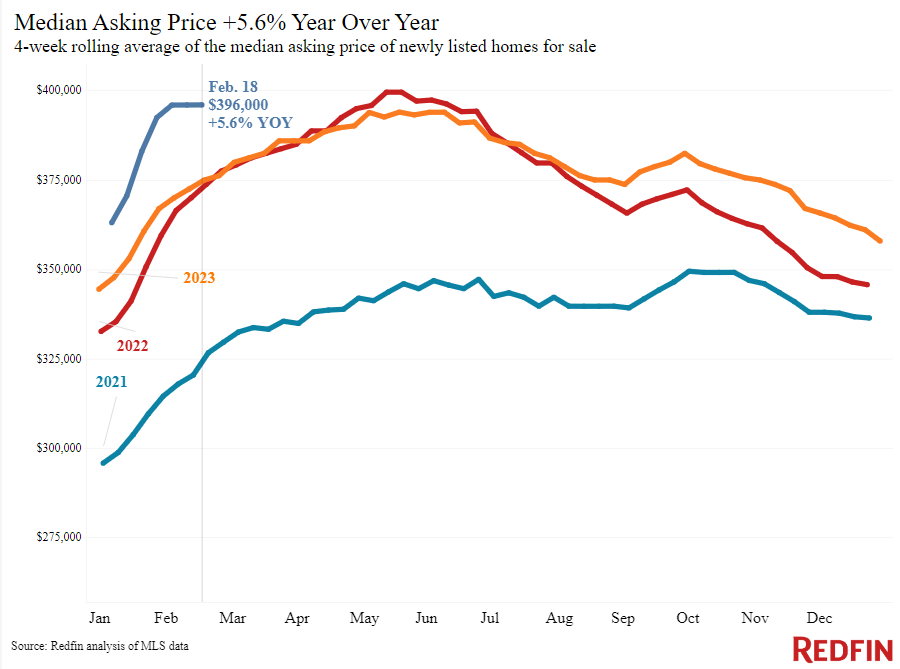
More sellers are listing their homes as spring draws nearer. New listings rose 10% year over year during the four weeks ending February 18, the biggest increase in two months. Sellers are hoping to take advantage of high prices: Sale prices are up 6% year over year, the biggest increase since October 2022.
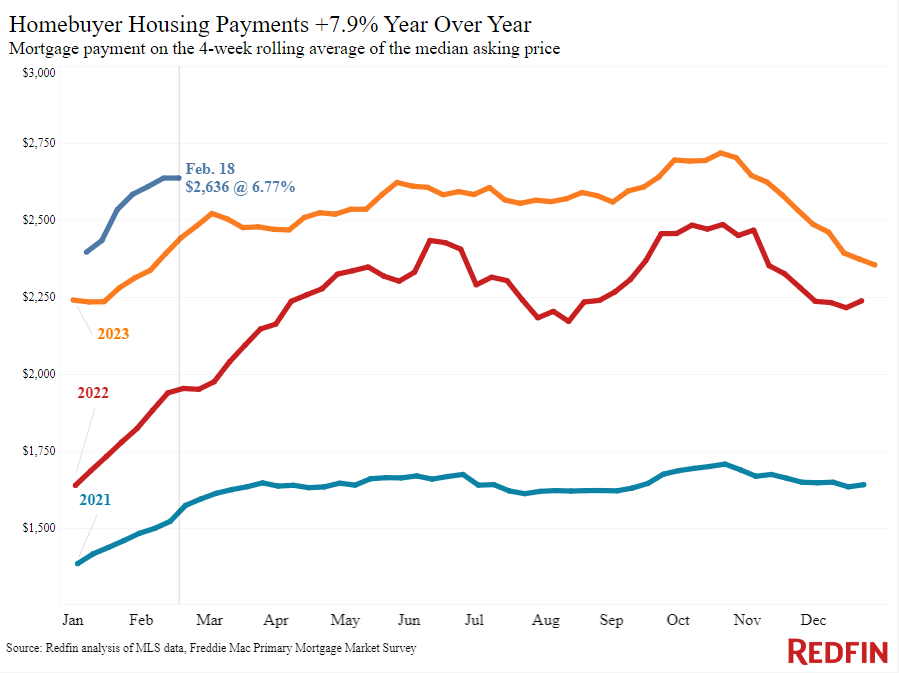
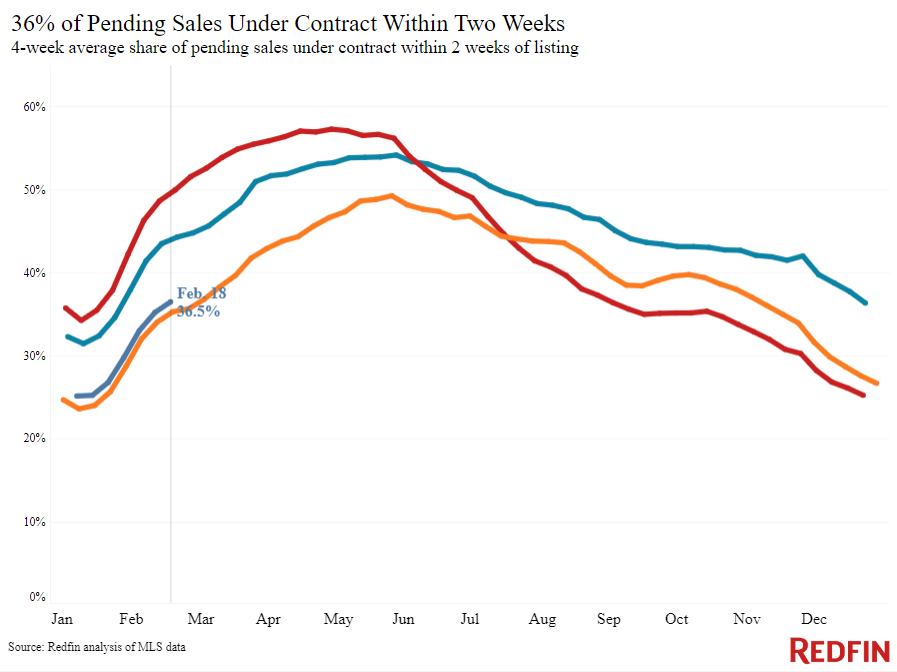
But many buyers are still sitting on the sidelines. Mortgage-purchase applications dropped 10% from a week earlier as daily average mortgage rates surpassed 7% for the first time since mid-December, and pending home sales are down 7% year over year, similar to the declines we’ve seen since mid-January.
Redfin agents report that the buyers who are out there are mostly interested in move-in ready homes because they don’t want to spend money on repairs and renovations in addition to high monthly payments. Agents also recommend that sellers are open to providing some sort of financial concession to buyers to help ease the pain of 7% rates.
“I tell every one of my sellers to have an open mind and put on their buyer’s hat. Nine times out of 10, buyers are asking for a concession in their initial offer right now–and usually the seller needs to accept it to seal the deal,” said Shauna Pendleton, a Redfin Premier agent in Boise, ID. “The most common concession buyers are asking for is a mortgage-rate buydown. Requests for sellers to cover the closing costs are also common. I most often see buyers ask for concessions for more affordable homes–anything under $500,000 here in Boise–but I see some concessions on expensive homes, too.”
| Indicators of homebuying demand and activity | ||||
| Value (if applicable) | Recent change | Year-over-year change | Source | |
| Daily average 30-year fixed mortgage rate | 7.11% (Feb. 20) | Up from 6.92% a month earlier | Up from 6.78% | Mortgage News Daily |
| Weekly average 30-year fixed mortgage rate | 6.77% (week ending Feb. 15) | Up from 6.64% a week earlier | Up from 6.12% | Freddie Mac |
| Mortgage-purchase applications (seasonally adjusted) | Down 10% from a week earlier (as of week ending Feb. 16) | Down 13% | Mortgage Bankers Association | |
| Redfin Homebuyer Demand Index (seasonally adjusted) | Up about 5% from a week earlier (as of week ending Feb. 18) | Down 15% | Redfin Homebuyer Demand Index, a measure of requests for tours and other homebuying services from Redfin agents | |
| Google searches for “home for sale” | Down 4% from a month earlier (as of Feb. 17) | Down 15% | Google Trends | |
| Touring activity | Up 10% from the start of the year (as of Feb. 20) | At this time last year, it was up 14% from the start of 2023 | ShowingTime, a home touring technology company | |
Key housing-market data
| U.S. highlights: Four weeks ending February 18, 2024
Redfin’s national metrics include data from 400+ U.S. metro areas, and is based on homes listed and/or sold during the period. Weekly housing-market data goes back through 2015. Subject to revision. |
|||
| Four weeks ending February 18, 2024 | Year-over-year change | Notes | |
| Median sale price | $364,751 | 5.8% | Biggest increase since Oct. 2022 |
| Median asking price | $396,000 | 5.6% | |
| Median monthly mortgage payment | $2,636 at a 6.77% mortgage rate | 7.9% | Down less than $100 from all-time high set in October 2023 |
| Pending sales | 74,092 | -6.7% | |
| New listings | 76,216 | 9.8% | Biggest increase since Dec. 2023 |
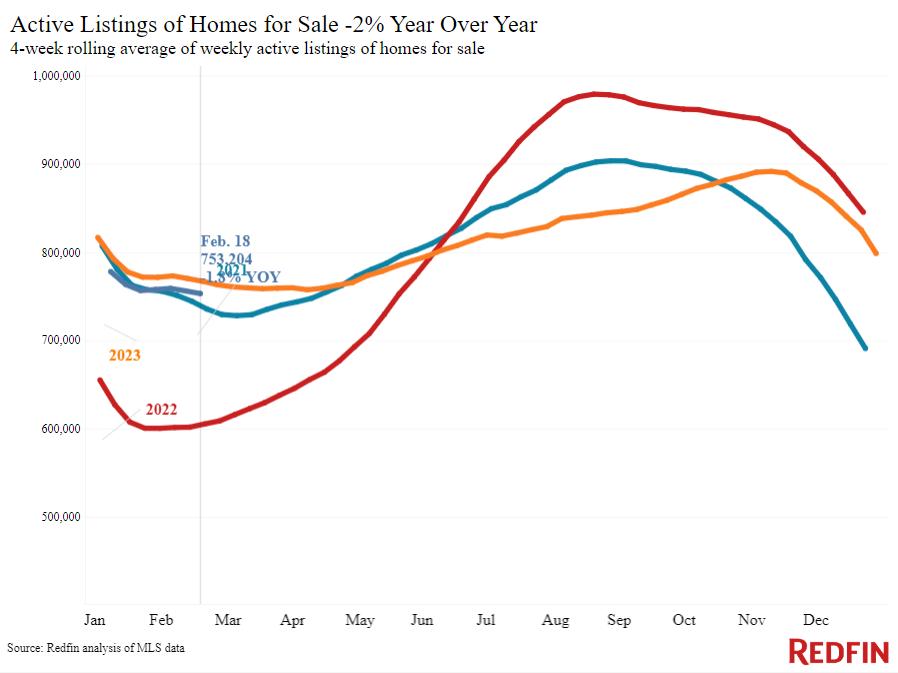
| Active listings | 753,204 | -1.8% | |
| Months of supply | 3.9 months | +0.1 pt. | 4 to 5 months of supply is considered balanced, with a lower number indicating seller’s market conditions. |
| Share of homes off market in two weeks | 36.5% | Up from 35% | |
| Median days on market | 50 | -2 days | |
| Share of homes sold above list price | 22.9% | Up from 21% | |
| Share of homes with a price drop | 5.7% | +1.4 pts. | |
| Average sale-to-list price ratio | 98.3% | +0.5 pts. | |
|
Metro-level highlights: Four weeks ending February 18, 2024 Redfin’s metro-level data includes the 50 most populous U.S. metros. Select metros may be excluded from time to time to ensure data accuracy. |
|||
|---|---|---|---|
| Metros with biggest year-over-year increases | Metros with biggest year-over-year decreases | Notes | |
|
Median sale price |
San Diego, CA (15%)
Newark, NJ (14.3%) Anaheim, CA (13.5%) Philadelphia, PA (12.6%) West Palm Beach, FL (12.4%) |
San Antonio, TX (-4.1%) Austin, TX (-0.4%) Fort Worth, TX (-0.3%) |
Declined in 3 metros |
| Pending sales | Austin, TX (5%)
San Jose, CA (1.9%) |
San Antonio, TX (-31.8%)
Cleveland, OH (-25.2%) Warren, MI (-23.5%) Portland, OR (-20.7%) New Brunswick, NJ (-18.4%) |
Increased in 2 metros |
| New listings | Jacksonville, FL (33.5%)
Dallas, TX (33%) Fort Worth, TX (26%) Fort Lauderdale, FL (25.3%) Austin, TX (22.6%) |
Cleveland, OH (-25.3%)
Atlanta (-13.3%) Milwaukee, WI (-9.5%) Warren, MI (-6.7%) Newark, NJ (-6.3%) |
Declined in 11 metros |
Refer to our metrics definition page for explanations of all the metrics used in this report.