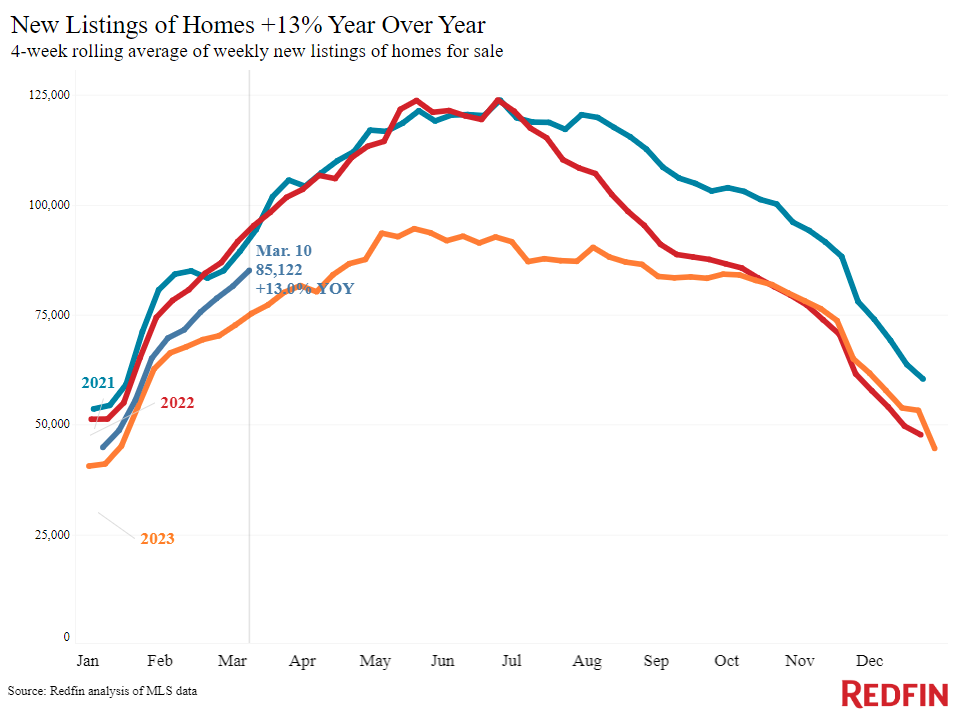
New listings rose 13% from a year earlier, their biggest increase in nearly three years, but home prices and mortgage rates remain elevated.
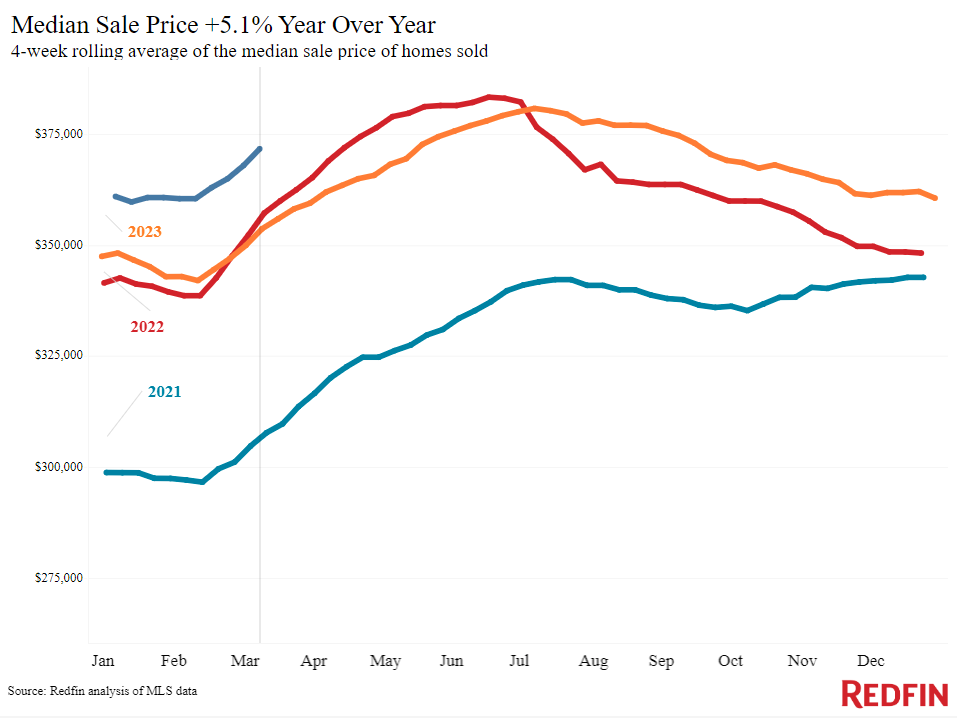
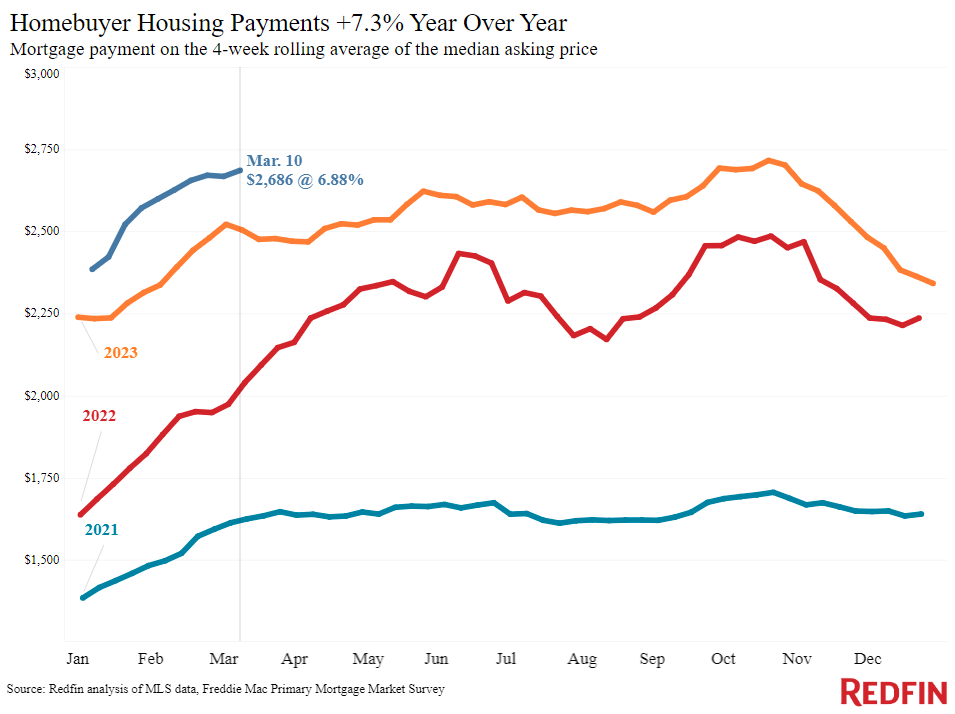
The median U.S. monthly housing payment was $2,686 during the four weeks ending March 10, just $30 shy of last October’s all-time high. That’s due to a combination of still-high mortgage rates and rising prices. While mortgage rates came down slightly this past week after increasing for four straight weeks, they’re still near 7%, and sale prices are up 5% year over year nationwide. On a local level, prices increased in all 50 of the most populous U.S. metros, the first time that has happened since July 2022.
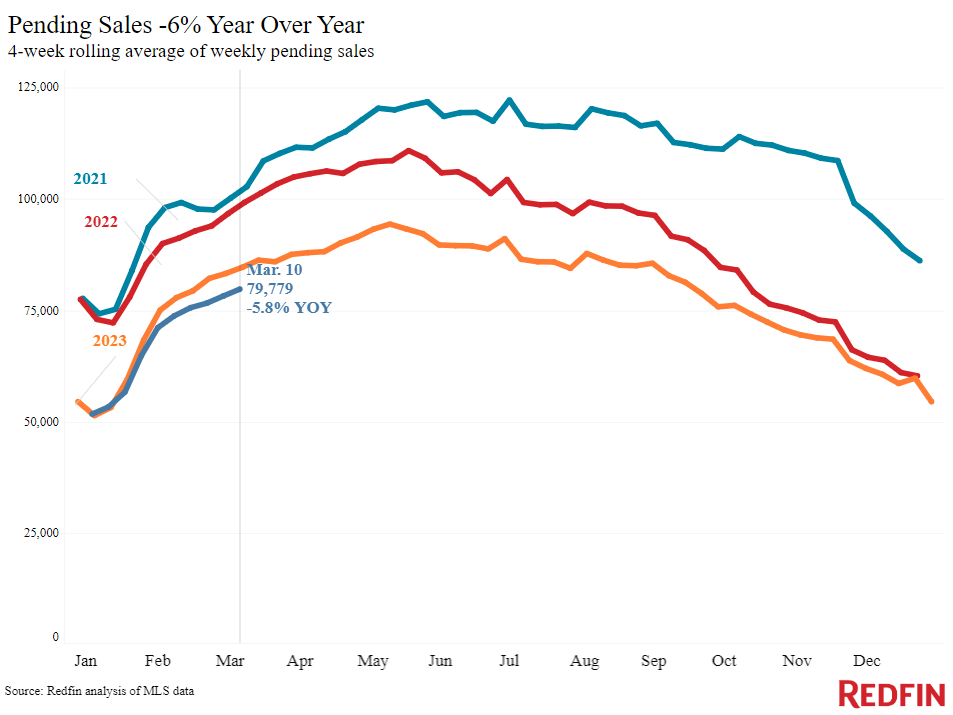
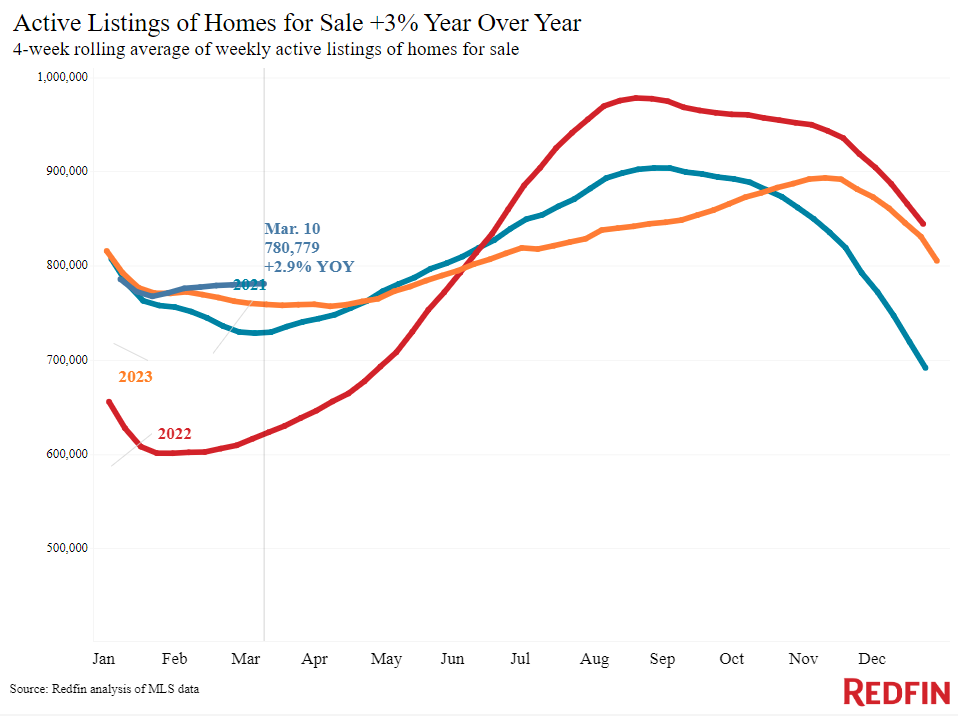
High housing costs are still pricing out some would-be homebuyers, with pending sales down 6% from a year earlier. But more house hunters are wading into the market; mortgage-purchase applications rose for the second week in a row. That’s partly because supply is steadily improving, giving buyers who can afford elevated prices and rates more homes to choose from. New listings are up 13%, the biggest annual increase in nearly three years, and the total number of homes for sale is up 3%, the biggest increase in nine months.
“Mortgage rates are likely to stay high a little longer than expected, with the latest inflation report essentially eliminating any chance of the Fed cutting interest rates before June,” said Redfin Economic Research Lead Chen Zhao. “Buyers who can afford to may want to get serious about their home search now, as housing costs are unlikely to fall anytime soon. The uptick in listings should be another motivator for buyers: There’s more to choose from, and improving inventory may bring out more competition from other buyers as we get further into spring. Some buyers have already gotten the memo, with mortgage applications finally increasing after weeks of declines.”
For more on Redfin economists’ takes on the housing market, including how current financial events are impacting mortgage rates, please visit our “From Our Economists” page.
Leading indicators
| Indicators of homebuying demand and activity | ||||
| Value (if applicable) | Recent change | Year-over-year change | Source | |
| Daily average 30-year fixed mortgage rate | 6.94% (March 13) | Down from 6.97% a week earlier | Up from 6.75% | Mortgage News Daily |
| Weekly average 30-year fixed mortgage rate | 6.88% (week ending March 7) | Down from 6.94% a week earlier; first decline after 4 weeks of increases | Up from 6.73% | Freddie Mac |
| Mortgage-purchase applications (seasonally adjusted) | Up 5% from a week earlier (as of week ending March 8); 2nd straight week of increases | Down 11% | Mortgage Bankers Association | |
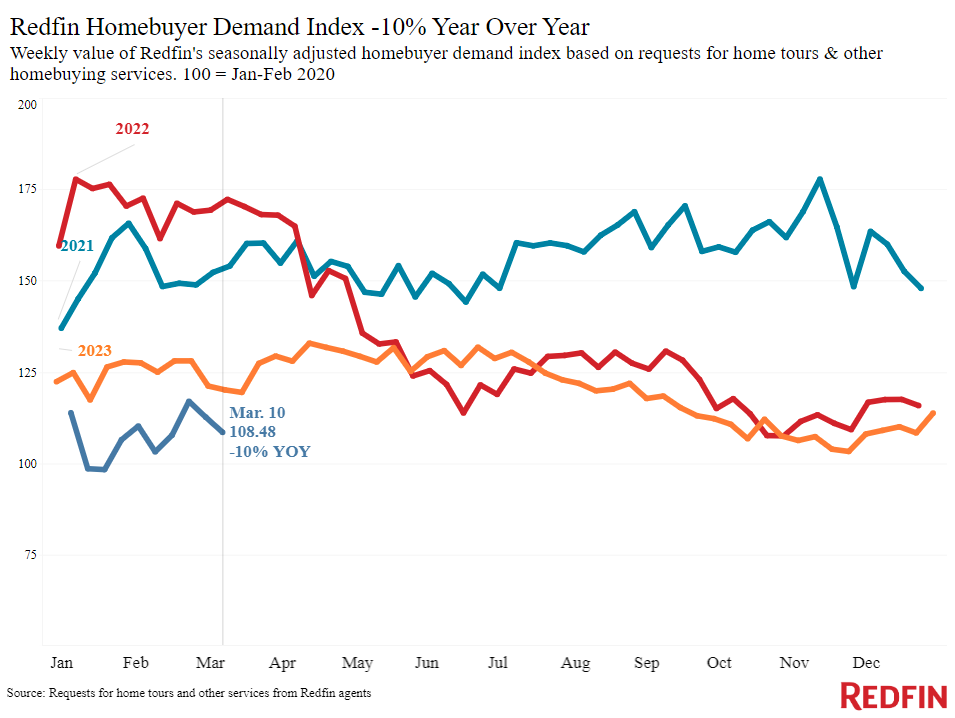
| Redfin Homebuyer Demand Index (seasonally adjusted) | Up 5% from a month earlier (as of week ending March 10) | Down 10% | Redfin Homebuyer Demand Index, a measure of requests for tours and other homebuying services from Redfin agents | |
| Google searches for “home for sale” | Down 4% from a month earlier (as of March 9) | Down 19% | Google Trends | |
| Touring activity | Up 29% from the start of the year (as of March 10) | At this time last year, it was up 20% from the start of 2023 | ShowingTime, a home touring technology company | |
Key housing-market data
| U.S. highlights: Four weeks ending March 10, 2024
Redfin’s national metrics include data from 400+ U.S. metro areas, and is based on homes listed and/or sold during the period. Weekly housing-market data goes back through 2015. Subject to revision. |
|||
| Four weeks ending March 10, 2024 | Year-over-year change | Notes | |
| Median sale price | $371,750 | 5.1% | |
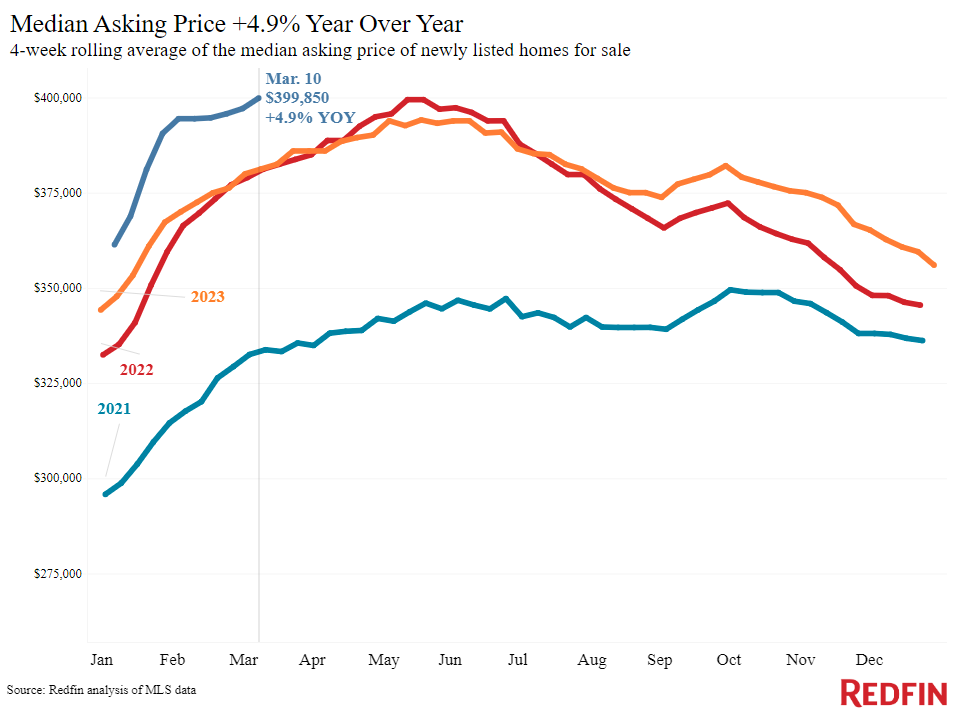
| Median asking price | $399,850 | 4.9% | |
| Median monthly mortgage payment | $2,686 at a 6.88% mortgage rate | 7.3% | Just $30 shy of all-time high set in October 2023 |
| Pending sales | 79,779 | -5.8% | |
| New listings | 85,122 | 13% | Biggest increase since June 2021 |
| Active listings | 780,779 | 2.9% | Biggest increase since May 2023 |
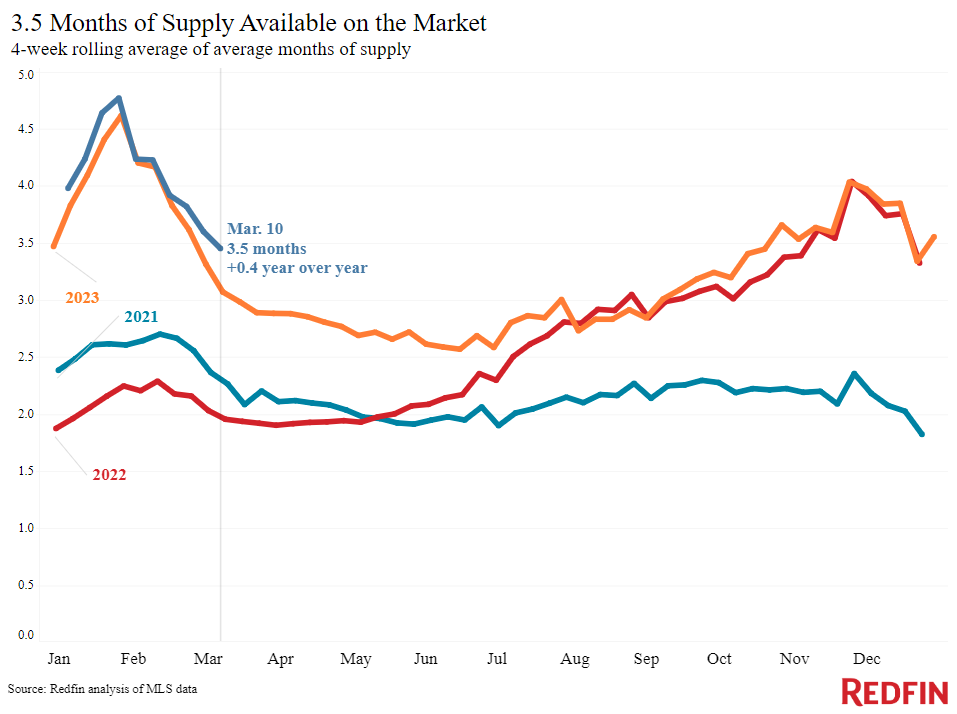
| Months of supply | 3.5 months | +0.4 pts. | 4 to 5 months of supply is considered balanced, with a lower number indicating seller’s market conditions. |
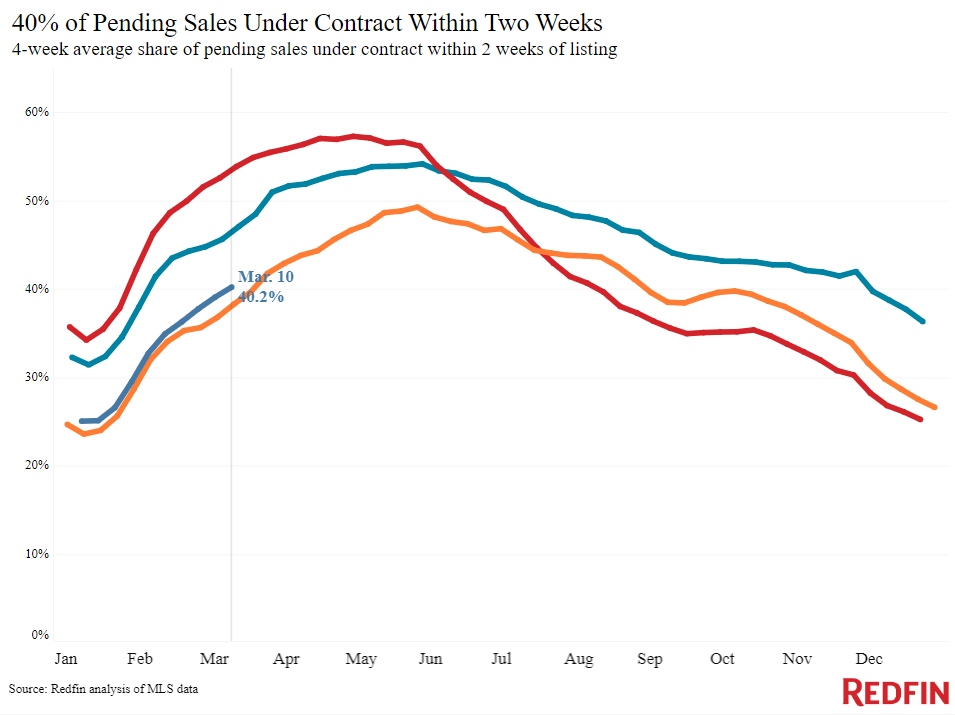
| Share of homes off market in two weeks | 40.2% | Up from 38% | |
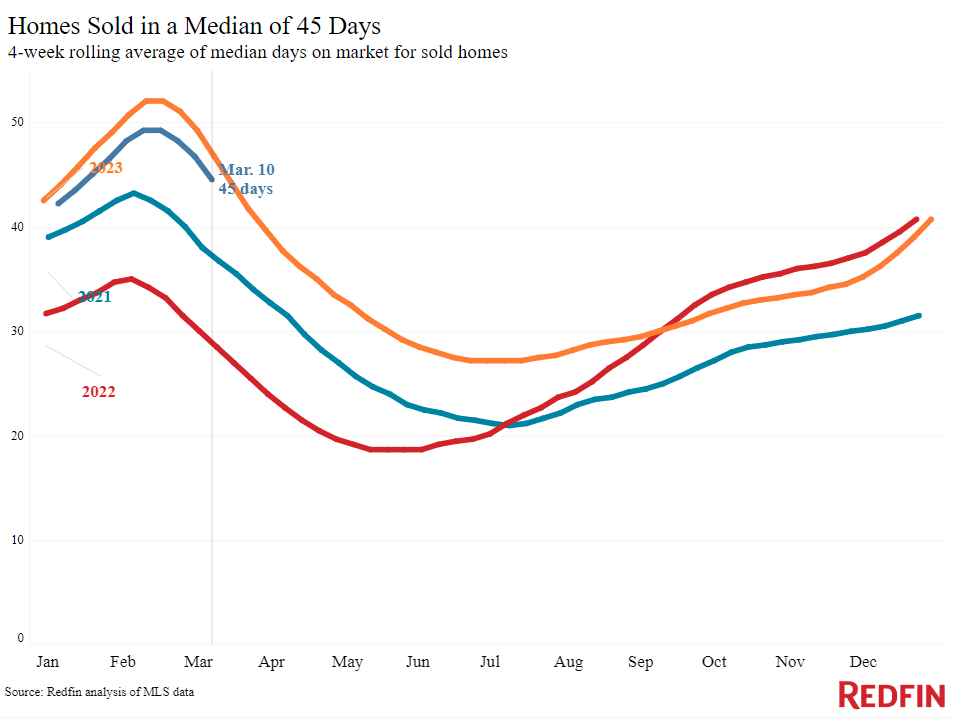
| Median days on market | 45 | -2 days | |
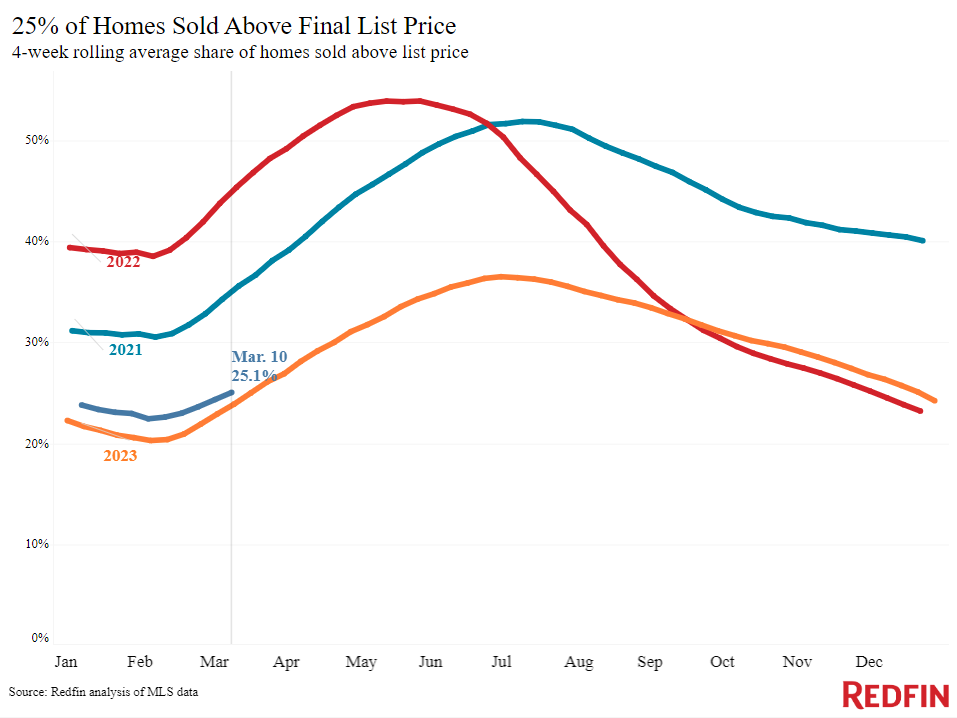
| Share of homes sold above list price | 25.1% | Up from 24% | |
| Share of homes with a price drop | 5.6% | +1.5 pts. | |
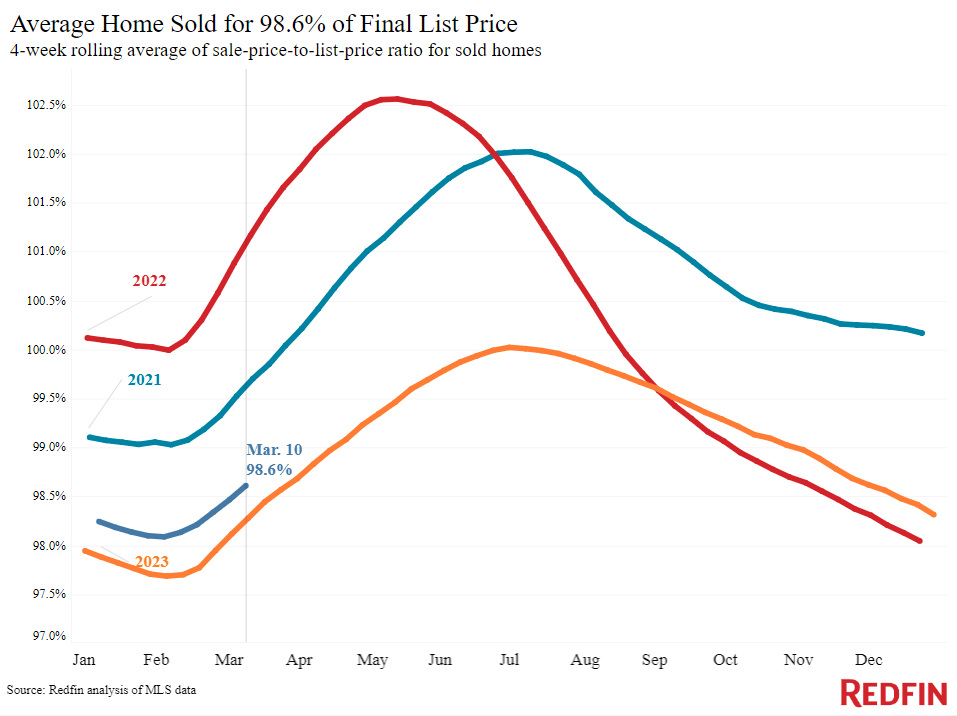
| Average sale-to-list price ratio | 98.6% | +0.3 pts. | |
|
Metro-level highlights: Four weeks ending March 10, 2024 Redfin’s metro-level data includes the 50 most populous U.S. metros. Select metros may be excluded from time to time to ensure data accuracy. |
|||
|---|---|---|---|
| Metros with biggest year-over-year increases | Metros with biggest year-over-year decreases | Notes | |
|
Median sale price |
San Jose, CA (16.3%)
Newark, NJ (15.1%) Boston (14.9%) West Palm Beach, FL (14.8%) Fort Lauderdale, FL (13.8%) |
n/a |
Increased in all metros |
| Pending sales | Milwaukee (11.5%)
San Francisco (9%) Cincinnati (8%) Minneapolis (7.5%) San Jose, CA (5.8%) |
San Antonio, TX (-25.8%)
New York (-15%) Atlanta (-14.8%) Houston (-13.9%) New Brunswick, NJ (-13.8%) |
Increased in 12 metros |
| New listings | San Jose, CA (30.4%)
Phoenix (29.9%) Las Vegas (27.4%) Minneapolis (26%) Jacksonville, FL (24.9%) |
New York (-18.4%)
Atlanta (-5.8%) Newark, NJ (-3.9%) Chicago (-0.7%) Virginia Beach, VA (-0.4%) Philadelphia (-0.2%) |
Declined in 6 metros |
Refer to our metrics definition page for explanations of all the metrics used in this report.

 United States
 Canada