New listings have inched up this fall, giving the buyers who remain in the market a few more homes to choose from. But many buyers are retreating as mortgage rates stay elevated.
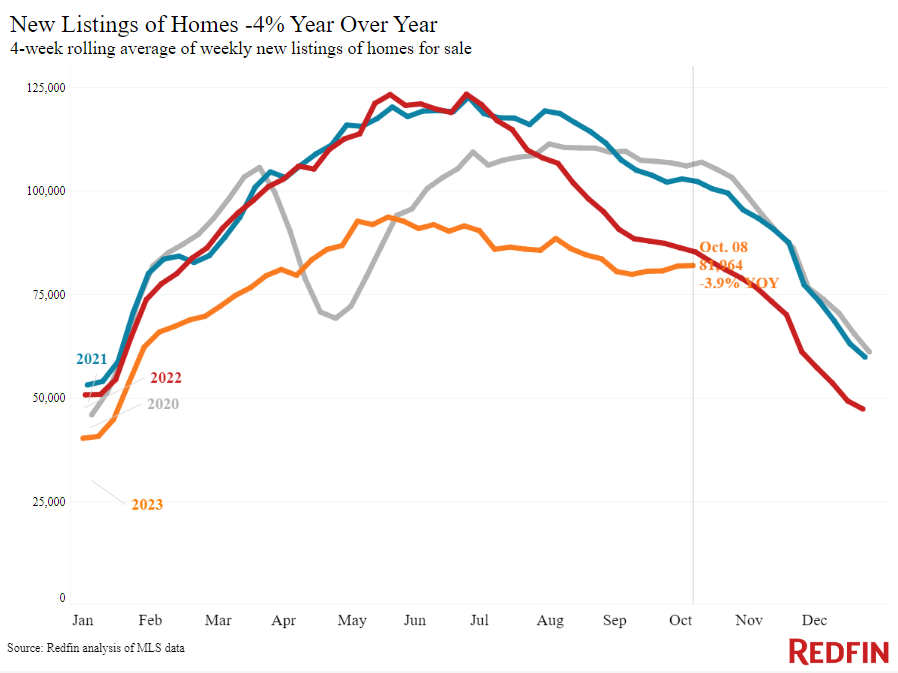
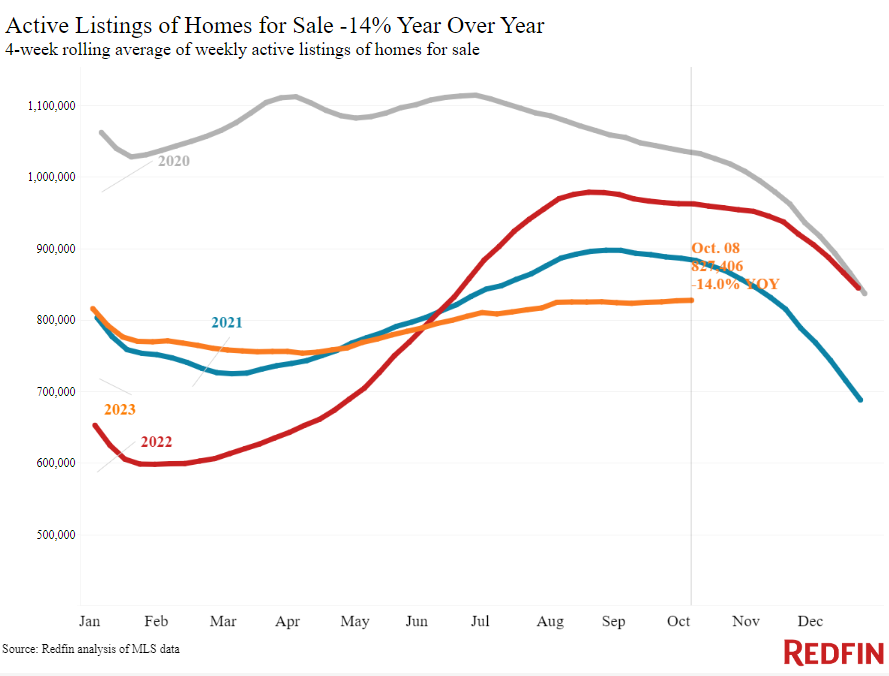
What home sellers are doing: A few more homeowners are putting their homes on the market, despite being locked into relatively low mortgage rates. New listings of U.S. homes for sale have ticked up 2% since the start of September, and listings haven’t fallen as much from summer to fall as they typically do. The total number of homes for sale is down 14% from a year earlier during the four weeks ending October 8, but that’s the smallest decline since July.
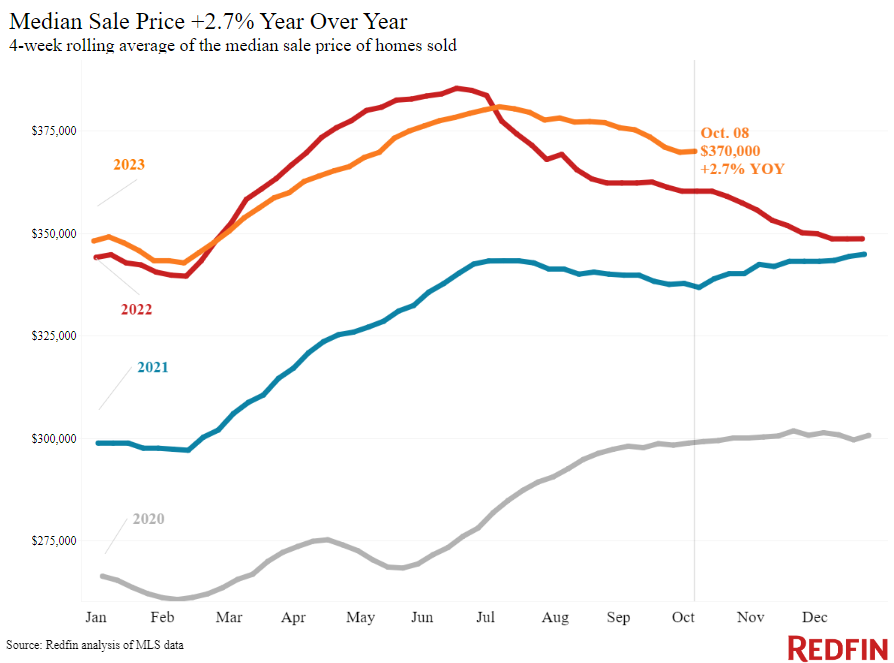
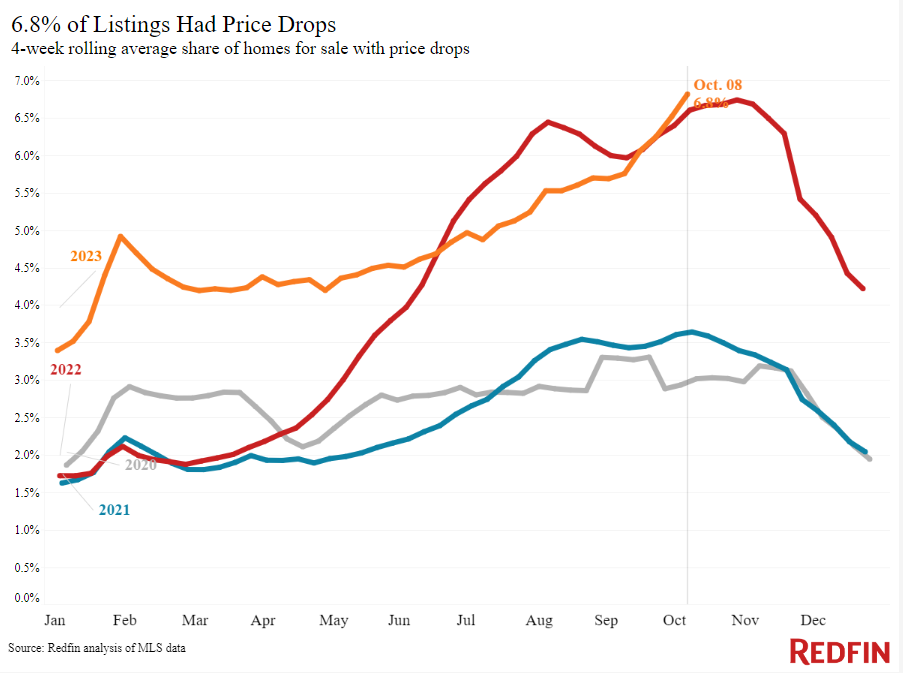
Advice for sellers: Take advantage of still-rising prices; the median sale price is up 3% year over year despite low demand. But with the share of for-sale homes with a price drop at its highest level in nearly a year and high mortgage rates cutting into buyers’ budgets, be mindful of setting a fair price. “Inventory is low enough that most move-in ready, well-priced homes are going quickly,” said Nashville, TN Redfin Premier agent Kristin Sanchez. “But sellers who are pricing unrealistically high are seeing their homes sit on the market, and many are forced to accept offers under asking price. My best advice: Price your home fairly so it sells as fast as possible.”
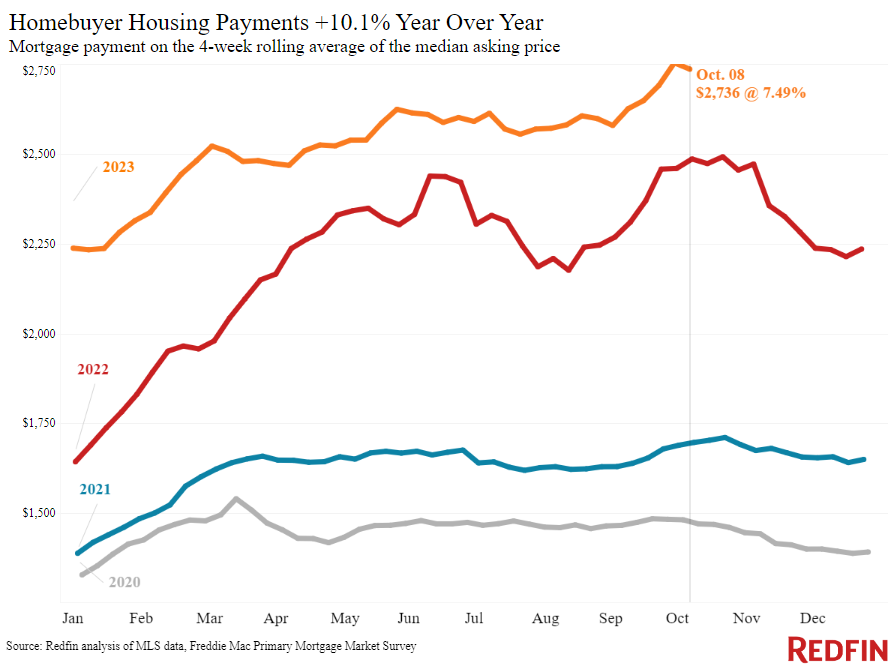
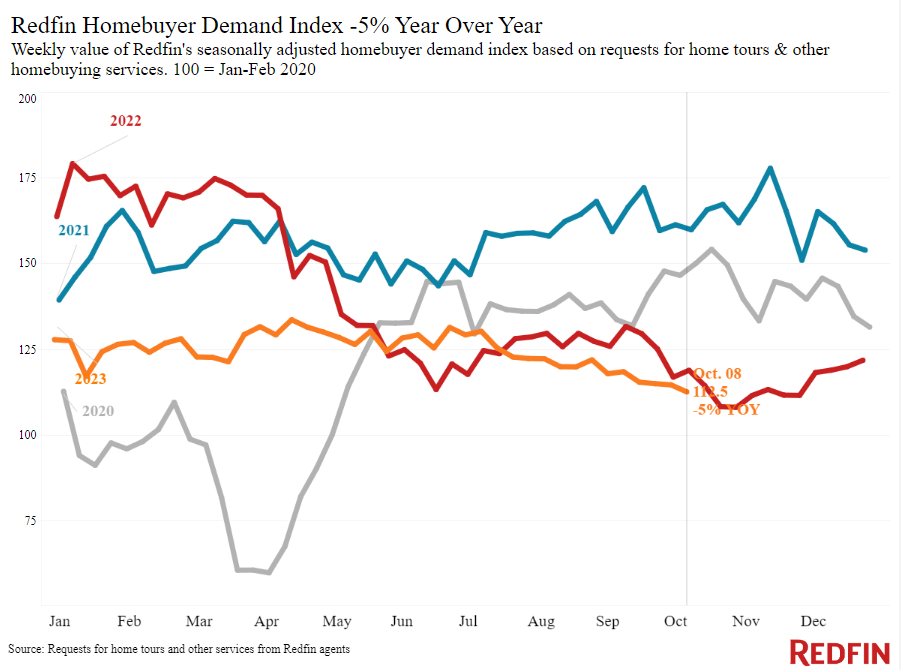
What homebuyers are doing: Retreating as mortgage rates sit near their highest level in more than two decades and the median U.S. monthly mortgage payment approaches $3,000. Mortgage-purchase applications inched up slightly this week, but they’re still near their lowest level in nearly 30 years, and Redfin’s Homebuyer Demand Index—which measures tour requests and other early-stage demand signals—dropped to its lowest level in nearly a year.
Advice for buyers: All hope is not lost for people who want to buy a home soon. Even though mortgage rates are likely to remain elevated, buyers on the fence may consider jumping into the market when there’s a small reprieve: Along with the small uptick in new listings to choose from, daily average rates have come down some from the peak they reached last week. “Despite last week’s hotter-than-expected jobs report, rates have fallen after the Fed signaled this week that it is unlikely to hike interest rates again and war broke out in Israel,” said Redfin Economic Research Lead Chen Zhao. “Buyers should also remember that the average mortgage rate in the news is just that: an average. Many buyers can secure a lower rate by shopping around; the difference between rates among lenders is bigger when rates are higher. Buying down a mortgage rate is always an option, too.”
Leading indicators
| Indicators of homebuying demand and activity | ||||
| Value (if applicable) | Recent change | Year-over-year change | Source | |
| Daily average 30-year fixed mortgage rate | 7.6% (Oct. 11) | Down from last week’s two-decade peak of 7.81% | Up from 7.1% | Mortgage News Daily |
| Weekly average 30-year fixed mortgage rate | 7.49% (week ending Oct. 5) | Highest level in over 2 decades | Up from 6.7% | Freddie Mac |
| Mortgage-purchase applications (seasonally adjusted) | Up 1% from a week earlier (as of week ending Oct. 6) | Down 19% | Mortgage Bankers Association | |
| Redfin Homebuyer Demand Index (seasonally adjusted) | Down slightly from a month earlier (as of the 4 weeks ending Oct. 8) to its lowest level in nearly a year | Down 5% | Redfin Homebuyer Demand Index, a measure of requests for tours and other homebuying services from Redfin agents | |
| Google searches for “home for sale” | Down 12% from a month earlier (as of Oct. 7) | Down 12% | Google Trends | |
Key housing-market data
| U.S. highlights: Four weeks ending October 8, 2023
Redfin’s national metrics include data from 400+ U.S. metro areas, and is based on homes listed and/or sold during the period. Weekly housing-market data goes back through 2015. Subject to revision. |
|||
| Four weeks ending October 8, 2023 | Year-over-year change | Notes | |
| Median sale price | $370,000 | 2.7% | Prices are up partly because elevated mortgage rates were hampering prices during this time last year |
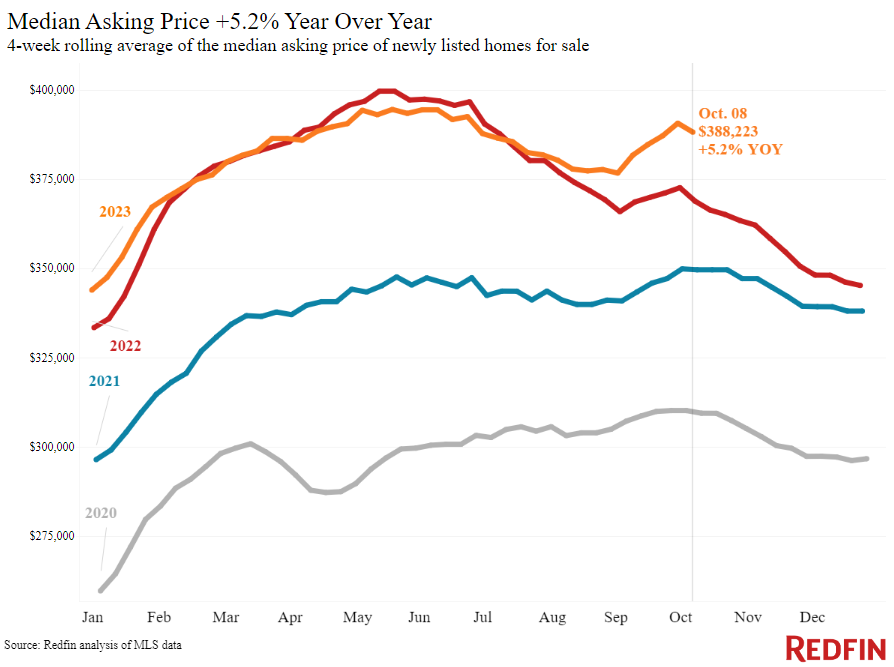
| Median asking price | $388,223 | 5.2% | Biggest increase in a year |
| Median monthly mortgage payment | $2,736 at a 7.49% mortgage rate | 10% | Just shy of the all-time high set a week earlier |
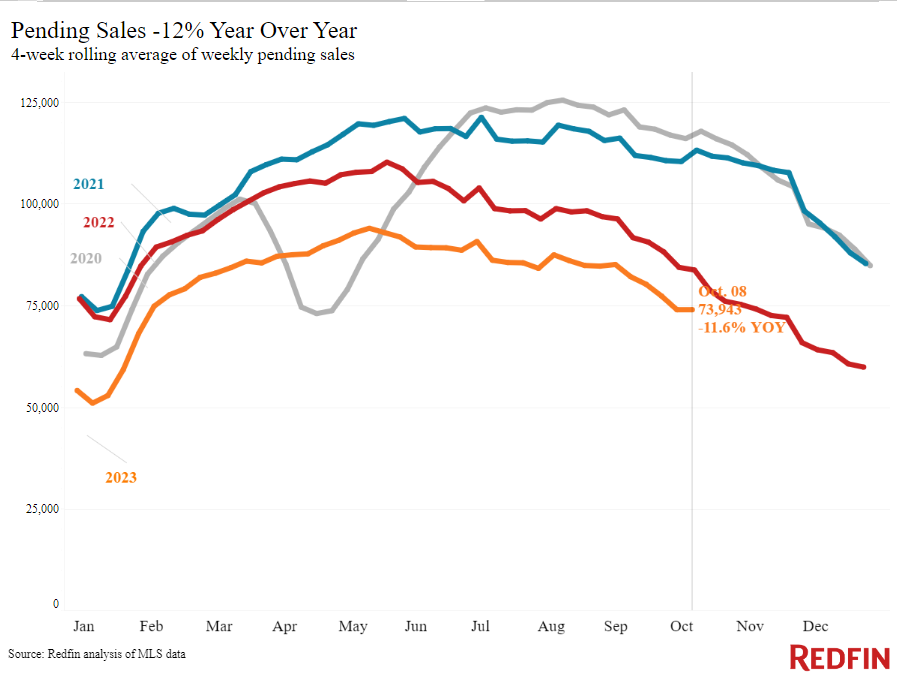
| Pending sales | 73,943 | -11.6% | |
| New listings | 81,964 | -3.9% | Smallest decline since July 2022, in part because new listings fell rapidly at this time in 2022 |
| Active listings | 827,406 | -14% | Tied with the previous week for smallest decline in four months |
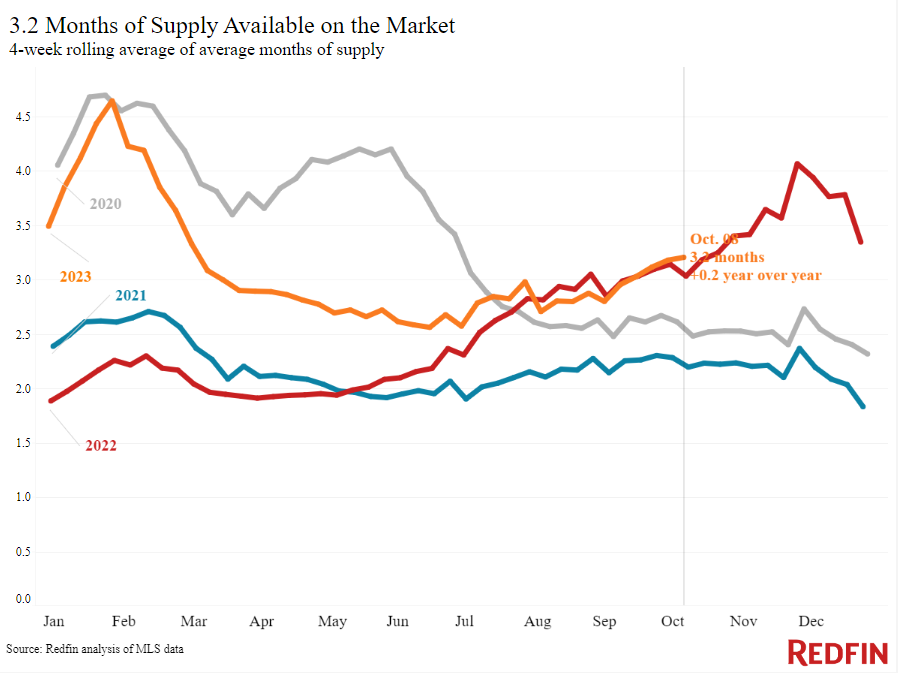
| Months of supply | 3.2 months | +0.2 pts. | 4 to 5 months of supply is considered balanced, with a lower number indicating seller’s market conditions. |
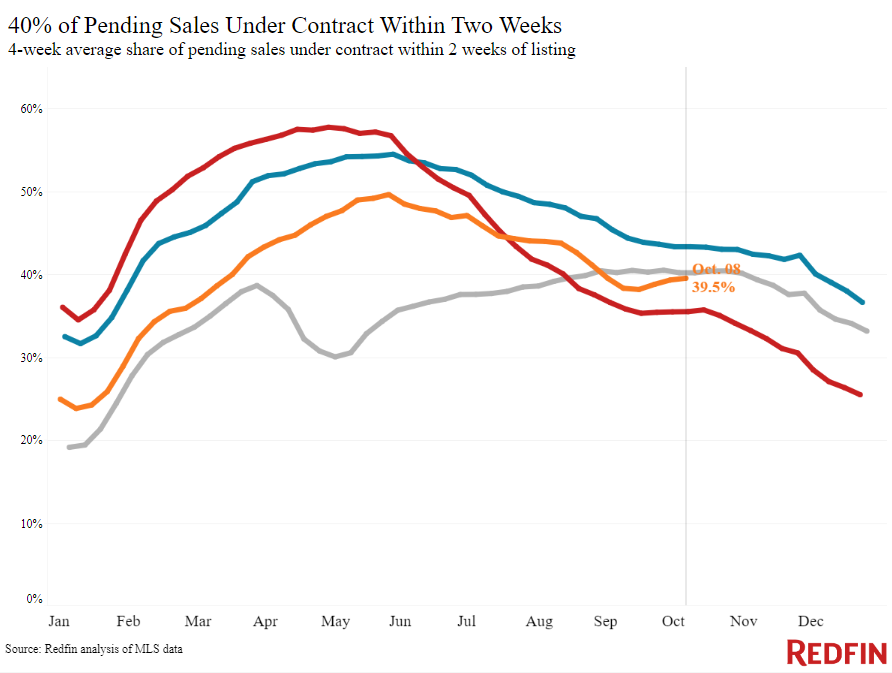
| Share of homes off market in two weeks | 39.5% | Up from 36% | |
| Median days on market | 32 | -2 days | |
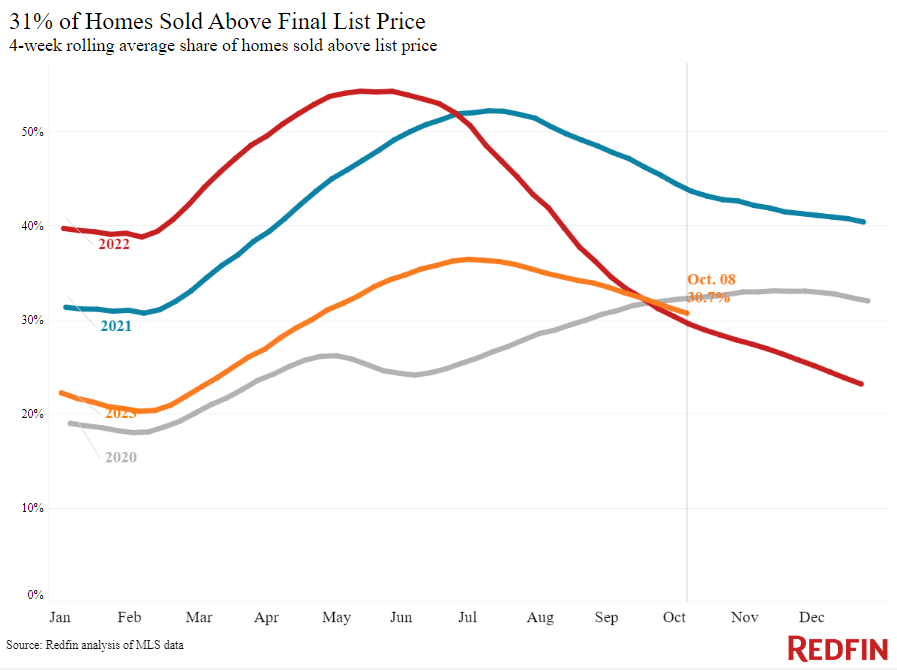
| Share of homes sold above list price | 30.7% | Up from 30% | |
| Share of homes with a price drop | 6.8% | +0.2 pts. | Highest level in a year |
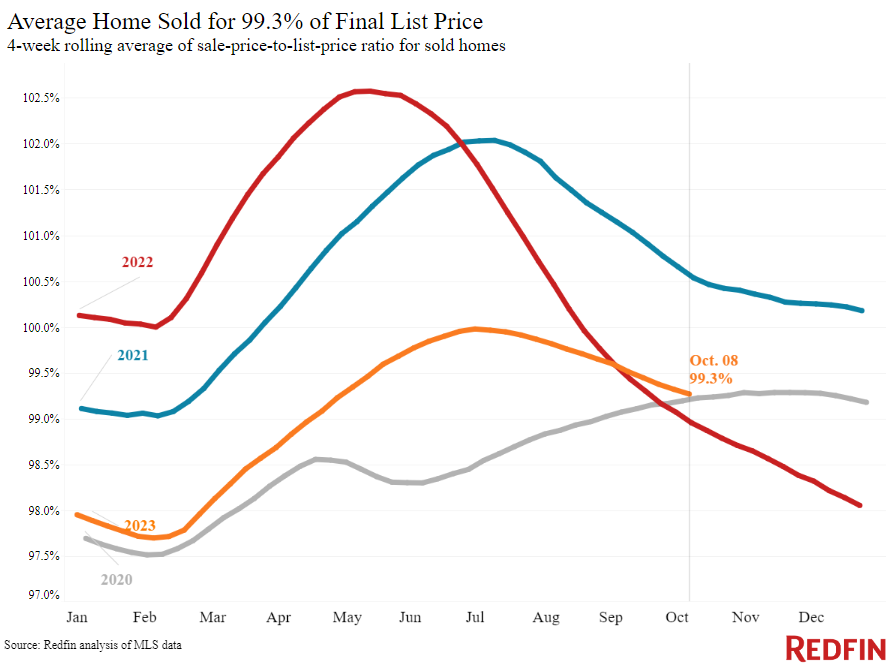
| Average sale-to-list price ratio | 99.3% | +0.3 pts. | |
| Metro-level highlights: Four weeks ending October 8, 2023
Redfin’s metro-level data includes the 50 most populous U.S. metros. Select metros may be excluded from time to time to ensure data accuracy. |
|||
| Metros with biggest year-over-year increases | Metros with biggest year-over-year declines | Notes | |
| Median sale price | Anaheim, CA (13.5%)
San Jose, CA (11%) New Brunswick, NJ (10.5%) Providence, RI (10.2%) West Palm Beach, FL (9.9%) |
Austin, TX (-4.1%)
San Antonio, TX (-2.5%) Houston, TX (-2.1%) Las Vegas (-0.9%) Dallas, TX (-0.6%) Fort Worth, TX (-0.5%) Phoenix (-0.4%) New York, NY (-0.4%) Portland, OR (-0.4%) |
Declined in 9 metros (in 6 of those metros, the decline was smaller that 1%) |
| Pending sales | West Palm Beach, FL (7.7%)
Orlando, FL (5.5%) San Jose, CA (4.3%) |
New Brunswick, NY (-32.9%)
New York (-32.9%) Portland, OR (-24.6%) Atlanta (-20.8%) Providence, RI (-20.7%) |
Declined in all but 3 metros |
| New listings | West Palm Beach, FL (17%)
Orlando, FL (16%) Miami, FL (14.8%) Jacksonville, FL (11.3%) Fort Lauderdale, FL (10.2%) |
Atlanta (-26.9%)
Anaheim, CA (-14.5%) Portland, OR (-13.5%) Newark, NJ (-13,4%) Seattle (-12.8%) |
Declined in all but 10 metros. 5 biggest increases all in Florida. |
Refer to our metrics definition page for explanations of all the metrics used in this report.