Asking prices and pending sales flatten, largely following an expected seasonal pattern, suggesting that homebuyer demand and sale prices may be peaking.
Key housing market takeaways for 400+ U.S. metro areas during the 4-week period ending April 4:
Note: Year-over-year comparisons in this report are more a reflection of the fact that this time last year stay-at-home-orders halted both home-buying and selling activity than of how the housing market has changed over the past year.
- The median home-sale price increased 17% year over year to $338,225, an all-time high.
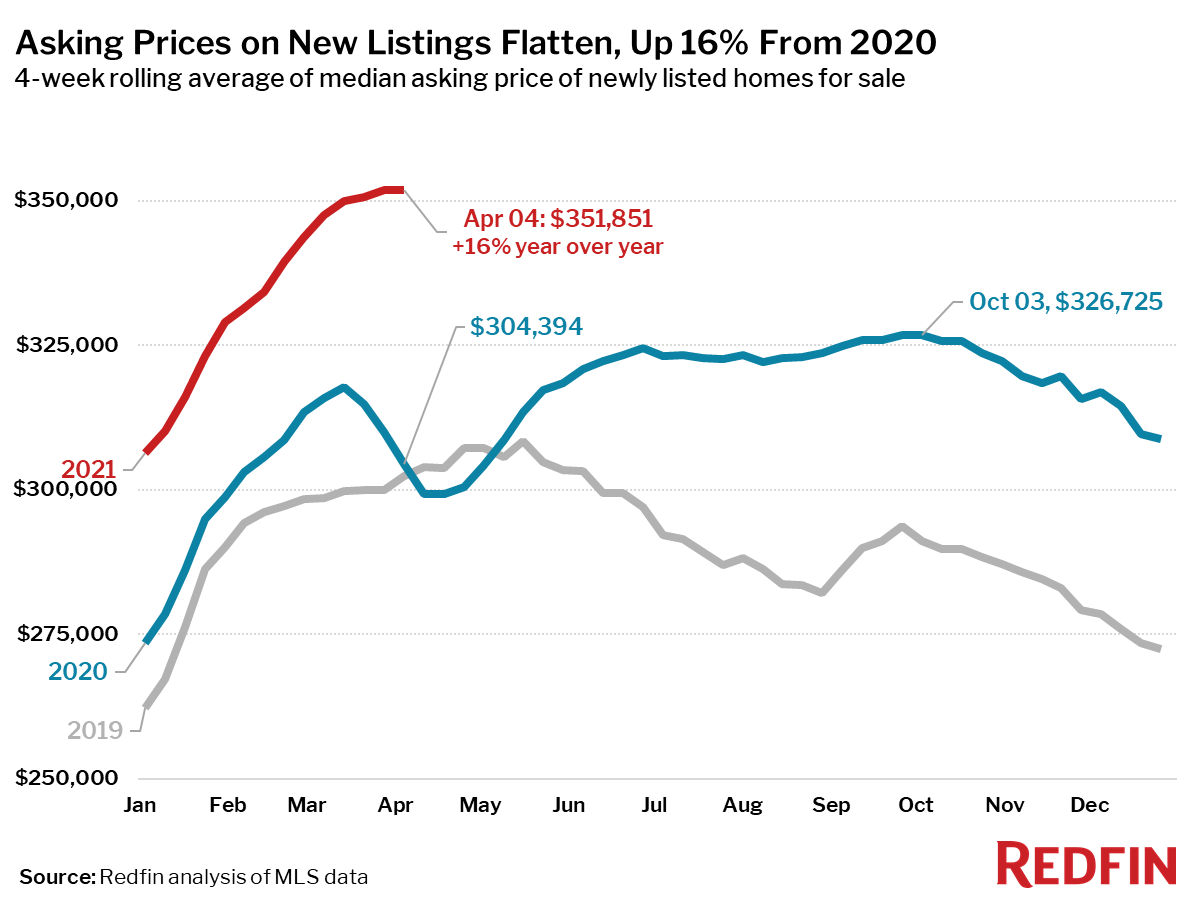
- Asking prices of newly listed homes rose 16% year over year to $351,851, an all-time high, but were flat from the four-week period ending March 28. During the same period in 2019, asking prices rose 0.8%.
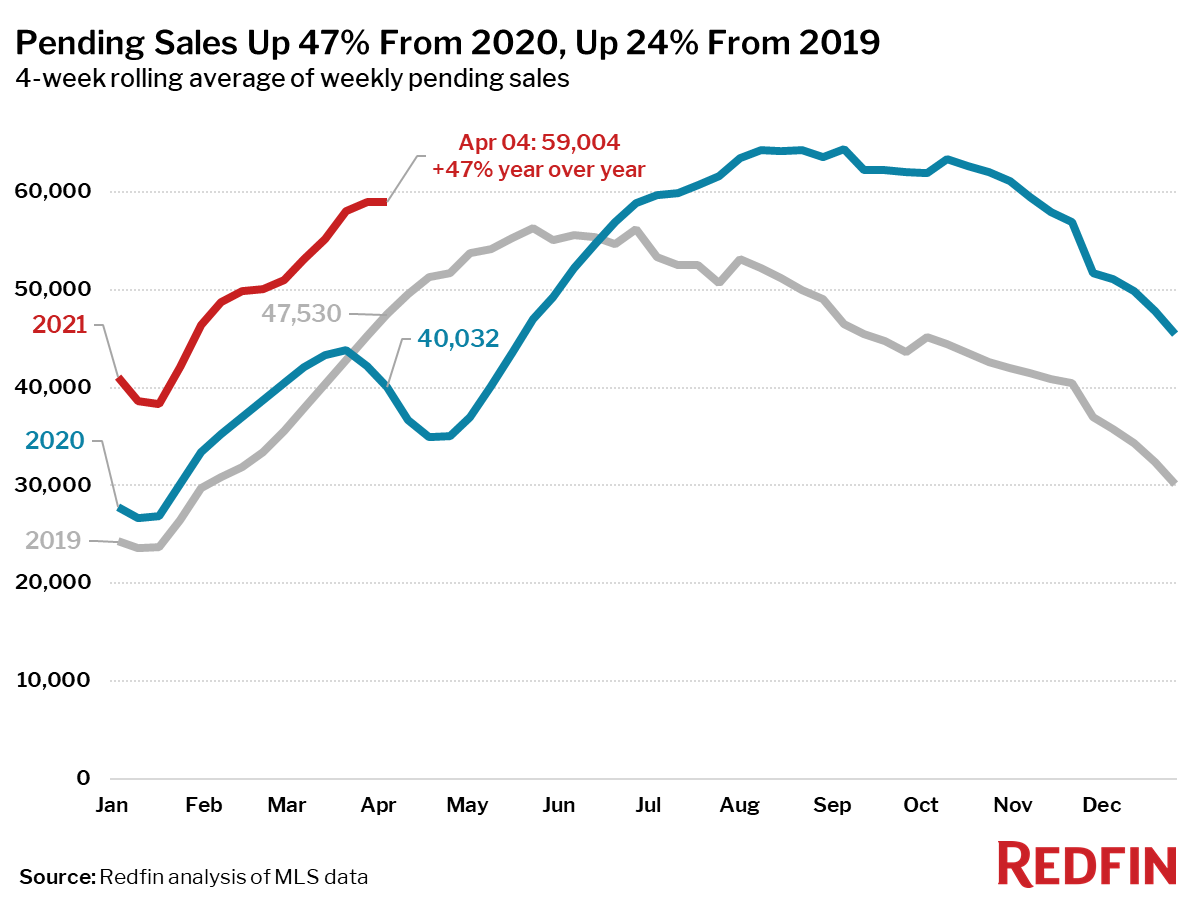
- Pending home sales were up 47% from the same period in 2020, and up 24% from the same period 2019, which was a more typical year for the housing market. Pending sales were essentially flat from the four-week period ending March 28, posting a 0.1% increase, the smallest since the four-week period ending January 17. Between the same periods in 2019, pending sales rose 5%.
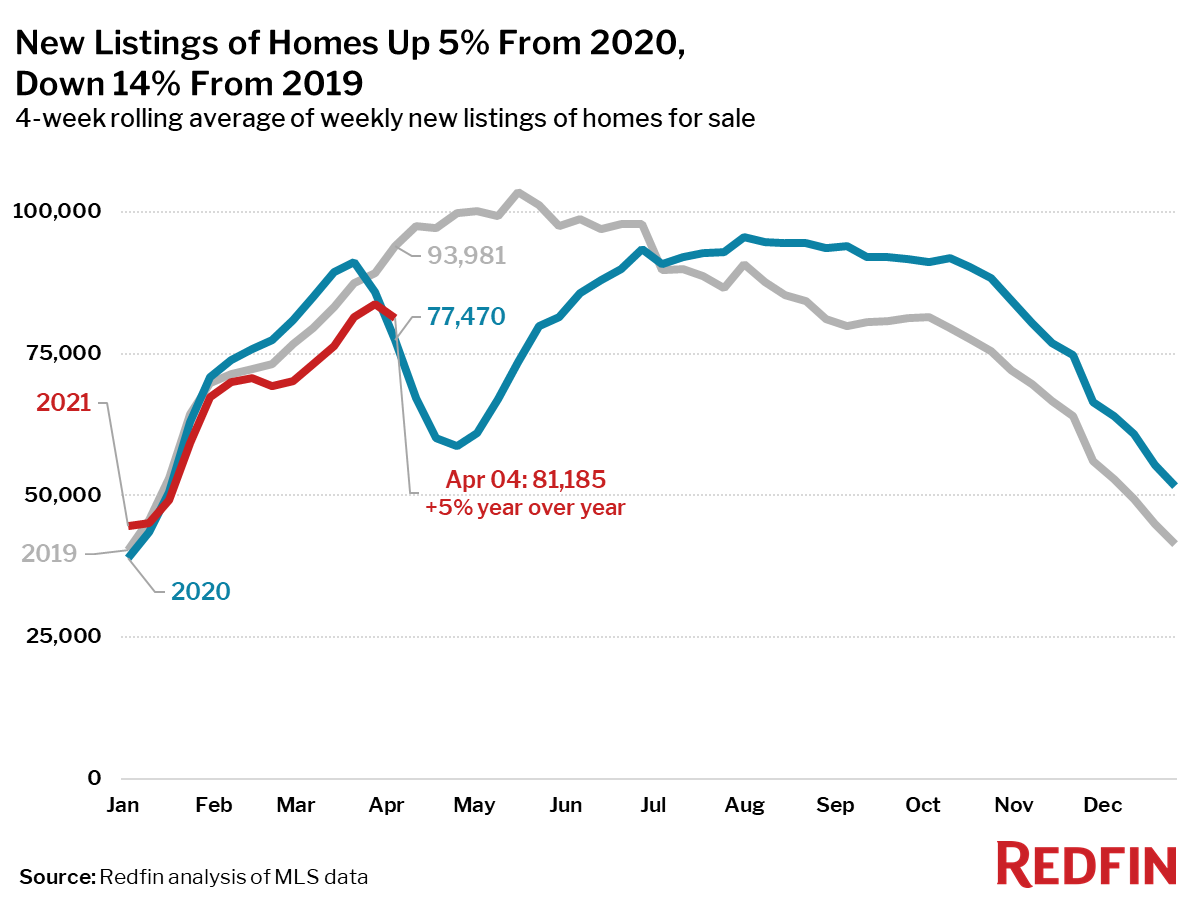
- New listings of homes for sale were up 5% from the same period in 2020, and down 14% from the same period in 2019.
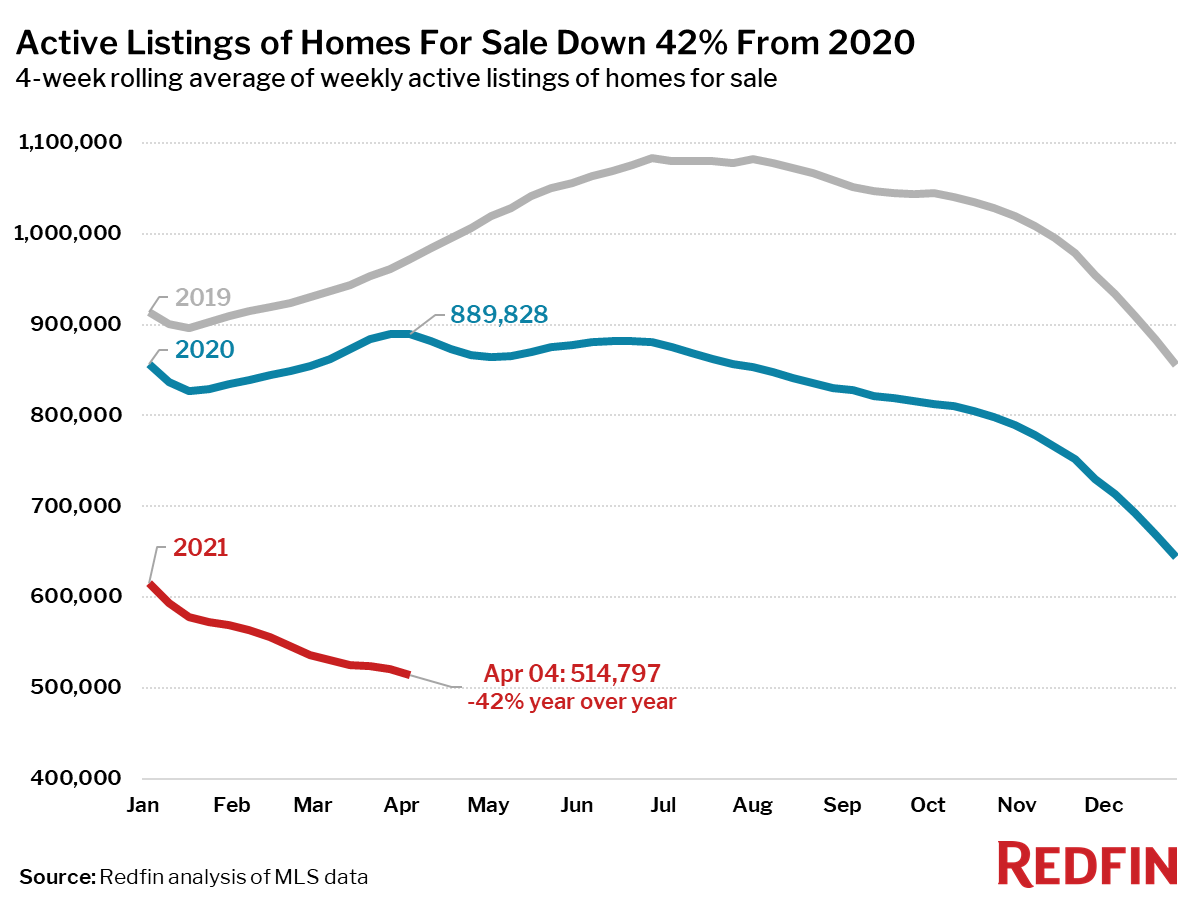
- Active listings (the number of homes listed for sale at any point during the period) fell 42% from the same period in 2020 to a new all-time low. This is the largest decrease on record in this data, which goes back through 2016.
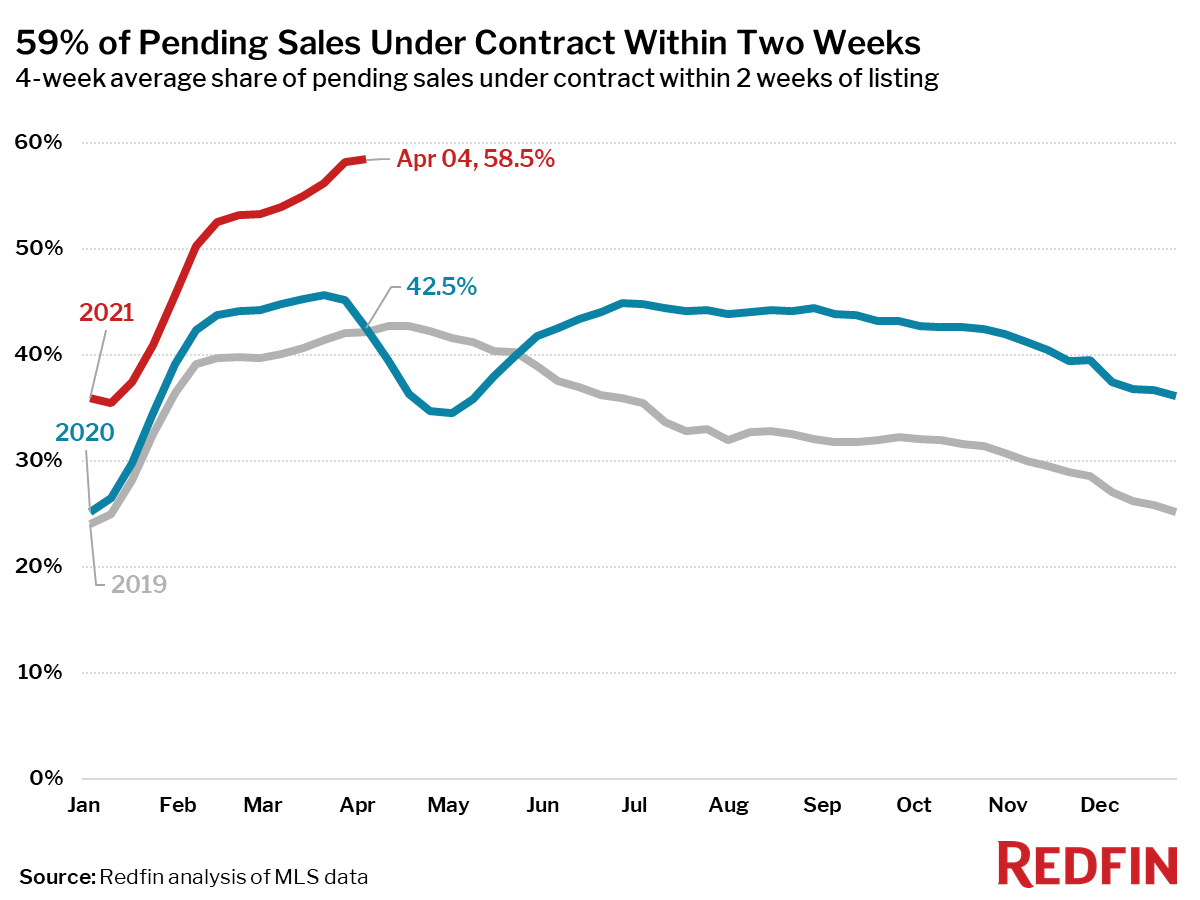
- 59% of homes that went under contract had an accepted offer within the first two weeks on the market. This is a new all-time high for this measure since at least 2012 (as far back as Redfin’s data for this measure goes). During the 7-day period ending April 4, 58% of homes sold in two weeks or less.
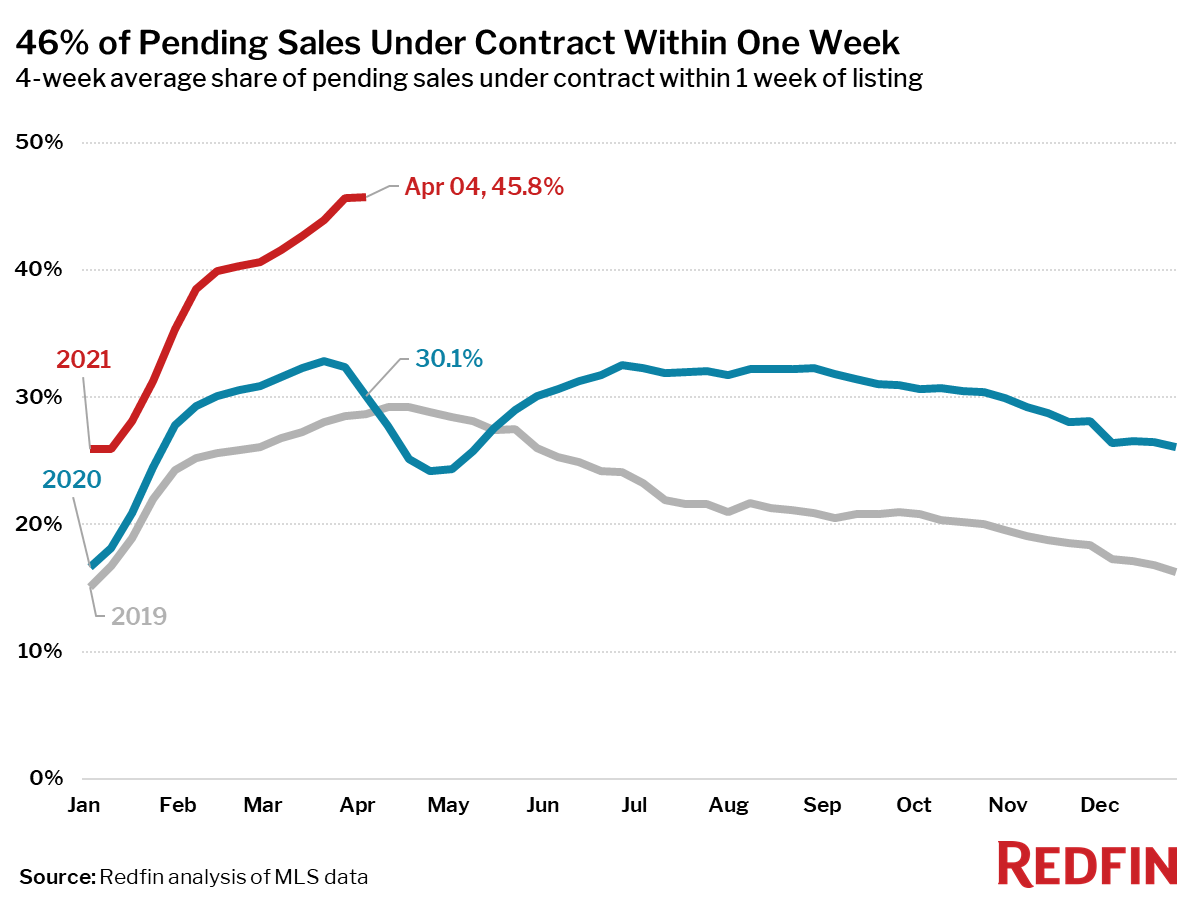
- 46% of homes that went under contract had an accepted offer within one week of hitting the market, an all-time high and up from 30% during the same period a year earlier.
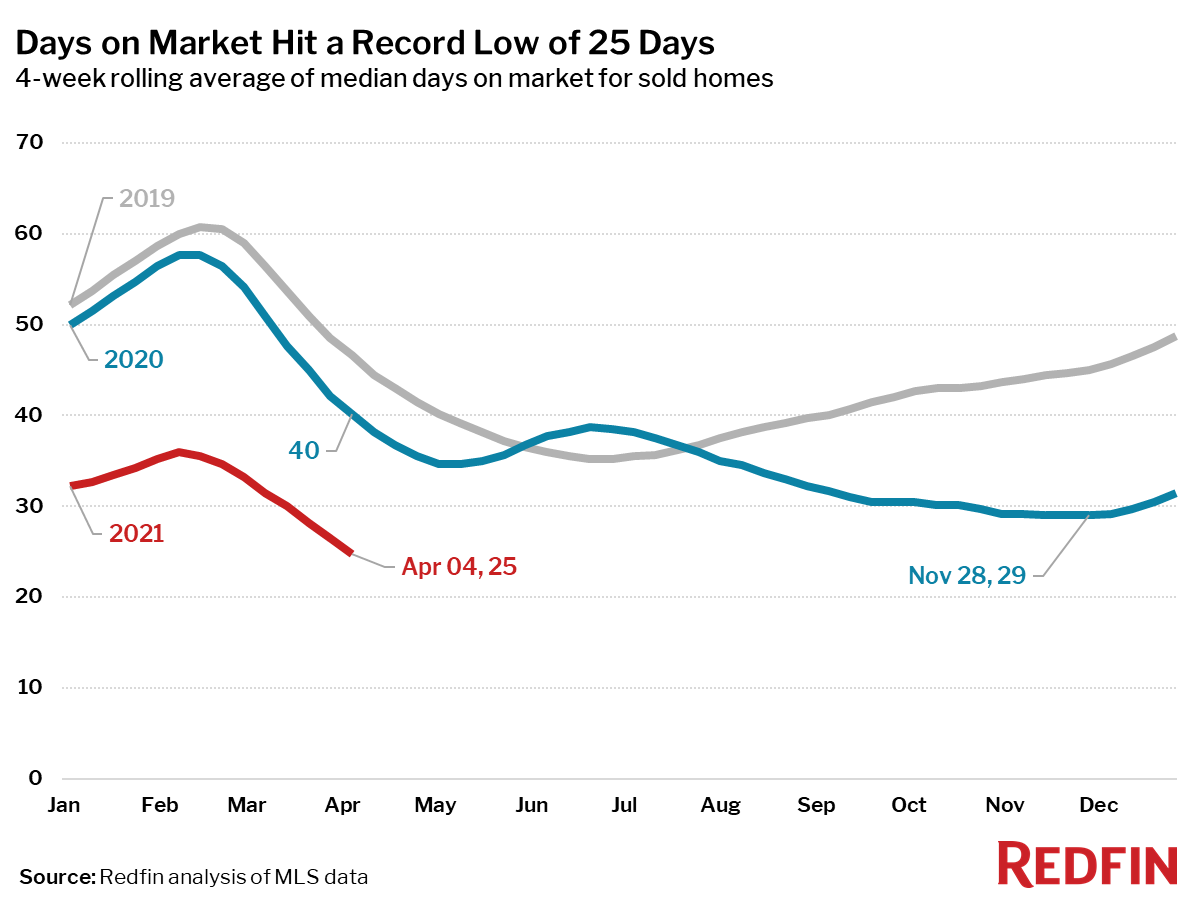
- Homes that sold during the period were on the market for a median of 25 days, the lowest time on market on record since 2012. This was 15 days less than the same period in 2020, and 22 days less than the same period in 2019.
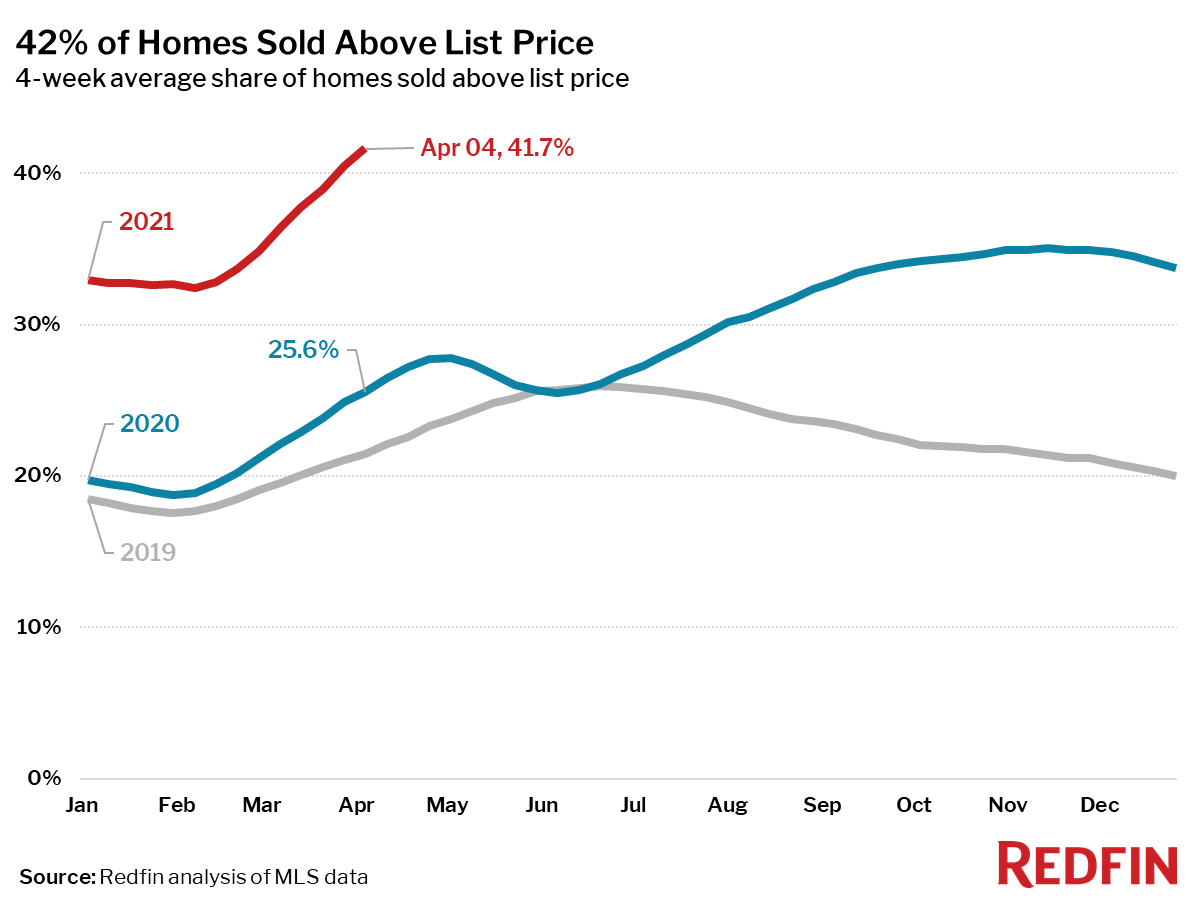
- 42% of homes sold for more than their list price, an all-time high. This was 16 percentage points higher than the same period a year earlier, and 20 points higher than the same period in 2019.
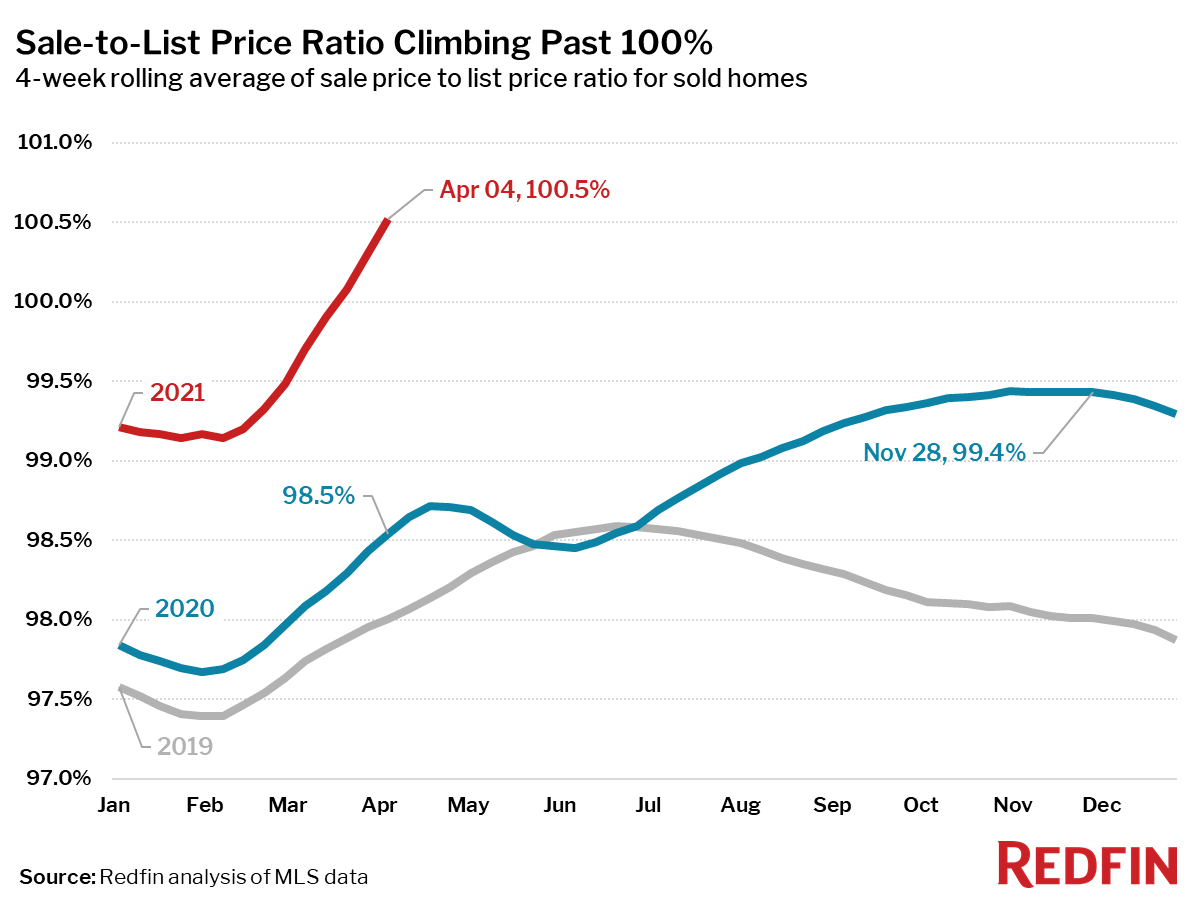
- The average sale-to-list price ratio, which measures how close homes are selling to their asking prices, increased to 100.5%, an all-time high and 2 percentage points higher than a year earlier.
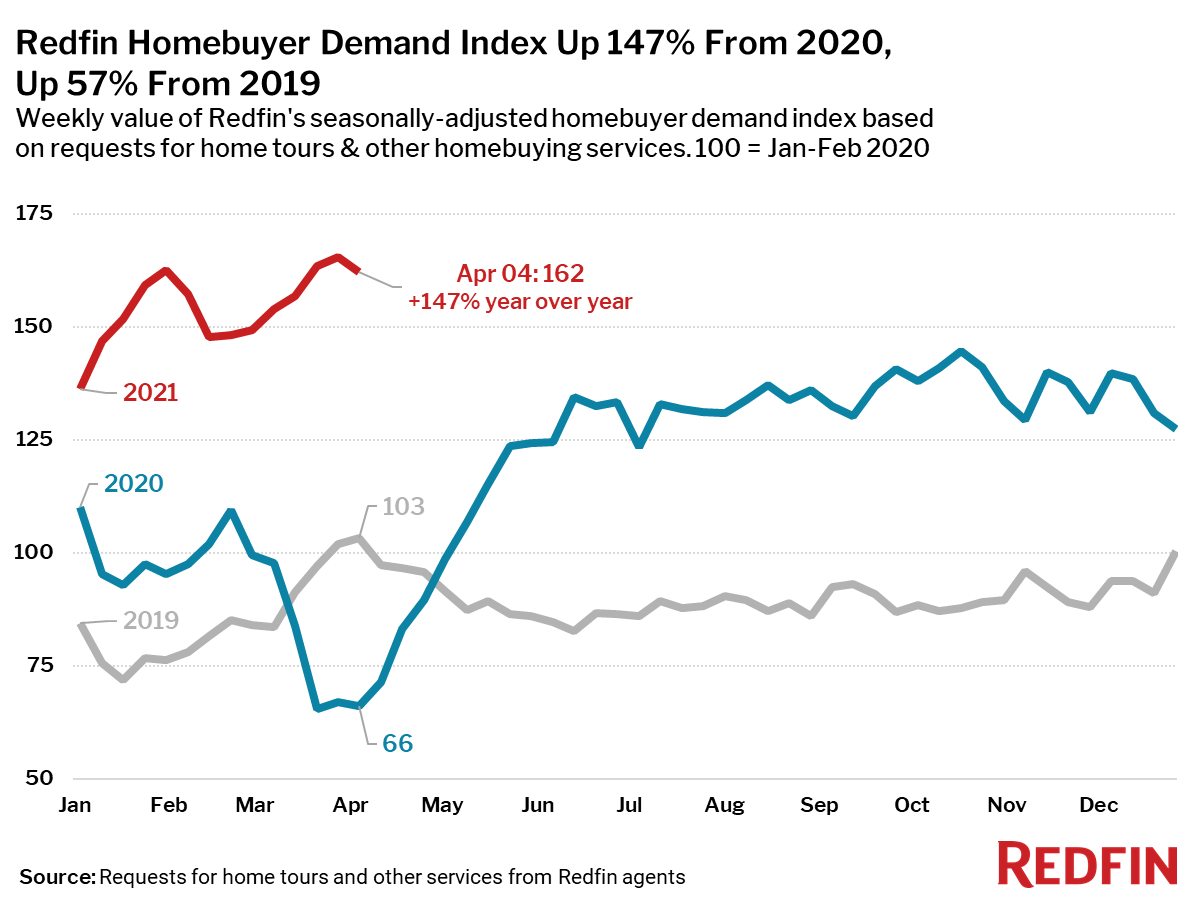
- For the 7-day period ending April 4, the seasonally adjusted Redfin Homebuyer Demand Index—a measure of requests for home tours and other services from Redfin agents—was up 147% from the same period a year ago, when housing demand was near the lowest point it would hit during the pandemic. Compared with the same one week period in 2019, demand is up 57%. Week-over-week, demand was down 2.1%, compared to a 1.3% increase during the same period in 2019.
- Mortgage purchase applications decreased 5% week over week (seasonally adjusted) and were up 51% from a year earlier (unadjusted) during the week ending April 2. For the week ending April 8, 30-year mortgage rates decreased slightly to 3.13%.
“The housing market is more competitive than we’ve ever seen it, but a couple indicators are causing us to ask whether we’re nearing a peak in terms of how fast demand and prices can grow,” said Redfin Chief Economist Daryl Fairweather. “Sellers’ asking prices may be starting to flatten in what so far appears to follow a typical seasonal pattern. And the drop in mortgage purchase applications tells me that some buyers are dropping out due to the lack of affordable homes for sale. If these trends continue we can feel more assured that we are not in the midst of runaway home price speculation or a housing bubble.”
Refer to our metrics definition page for explanations of all the metrics used in this report.