Measures of homebuying competition are plateauing as early-stage demand posts its biggest annual decline since April 2020. However, mortgage rates may have leveled off, which could prevent demand from dropping even further.
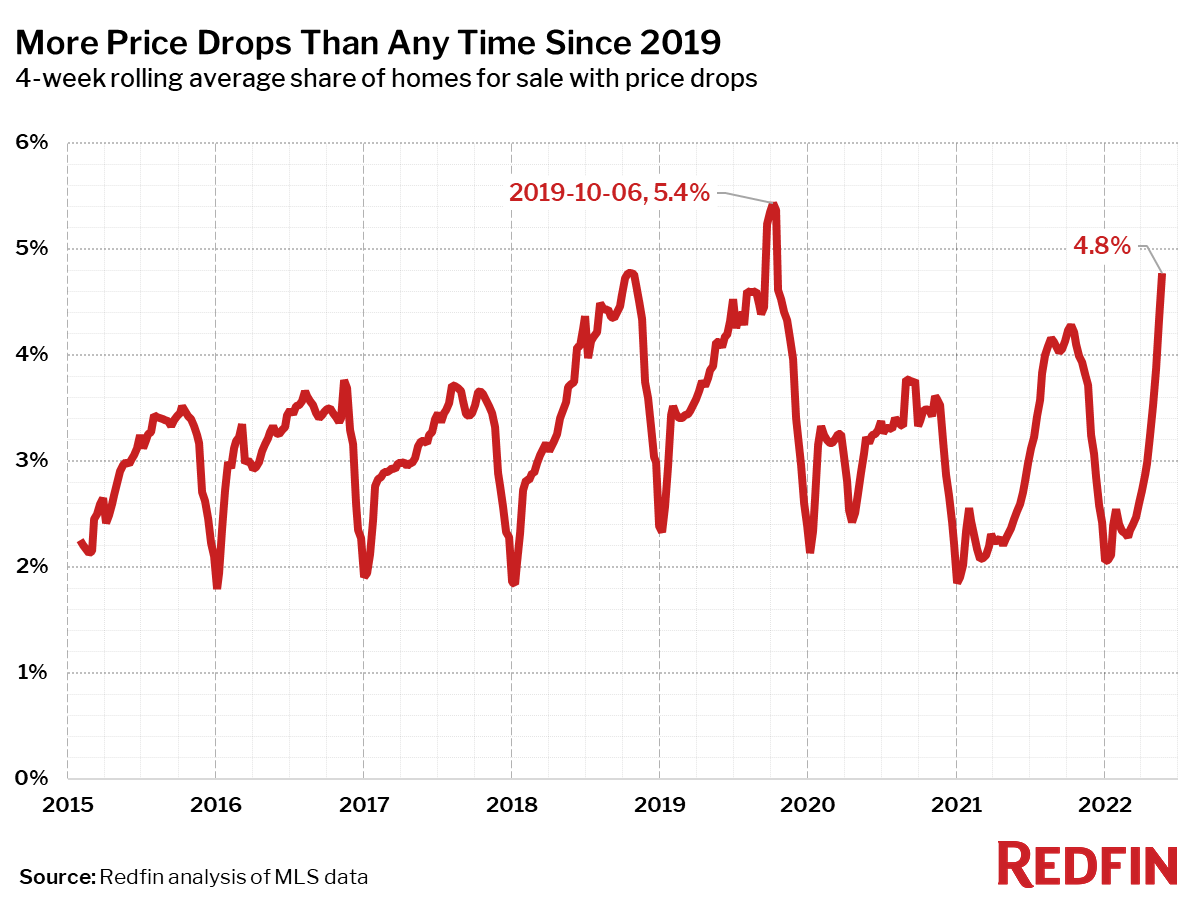
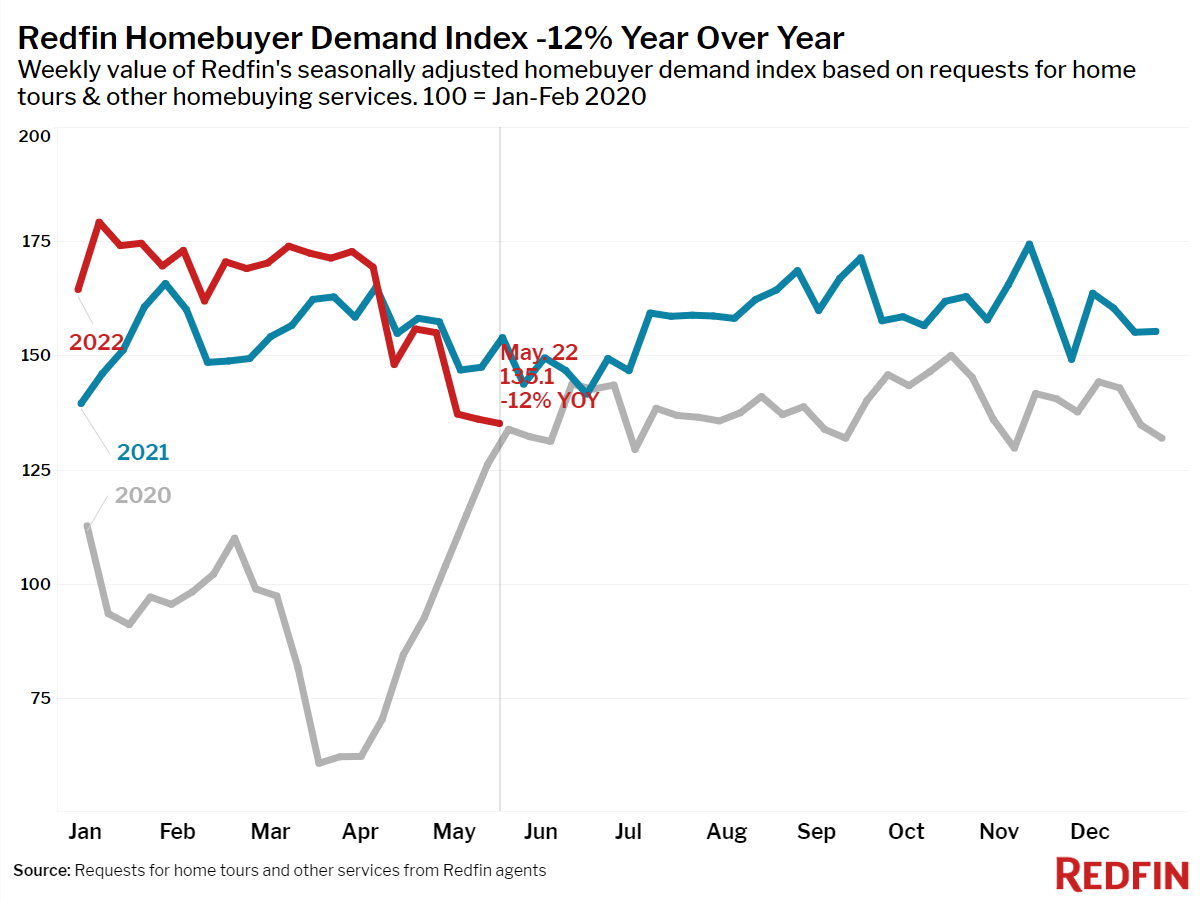
The housing market is sending clearer signals that the pandemic-driven housing frenzy is coming to an end. Nearly one in five (19.1%) home sellers dropped their price during the four week period ending May 22—the highest level since October 2019. Measures of competition including the typical listing’s time on market, the share of homes pending sale within one week and the share of homes sold above list price have all plateaued. Mortgage-purchase applications were at a level on par with June 2020, and the number of homebuyers touring and offering on homes, as measured by the Redfin Homebuyer Demand Index, posted its largest annual decline since April 2020.
“The picture of a softening housing market is becoming more clear, especially to home sellers who are increasingly turning to price drops as buyers become more cost-conscious under higher mortgage rates,” said Redfin Chief Economist Daryl Fairweather. “For now, mortgage rates have stabilized, and I expect prices to do the same. This will remove some uncertainty for buyers. That means that as long as a home is priced conservatively, it still has a good chance of selling quickly.”
Leading indicators of homebuying activity:
- Fewer people searched for “homes for sale” on Google—searches during the week ending May 21 were down 13% from a year earlier.
- The seasonally-adjusted Redfin Homebuyer Demand Index—a measure of requests for home tours and other home-buying services from Redfin agents—was down 12% year over year during the week ending May 22. This was the largest decline since April 2020 when the pandemic paused most homebuying activity.
- Touring activity from the first week of January through May 22 was 29 percentage points behind the same period in 2021, according to home tour technology company ShowingTime.
- Mortgage purchase applications were down 16% from a year earlier, while the seasonally-adjusted index was flat week over week during the week ending May 20.
- For the week ending May 26, 30-year mortgage rates decreased slightly to 5.1%.
Key housing market takeaways for 400+ U.S. metro areas:
Unless otherwise noted, the data in this report covers the four-week period ending May 22. Redfin’s housing market data goes back through 2012.
Data based on homes listed and/or sold during the period:
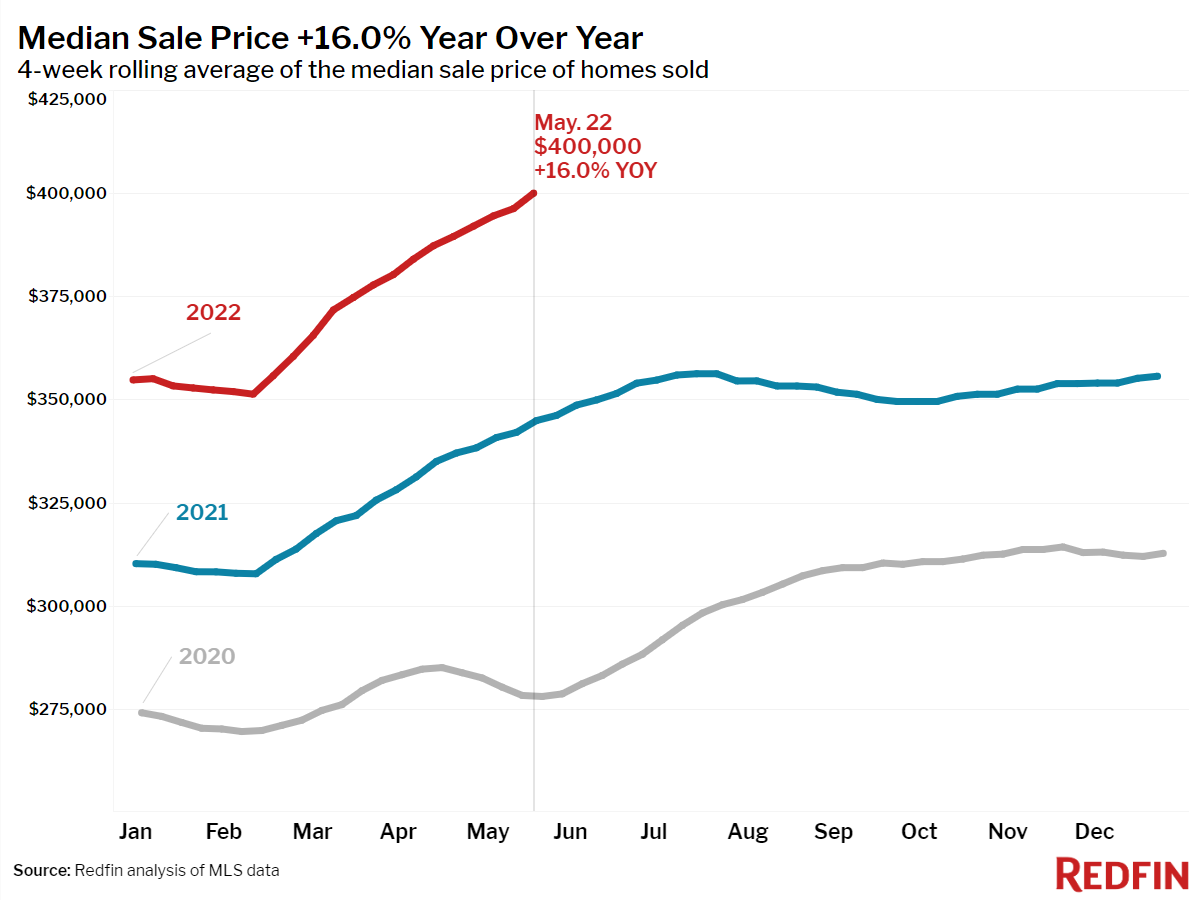
- The median home sale price was up 16% year over year to a record $400,000.
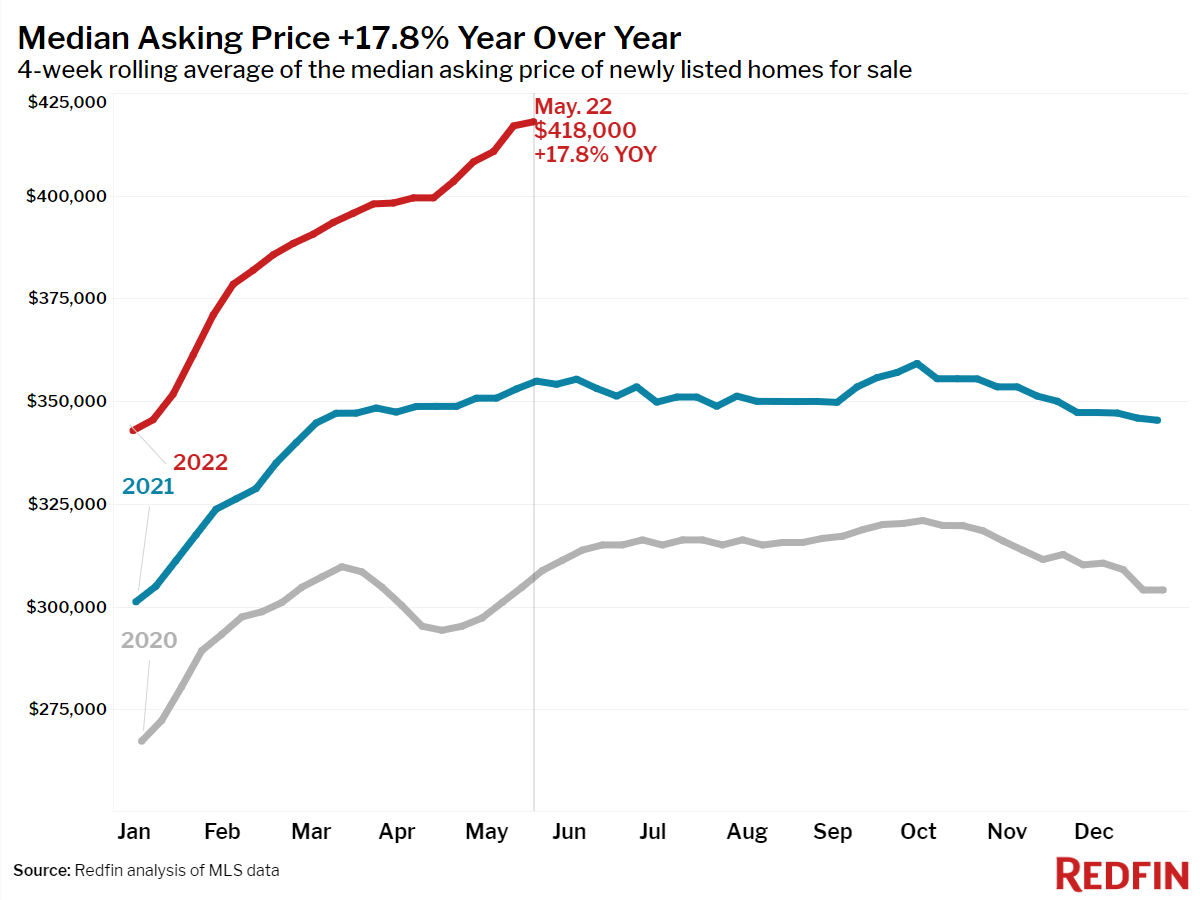
- The median asking price of newly listed homes increased 18% year over year to $418,000, a new all-time high.
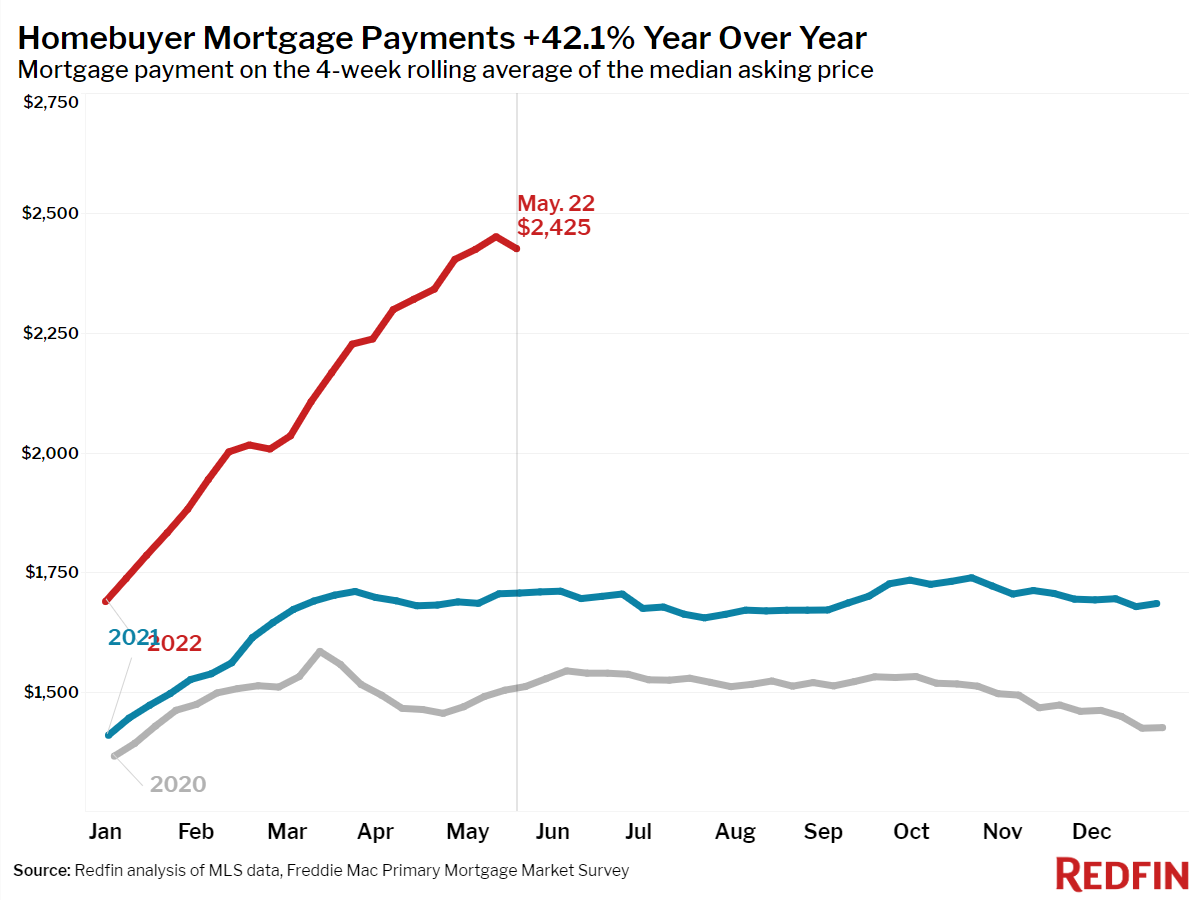
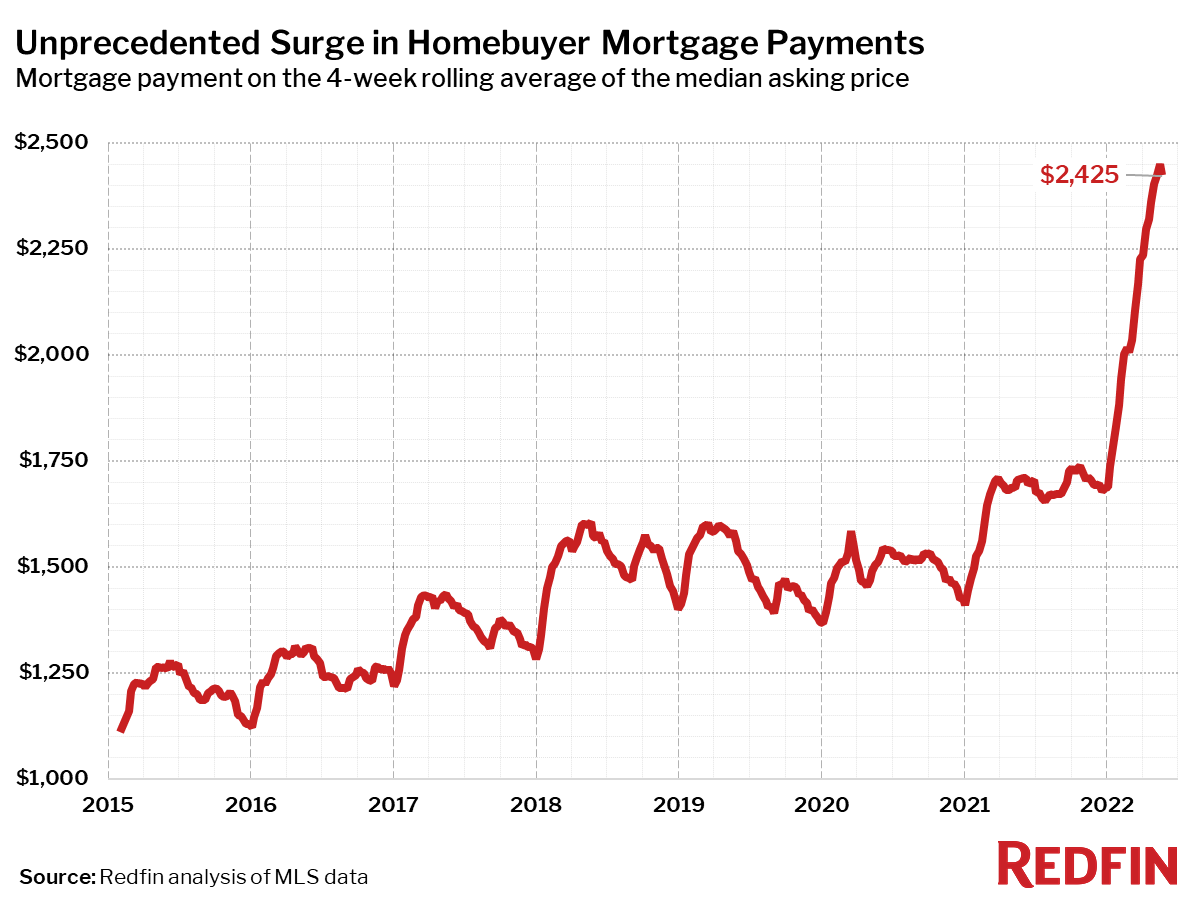
- The monthly mortgage payment on the median asking price home declined slightly from a record high to $2,425 at the current 5.1% mortgage rate. This was up 42% from $1,708 a year earlier, when mortgage rates were 2.95%.
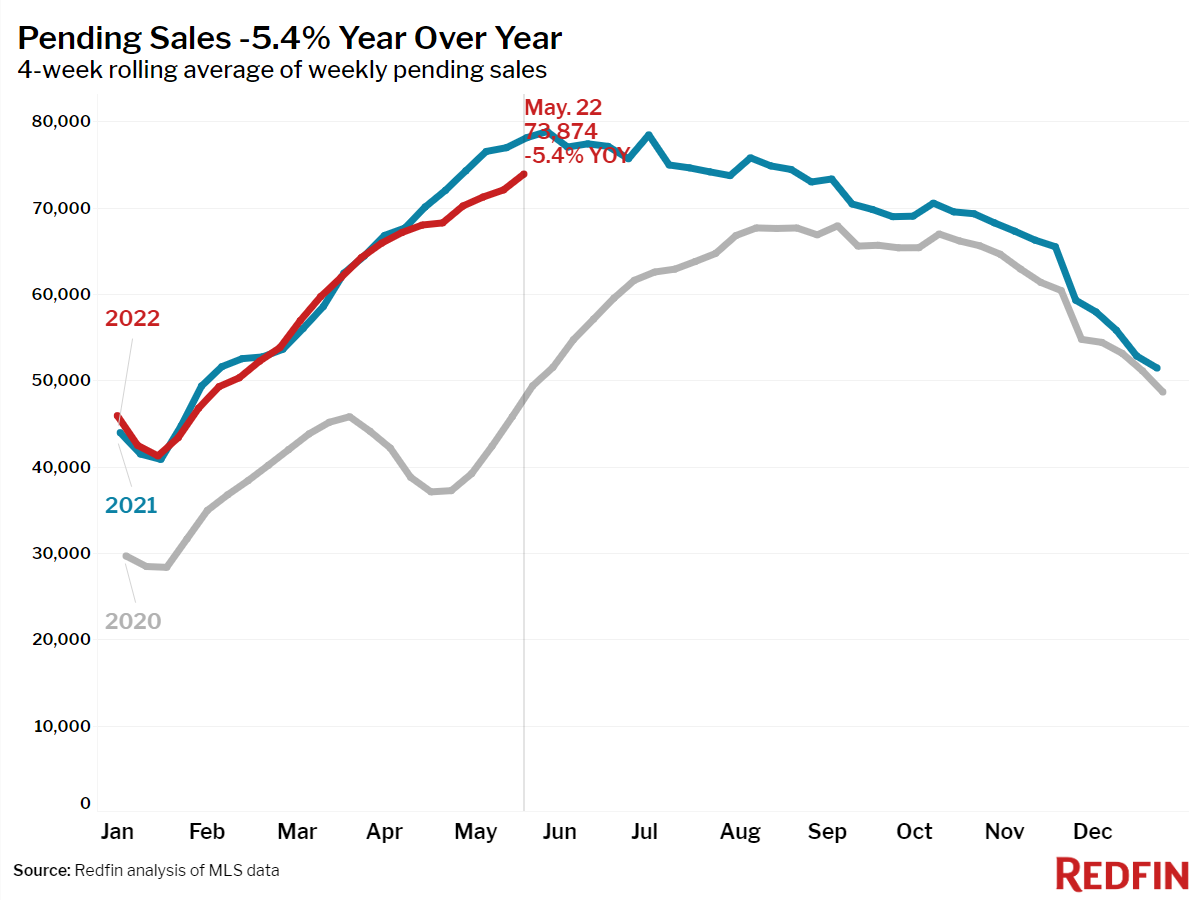
- Pending home sales were down 5.4% year over year.
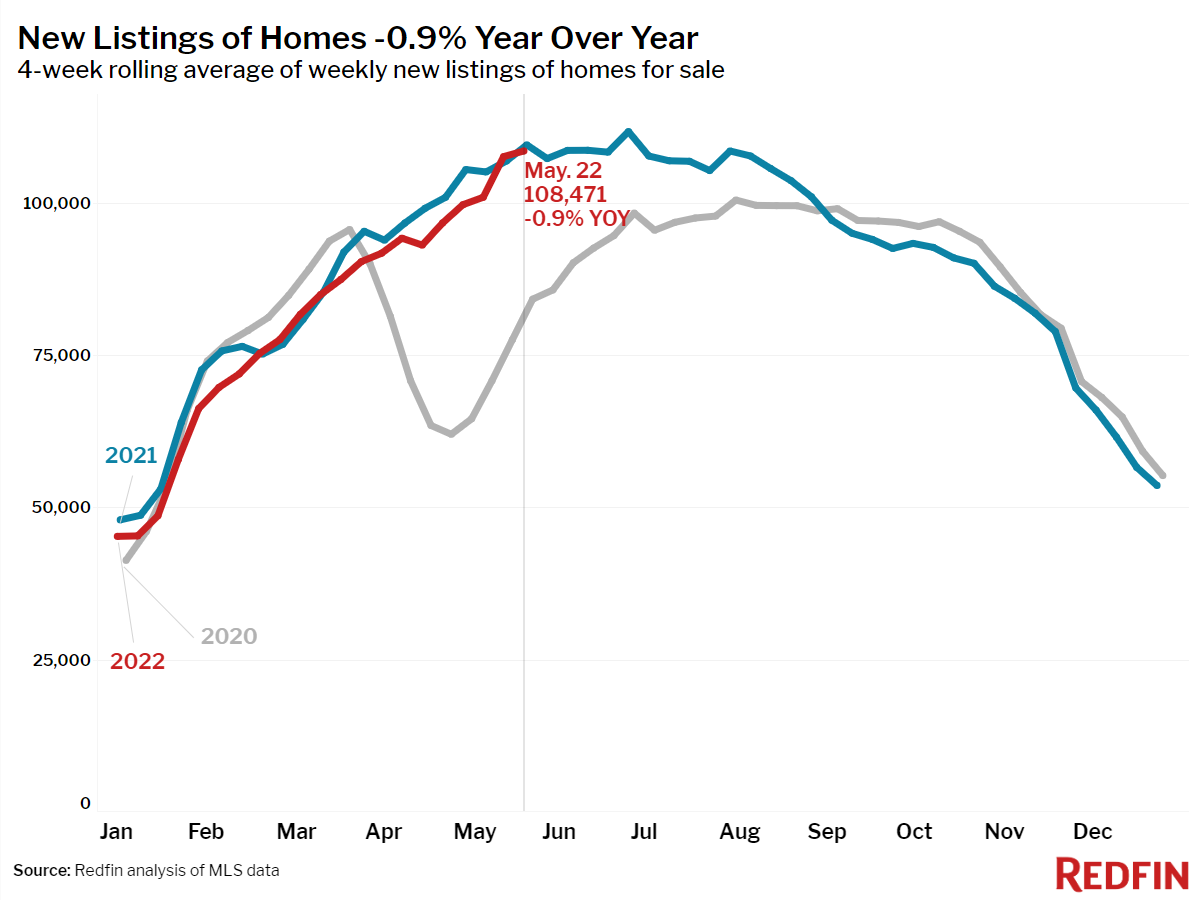
- New listings of homes for sale were down 0.9% from a year earlier.
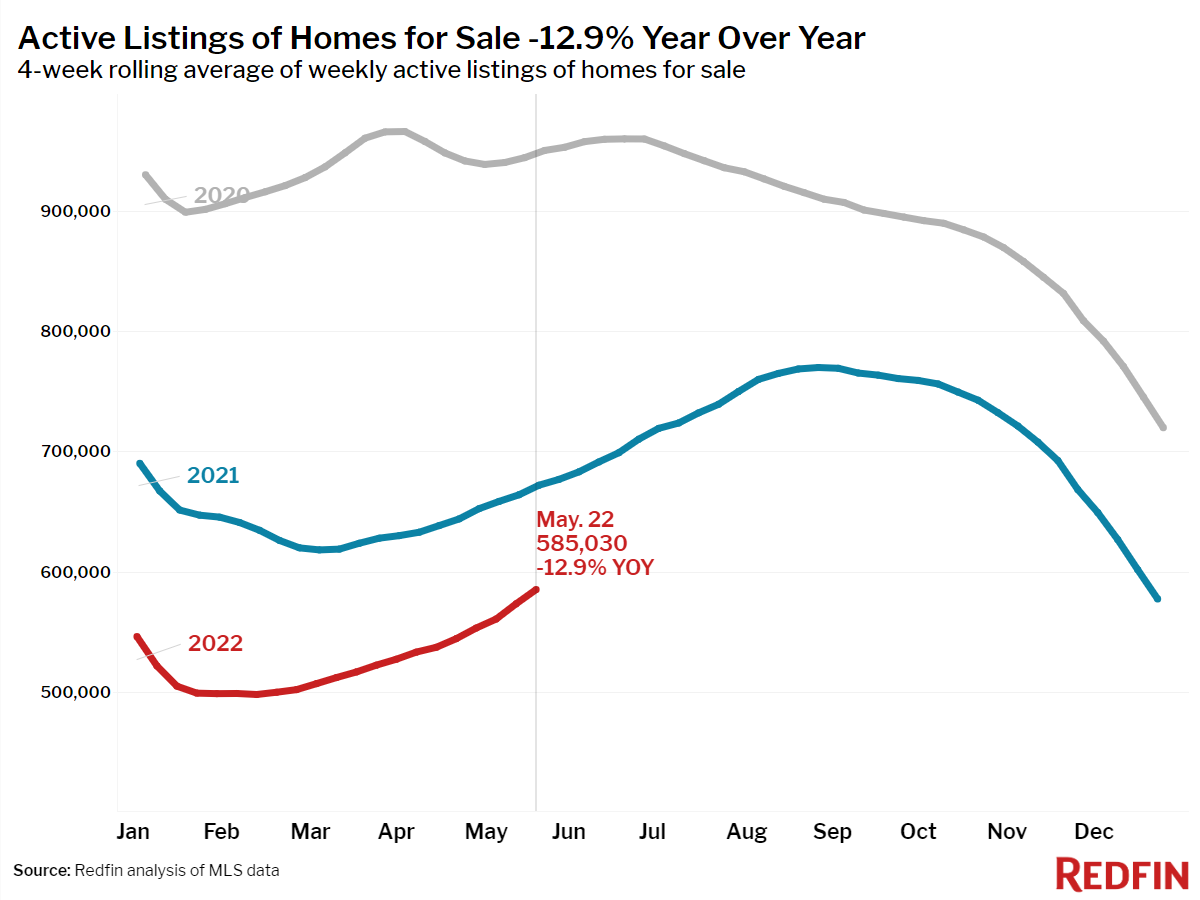
- Active listings (the number of homes listed for sale at any point during the period) fell 13% year over year—the smallest decline since April 2020.
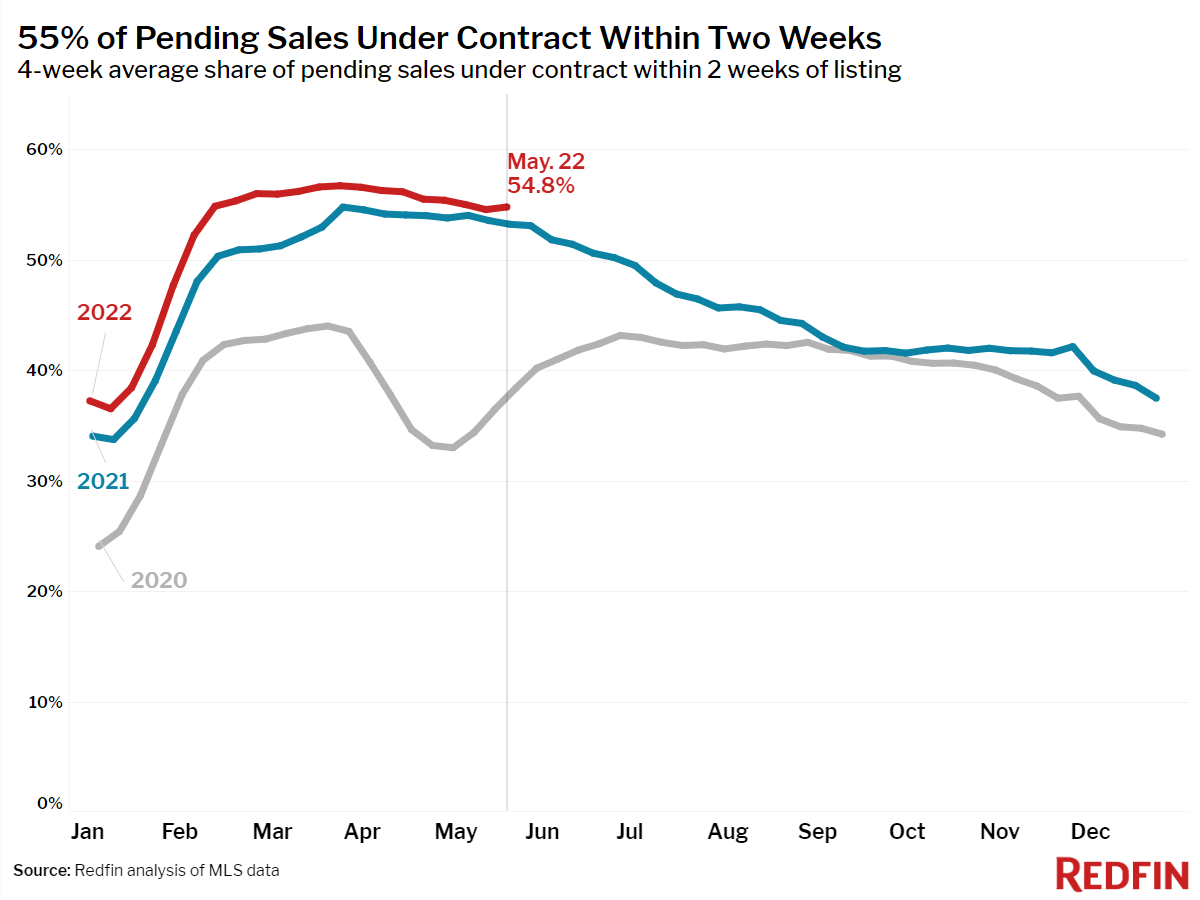
- 55% of homes that went under contract had an accepted offer within the first two weeks on the market, up from 53% a year earlier.
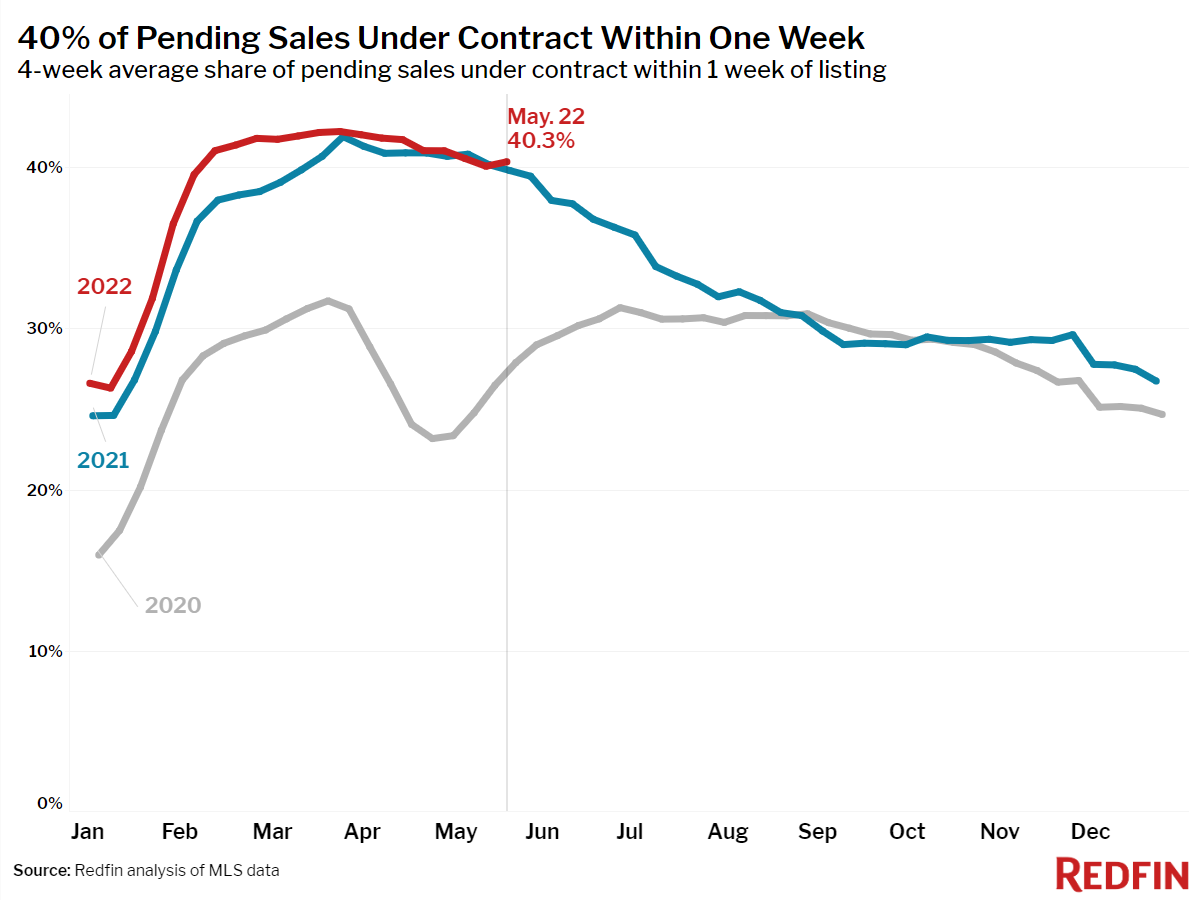
- 40% of homes that went under contract had an accepted offer within one week of hitting the market, flat from a year earlier.
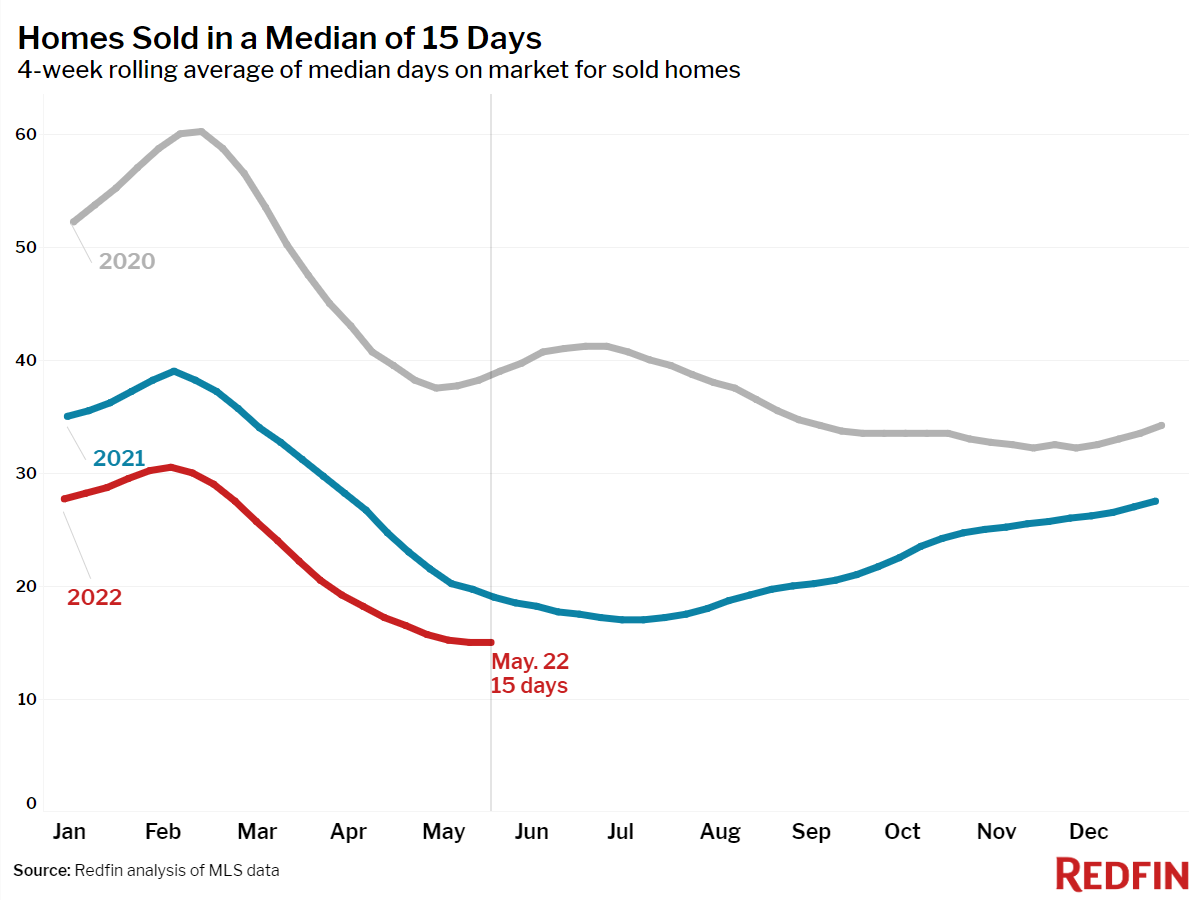
- Homes that sold were on the market for a record-low median of 15 days, down from 19 days a year earlier.
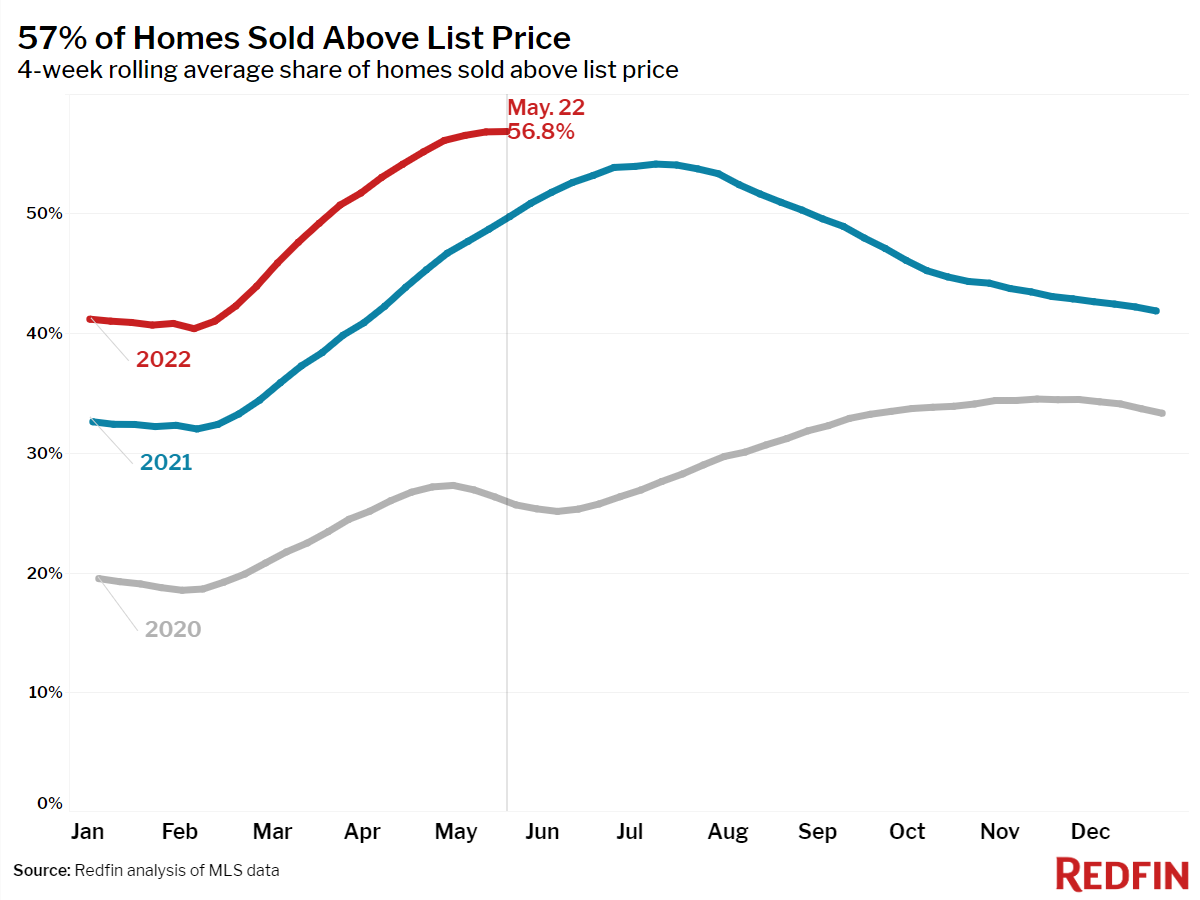
- A record 57% of homes sold above list price, up from 50% a year earlier.
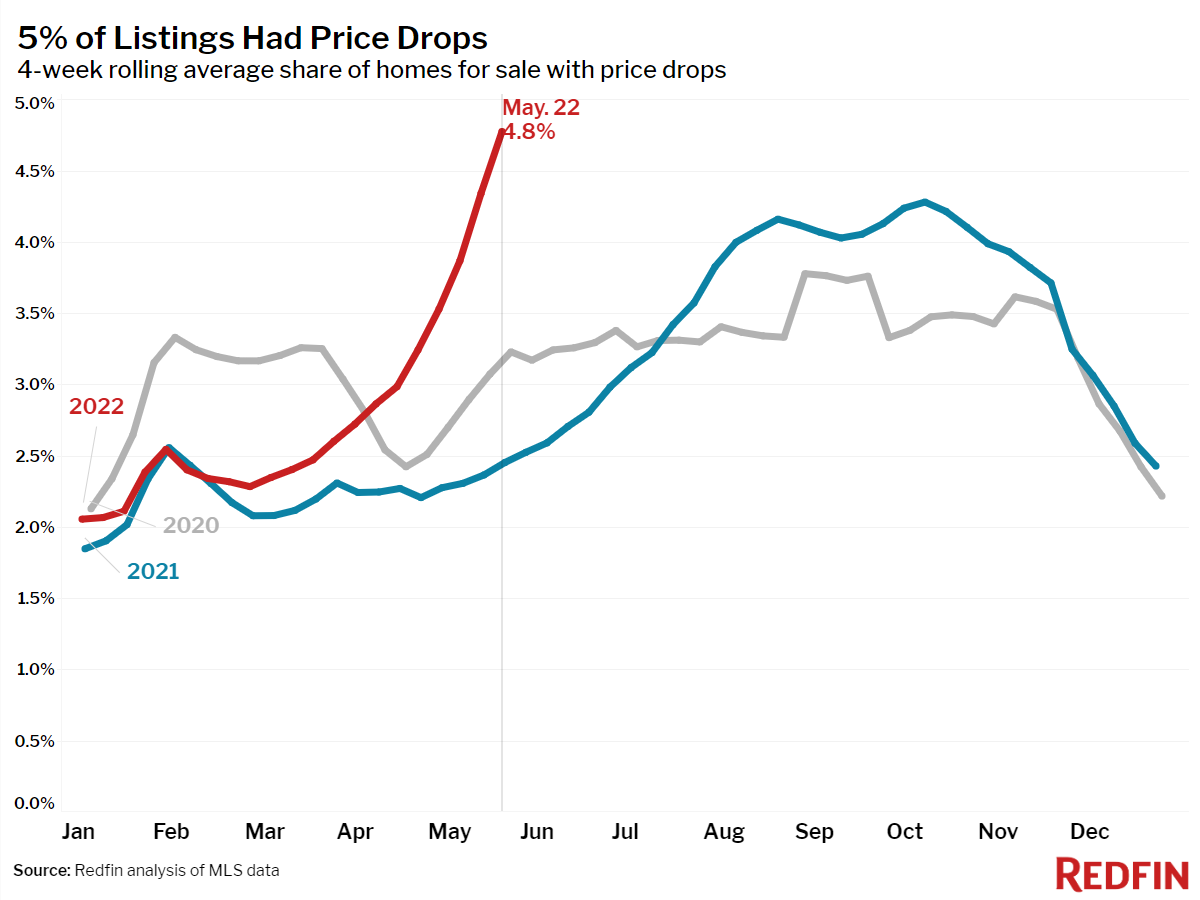
- On average, 4.8% of homes for sale each week had a price drop. Overall, 19.1% dropped their price in the past four weeks, up from 13.0% a month earlier and 9.8% a year ago. This was the highest share since October 2019.
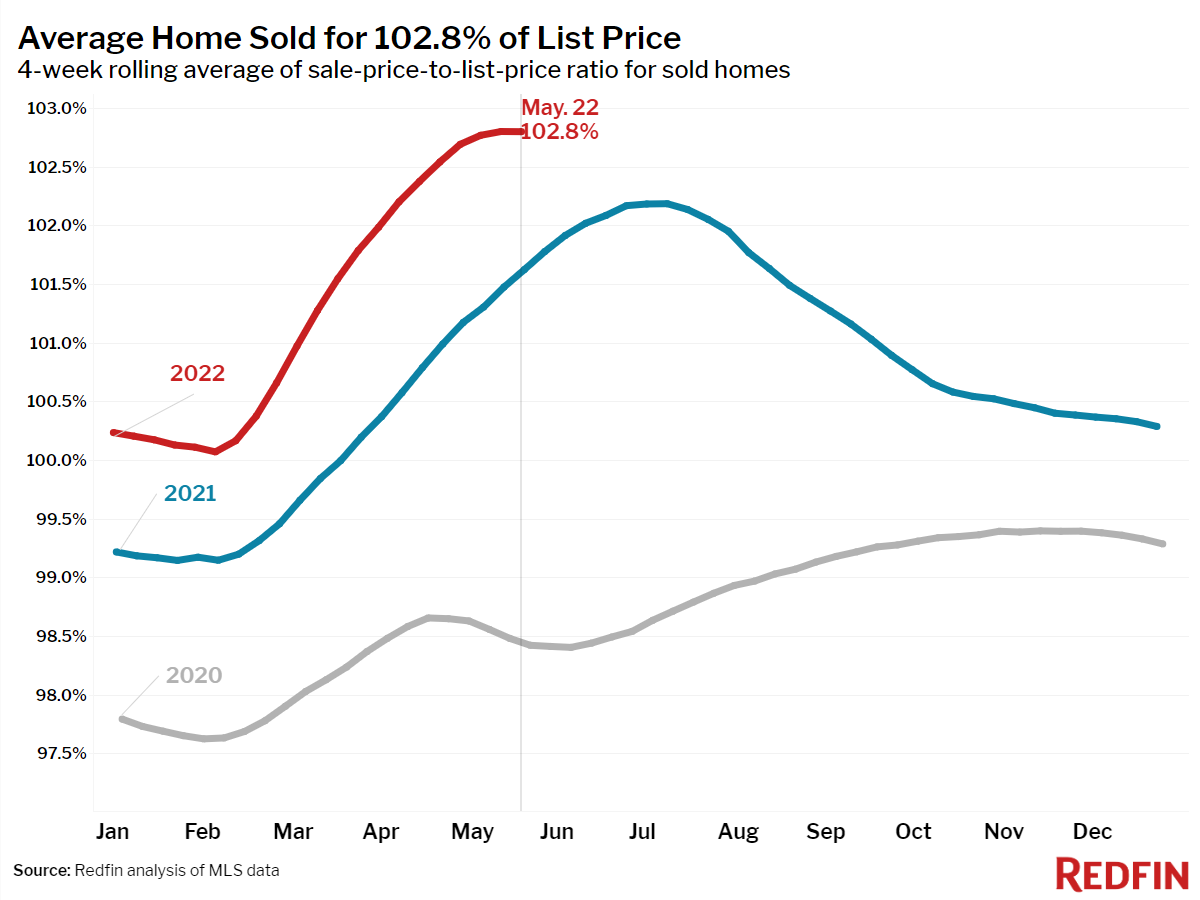
- The average sale-to-list price ratio, which measures how close homes are selling to their asking prices, was flat at an all-time high of 102.8%. In other words, the average home sold for 2.8% above its asking price. This was up from 101.6% a year earlier.
Refer to our metrics definition page for explanations of all the metrics used in this report.