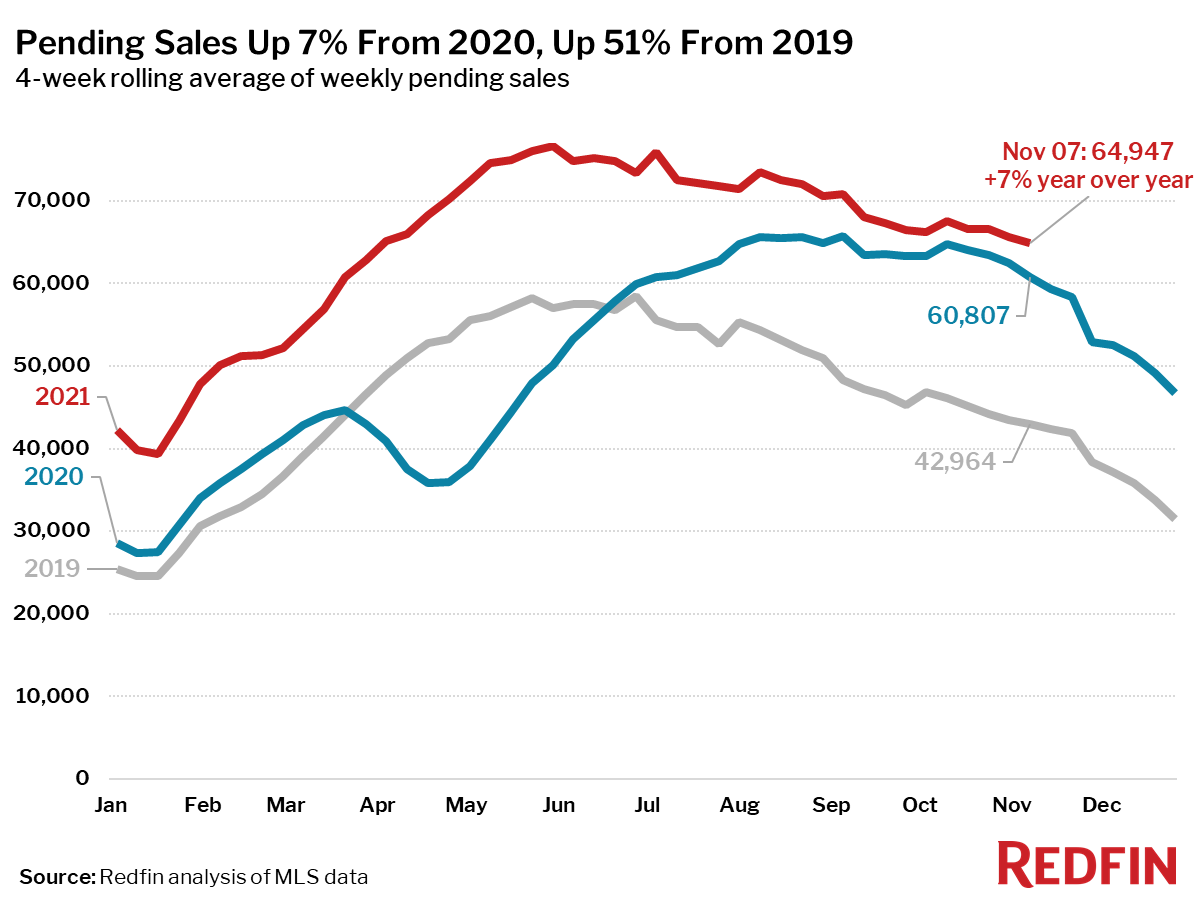
Pending sales were 51% above 2019 levels, the largest 2-year increase since February.
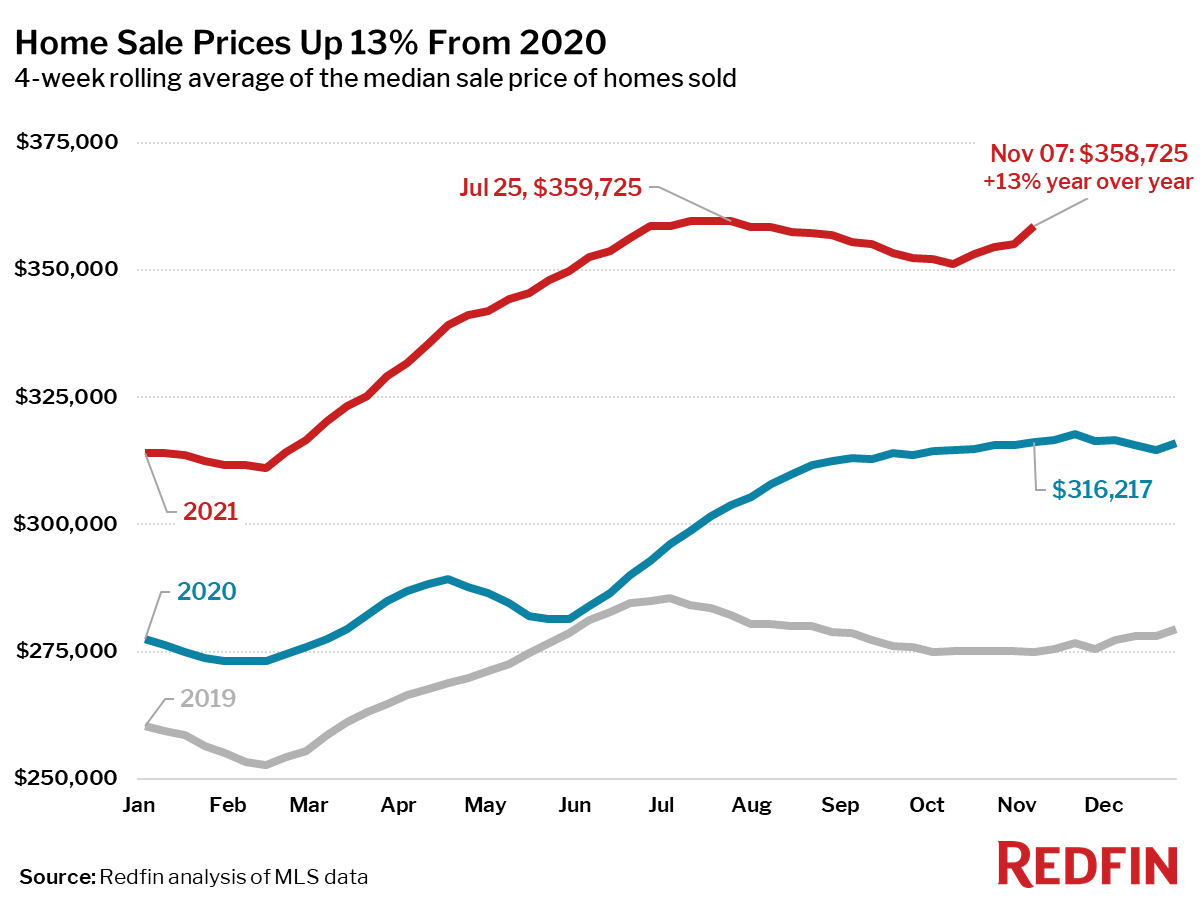
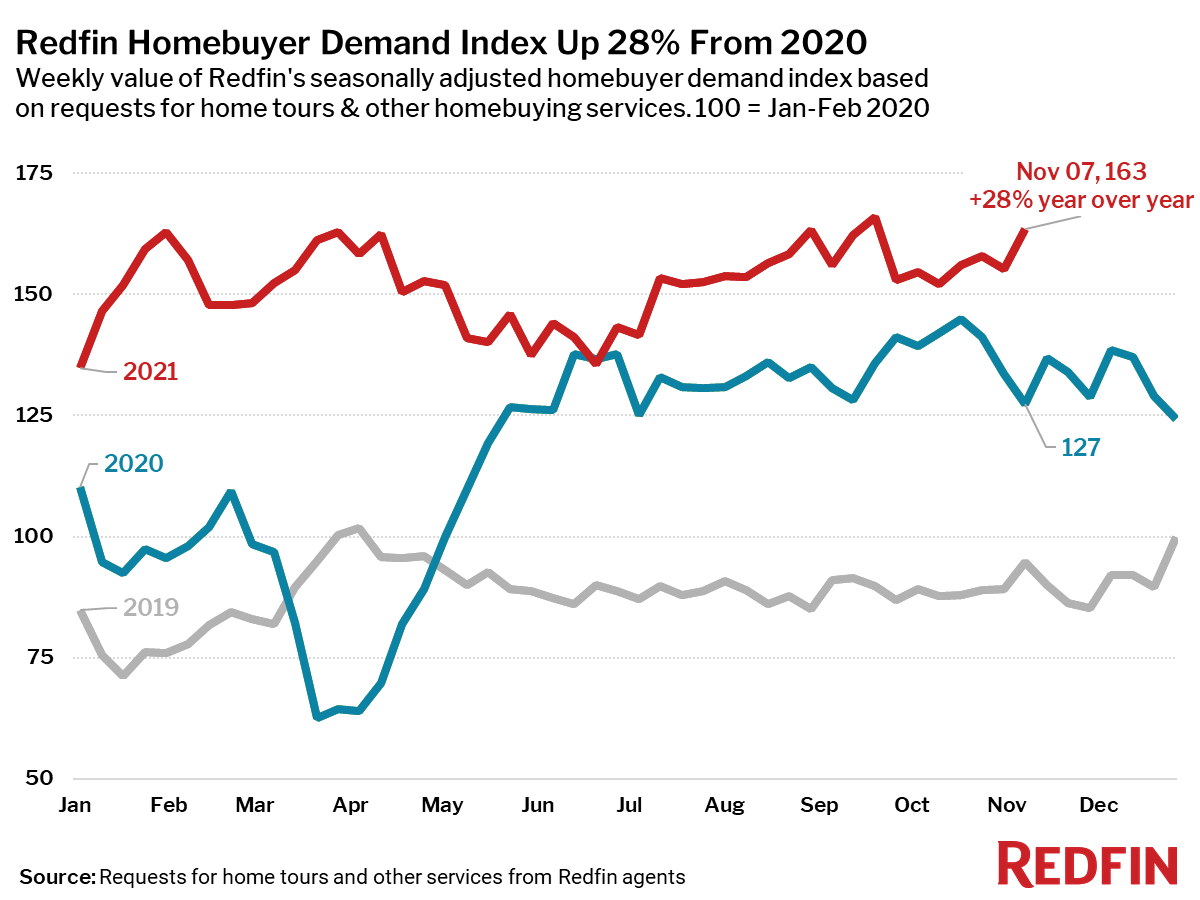
The median home sale price rose 2.2% from a month earlier during a time of year when prices typically flatten. It was up 13% from a year earlier, the biggest annual increase since September. As mortgage rates unexpectedly dipped back below 3% in the past week, strong homebuying demand pushed pending sales 51% above 2019 levels, the largest 2-year increase since February. Redfin’s Homebuyer Demand Index, which typically peaks in the spring, also hit its second-highest level of the year.
“A surprising drop in mortgage rates this past week helped stoke more homebuying demand,” said Redfin Chief Economist Daryl Fairweather. “The longer this ultra-low rate environment lasts, the longer price growth can continue. It would be unusual for home prices to hit a record high in November or December, but if rates stay low, that may very well happen. However, by spring we expect mortgage rates to climb as the Fed tries to put the brakes on inflation.”
Key housing market takeaways for 400+ U.S. metro areas:
Unless otherwise noted, the data in this report covers the four-week period ending November 7. Redfin’s housing market data goes back through 2012. Comparing today’s market with the pre-pandemic fall market of 2019 highlights how hot the market remains, even as most measures are settling into typical seasonal patterns.
Data based on homes listed and/or sold during the period:
- The median home-sale price increased 13% year over year to $358,725. This was up 30% from the same period in 2019 and up 2.2% from a month earlier. Over the same period in 2019 prices were down 0.1%, and in 2020 home prices rose 0.5%.
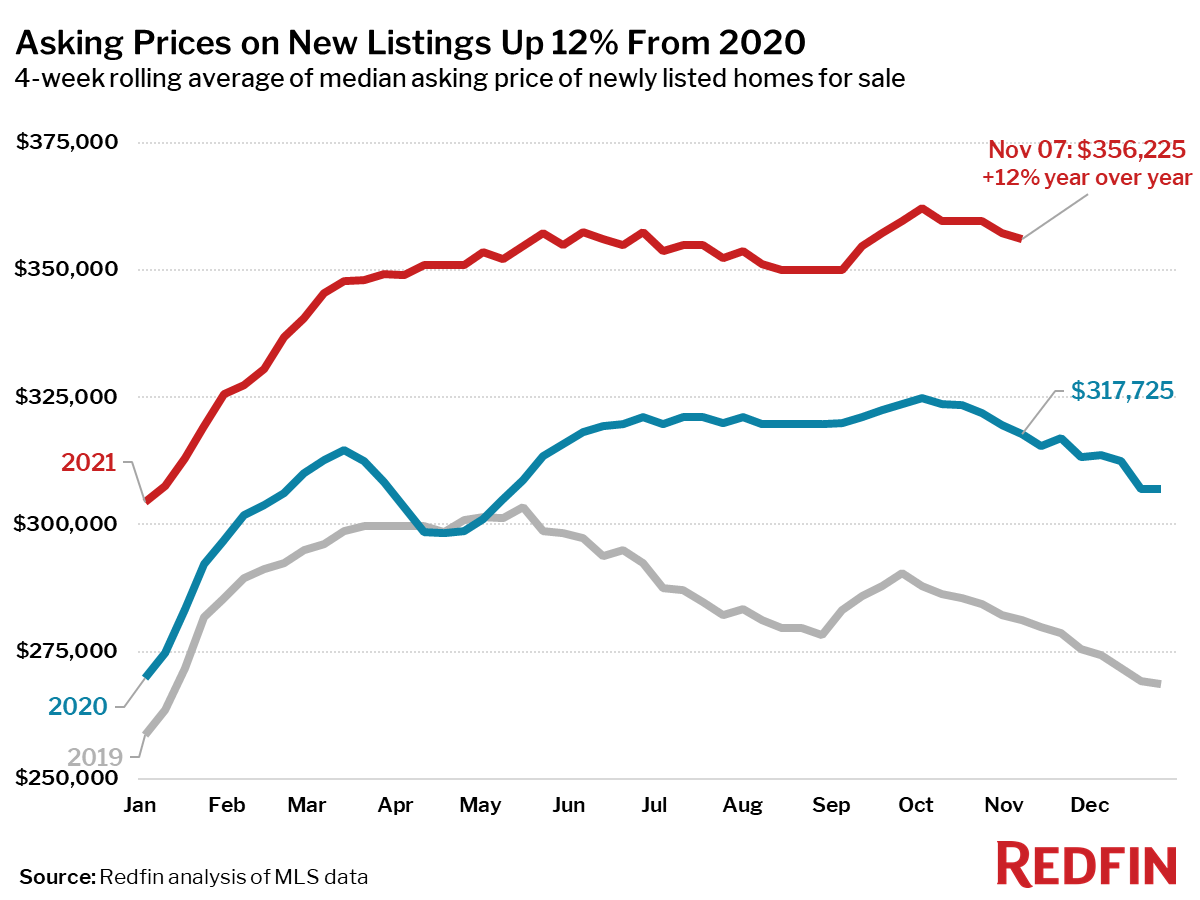
- Asking prices of newly listed homes were up 12% from the same time a year ago and up 27% from 2019 to a median of $356,225.
- Pending home sales were up 7% year over year, and up 51% compared to the same period in 2019.
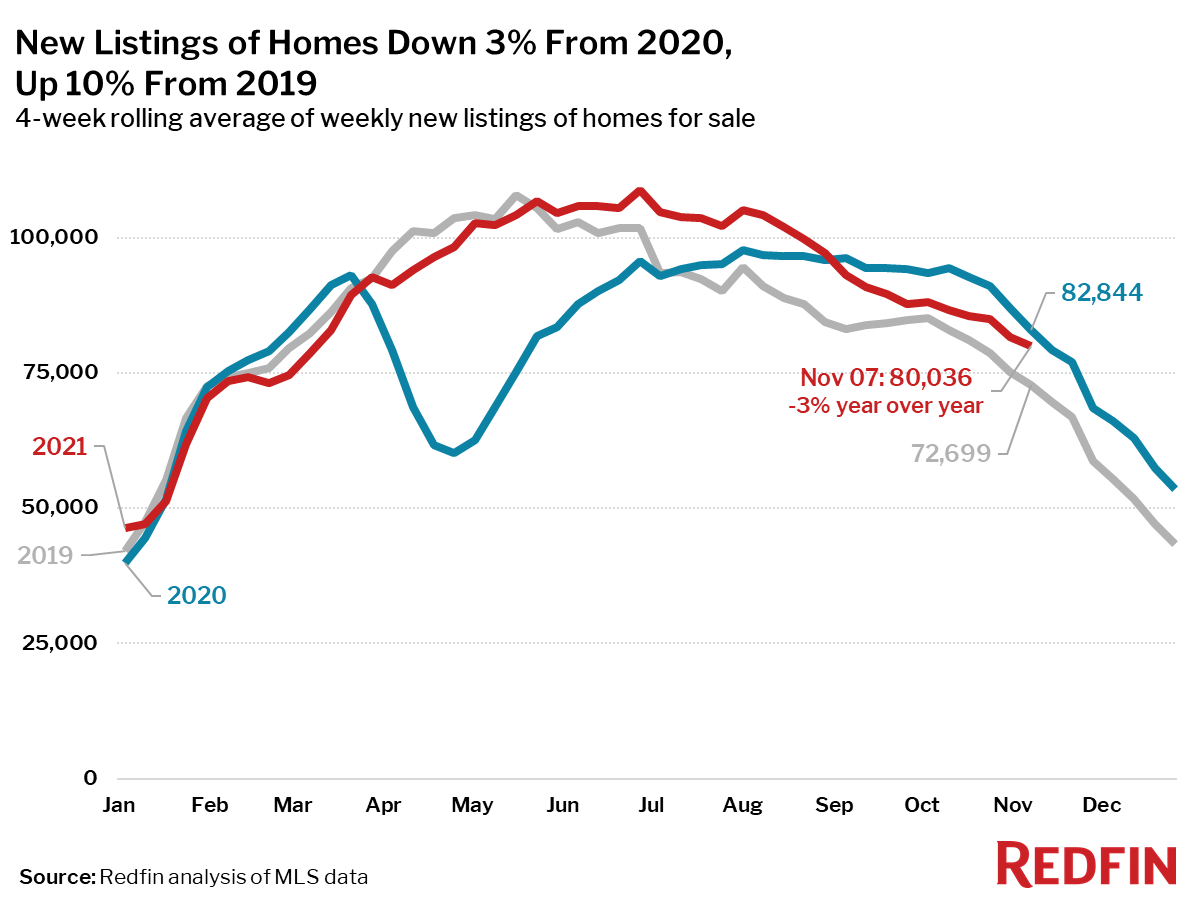
- New listings of homes for sale were down 3% from a year earlier, but up 10% from 2019.
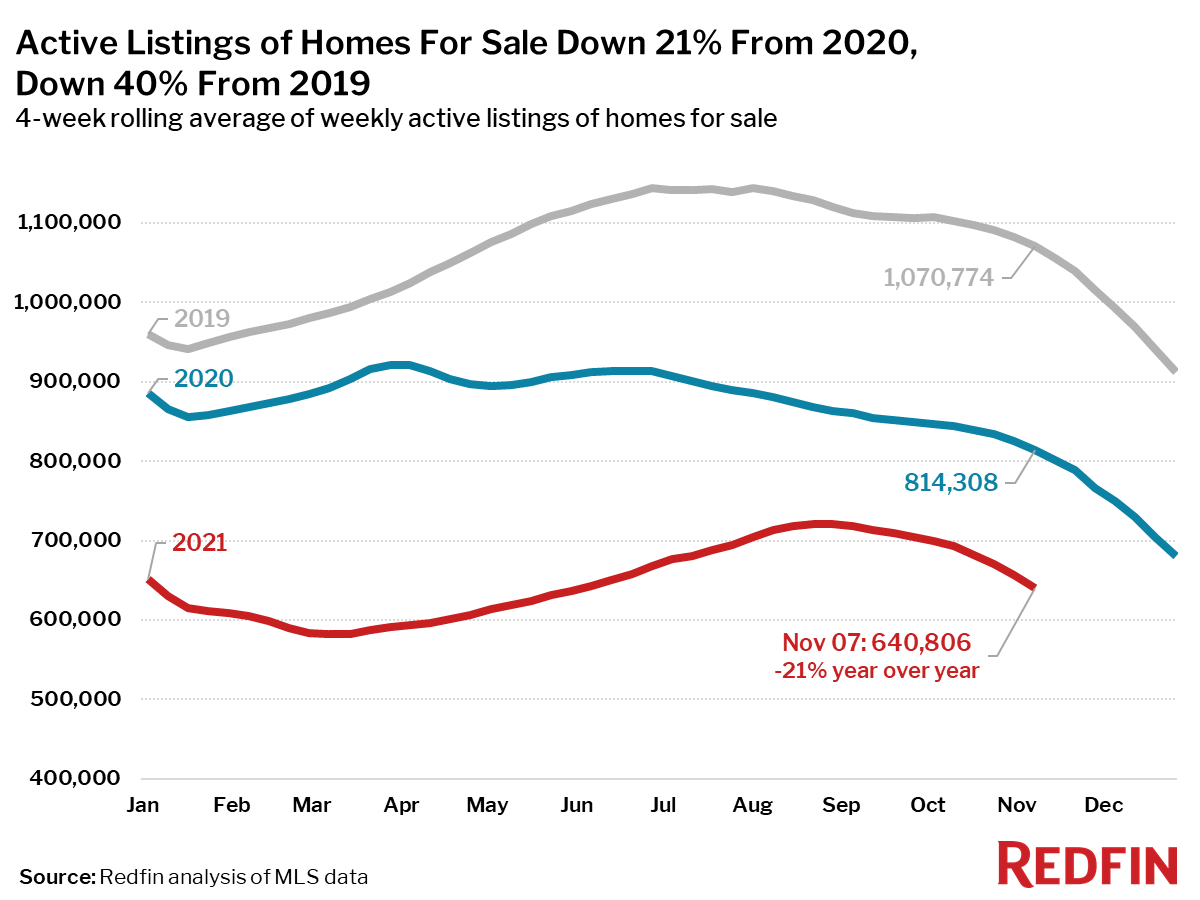
- Active listings (the number of homes listed for sale at any point during the period) fell 21% from 2020 and 40% from 2019.
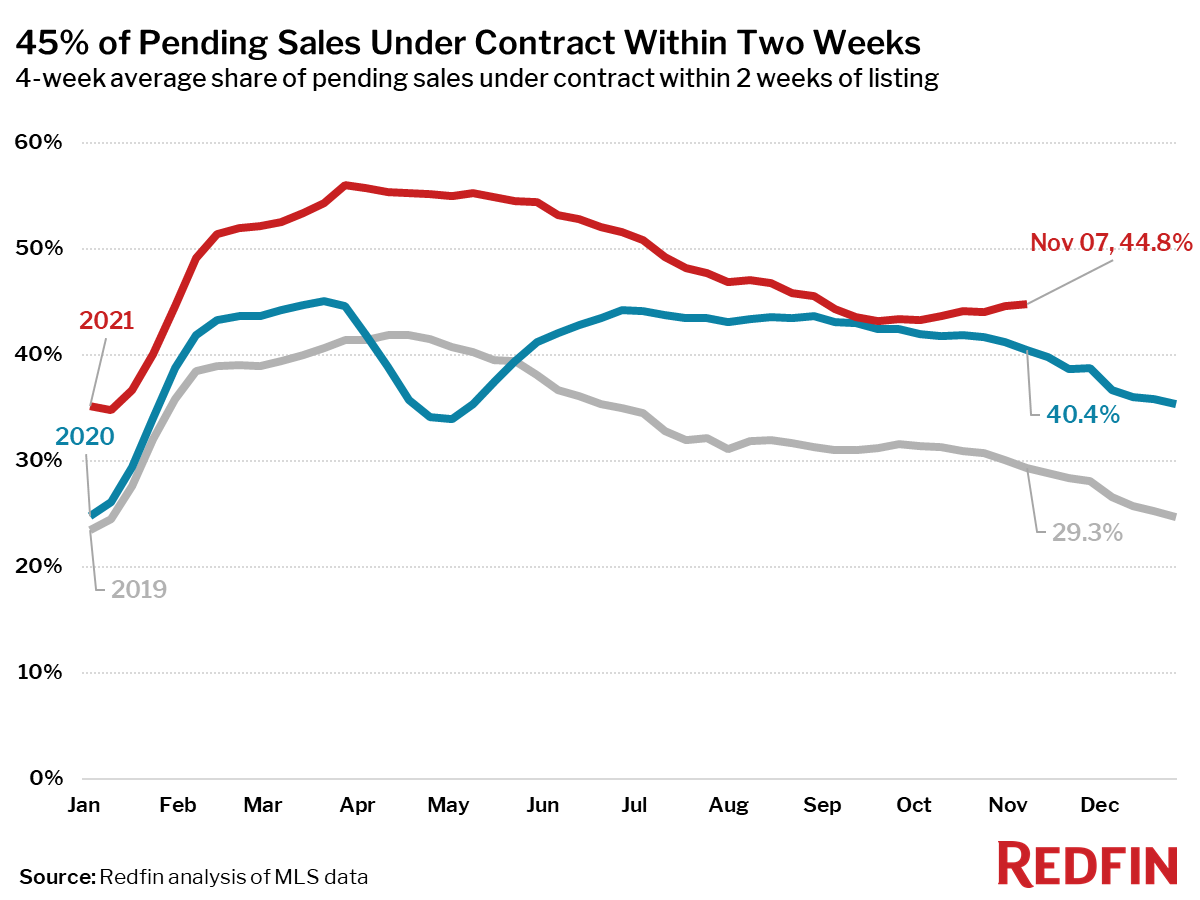
- 45% of homes that went under contract had an accepted offer within the first two weeks on the market, above the 40% rate of a year earlier and the 29% rate in 2019. Since the four-week period ending September 19, the share of homes under contract within two weeks is up 1.6 percentage points. During the same time in 2019, the share fell 1.9 points.
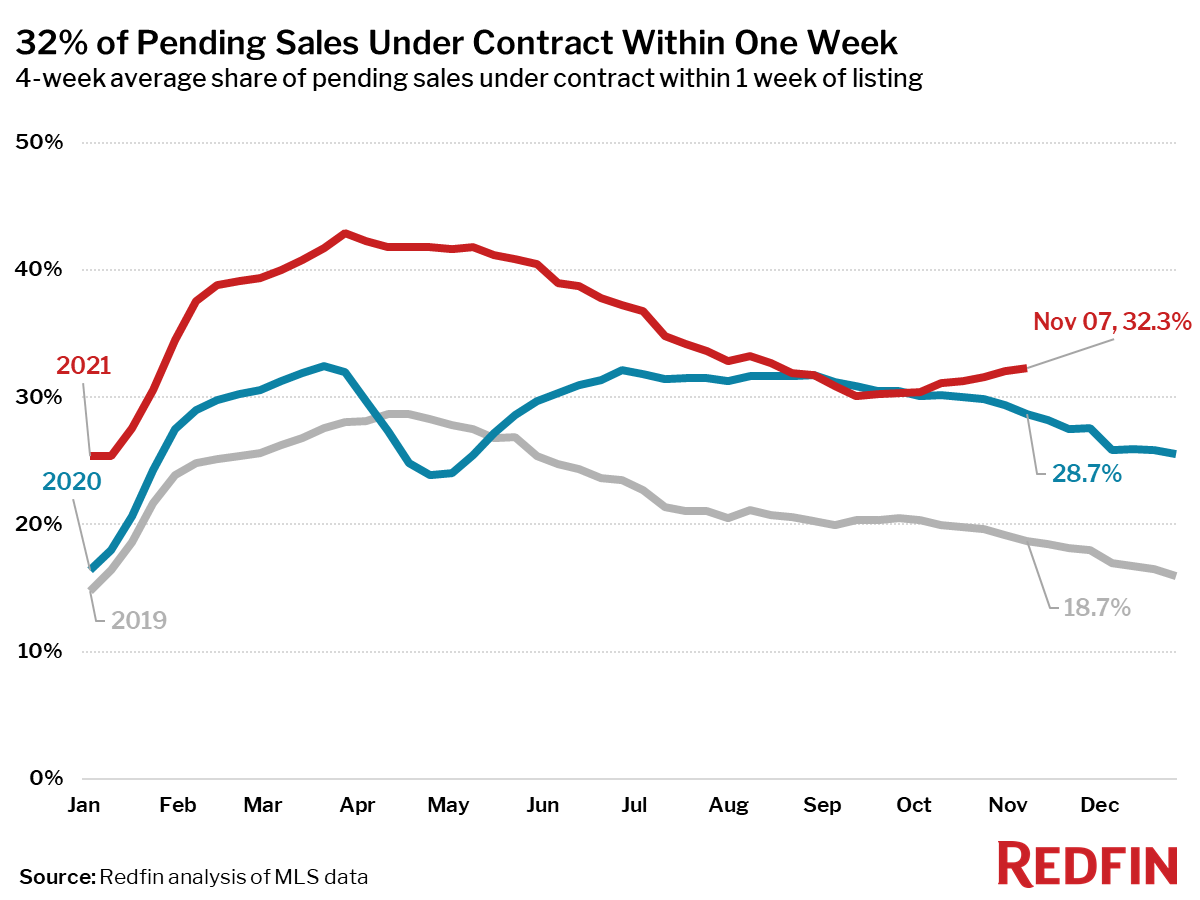
- 32% of homes that went under contract had an accepted offer within one week of hitting the market, up from 29% during the same period a year earlier and 19% in 2019. Since the four-week period ending September 12, the share of homes under contract within a week is up 2.3 percentage points. During the same time in 2019, the share fell 1.6 points.
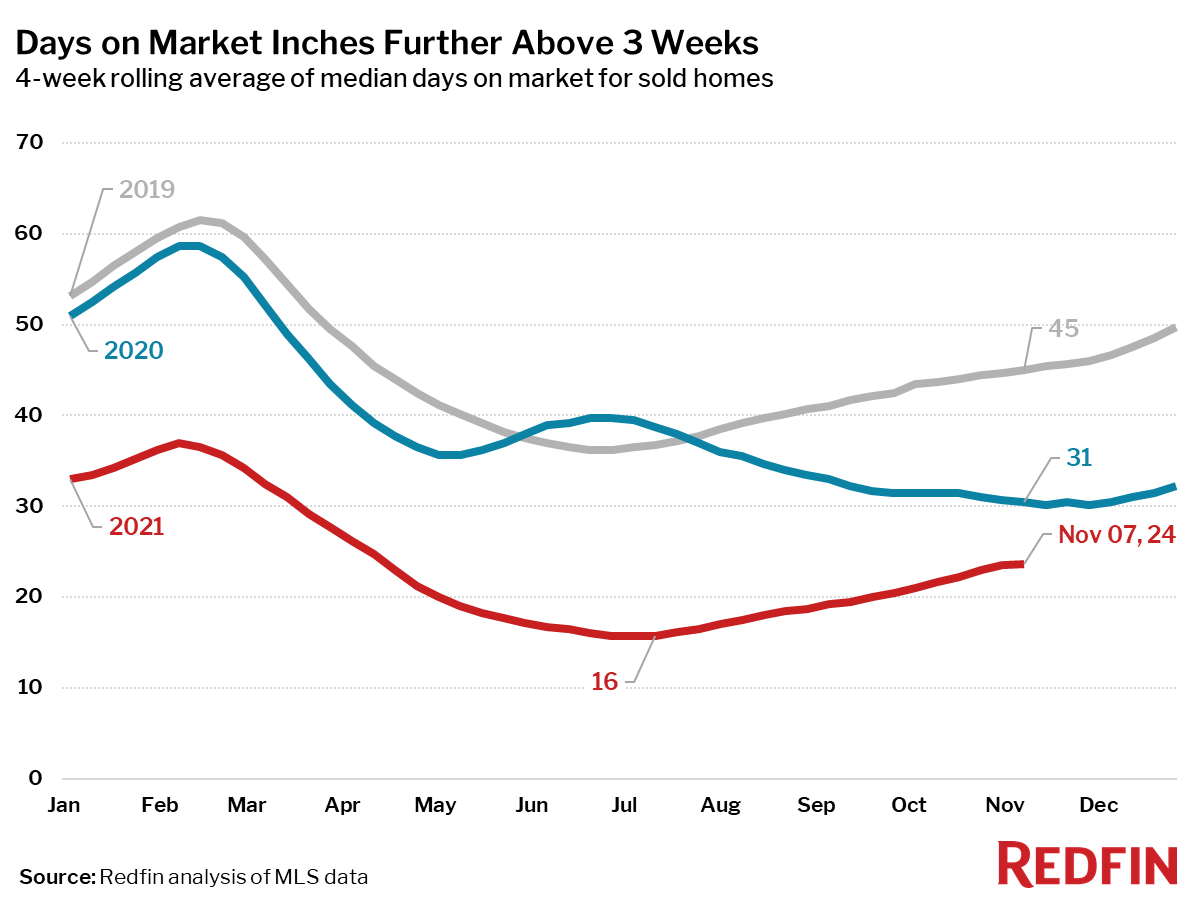
- Homes that sold were on the market for a median of 24 days, more than a week longer than the all-time low of 16 days seen in late June and July, down from 31 days a year earlier and 45 days in 2019.
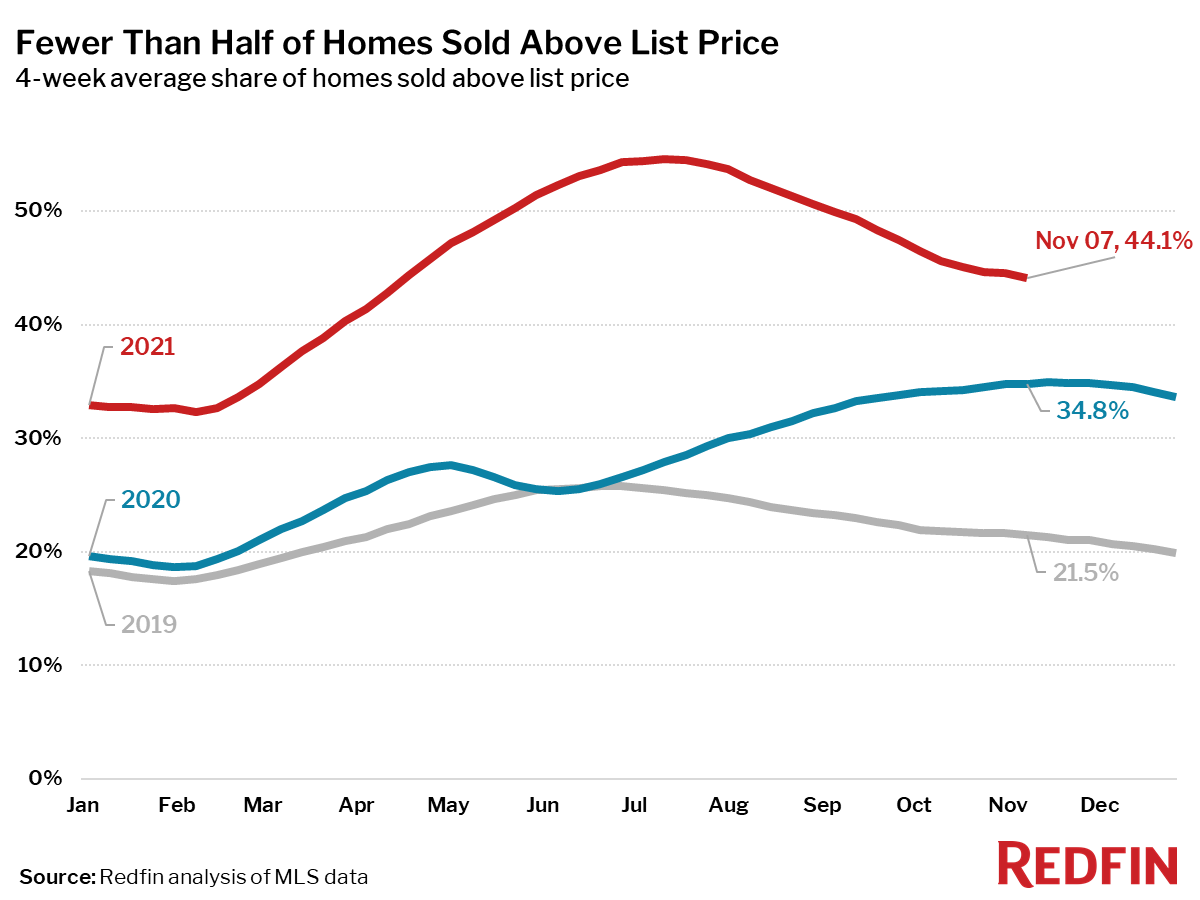
- 44% of homes sold above list price, up from 35% a year earlier and 21% in 2019.
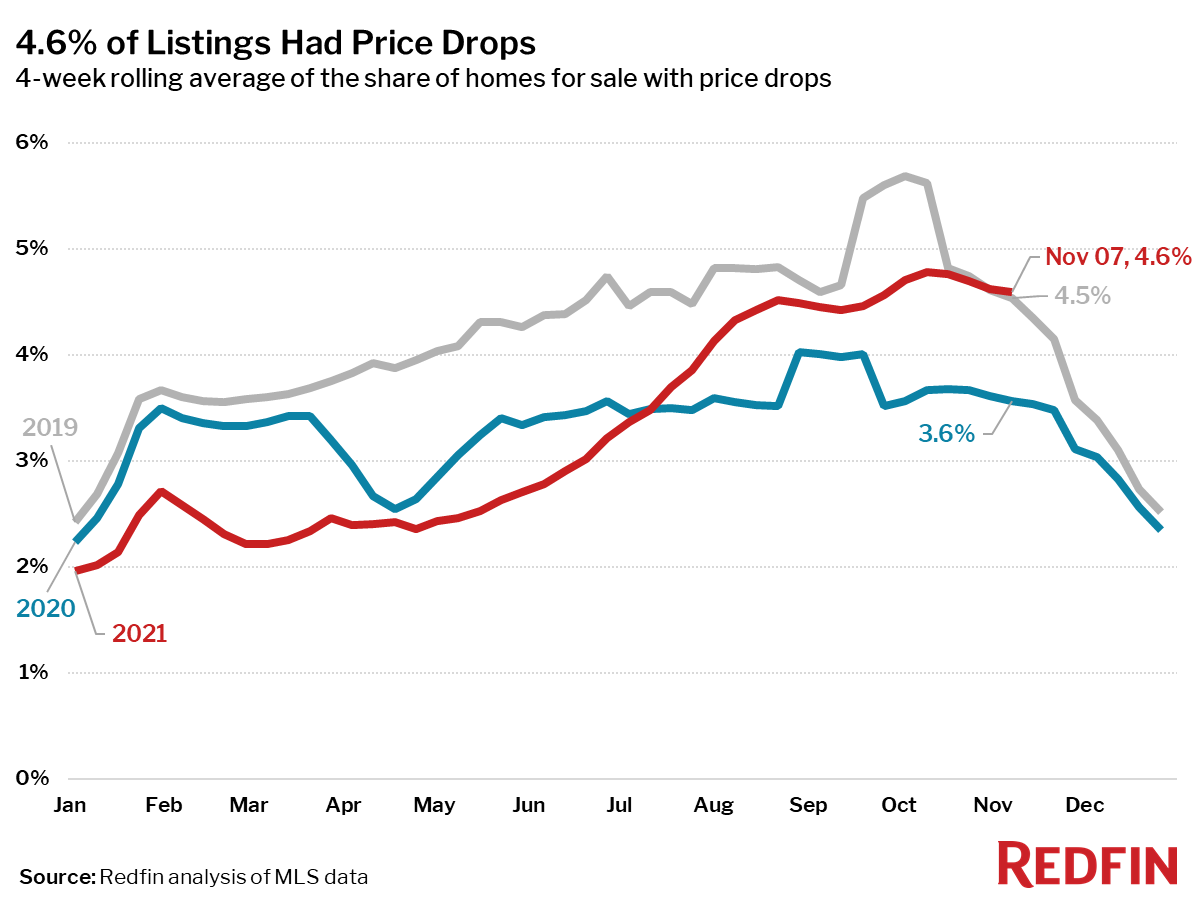
- On average, 4.6% of homes for sale each week had a price drop, up 1 percentage point from the same time in 2020 and up 0.1 points from this time in 2019.
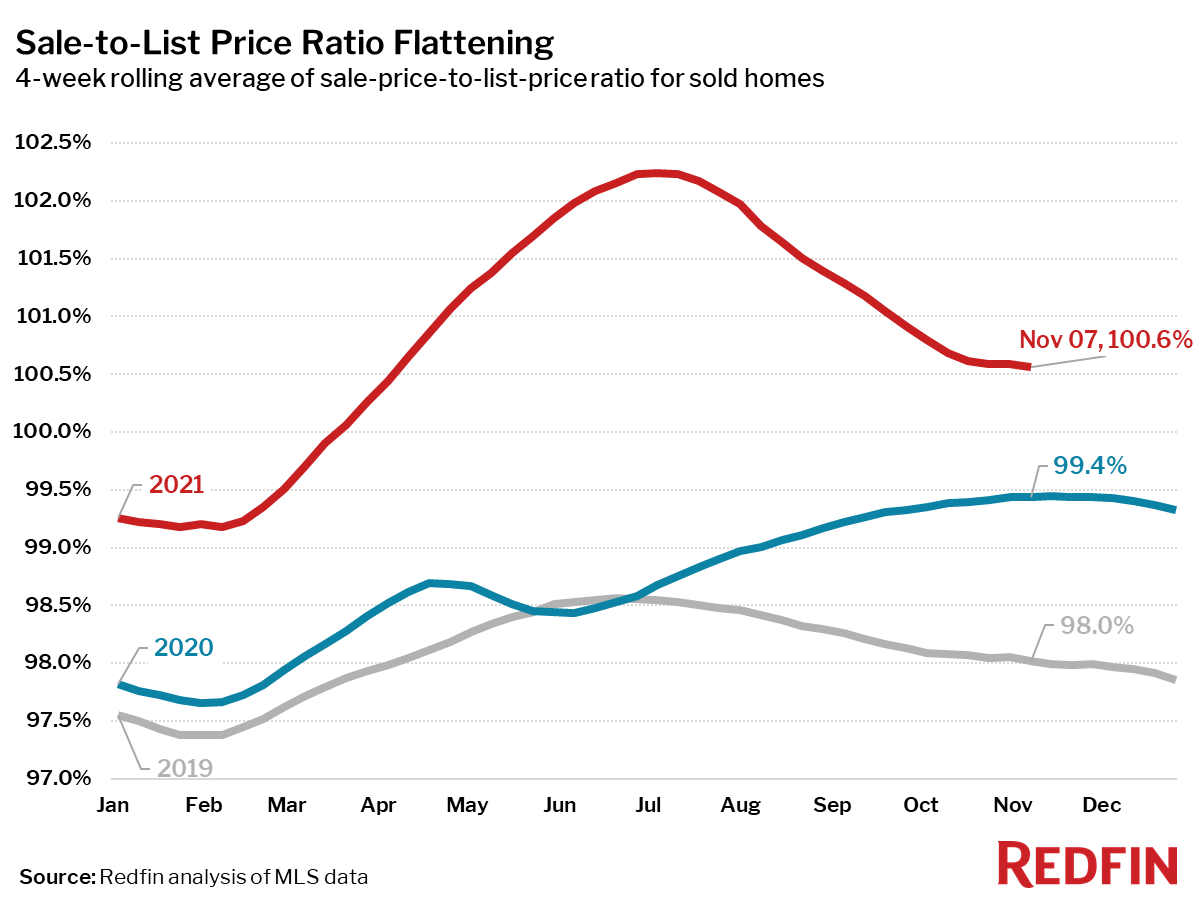
- The average sale-to-list price ratio, which measures how close homes are selling to their asking prices, has been flat at 100.6% for the past month. In other words, the average home sold for 0.6% above its asking price.
Other leading indicators of homebuying activity:
- Mortgage purchase applications increased 3% week over week (seasonally adjusted) during the week ending October 29. For the week ending November 10, 30-year mortgage rates fell to 2.98%.
- From January 1 to November 7, home tours were up 5%, less than the 8% increase over the same period last year, but higher than the 1% change in 2019, according to home tour technology company ShowingTime.
- The Redfin Homebuyer Demand Index rose 5.2 points during the week ending November 7 to its second-highest level of the year, and was up 28% from a year earlier. The seasonally adjusted Redfin Homebuyer Demand Index is a measure of requests for home tours and other home-buying services from Redfin agents.
Refer to our metrics definition page for explanations of all the metrics used in this report.