High home prices and rates sent home sellers and buyers to the sidelines in April and the start of May. But last week’s encouraging economic news drove mortgage rates down a bit, which could bring back prospective sellers and house hunters.
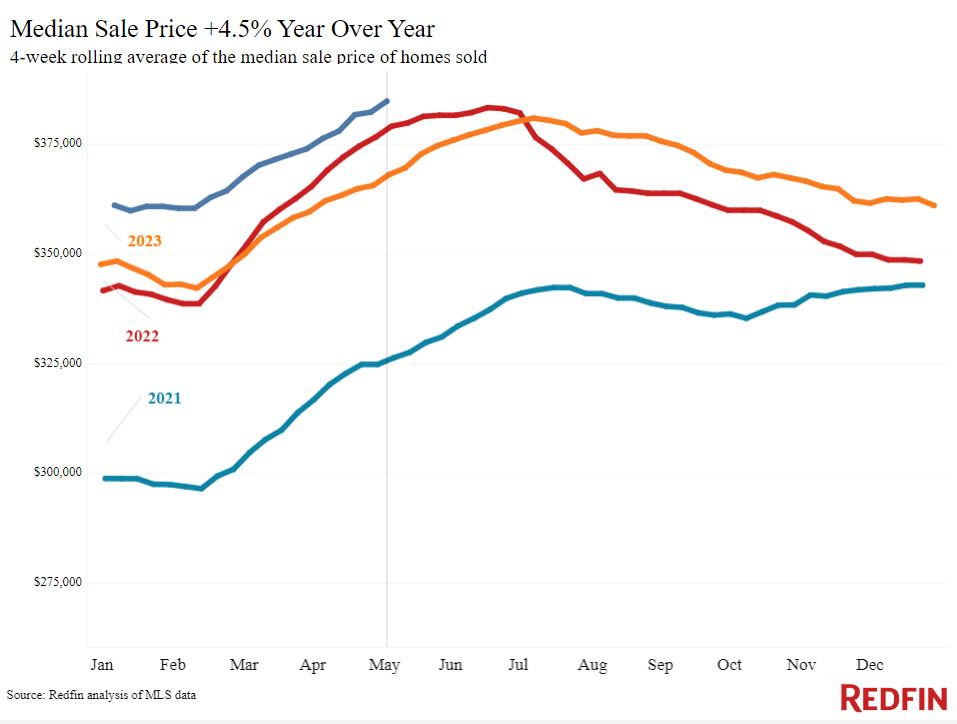
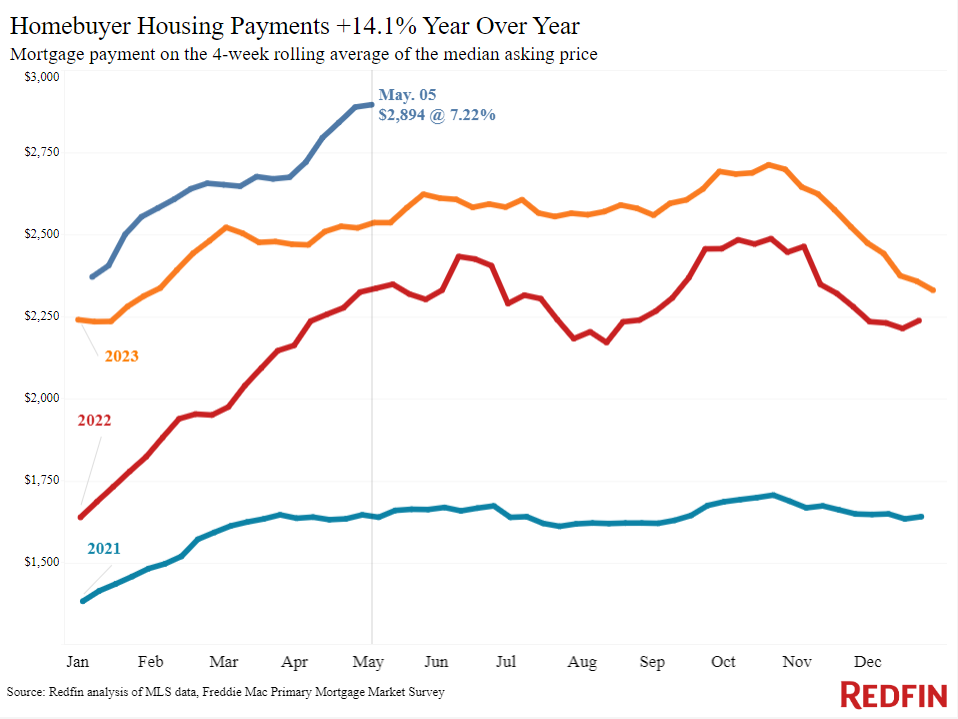
The median U.S. monthly housing payment hit an all-time high of $2,894 during the four weeks ending May 5, up 14% from a year earlier, and home prices rose 4.5% to their own record high.
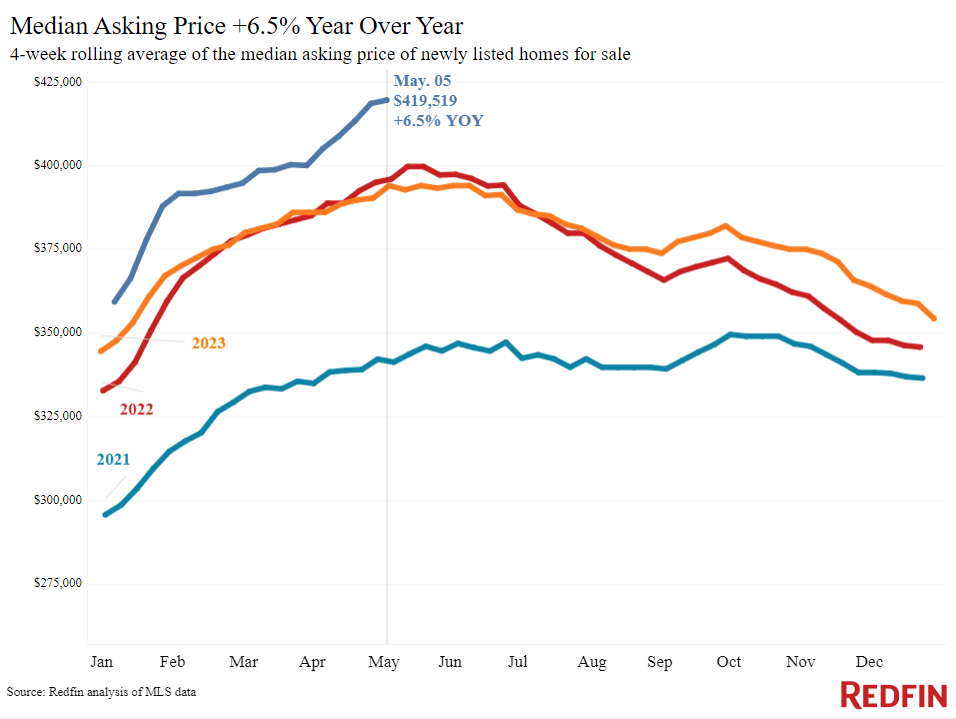
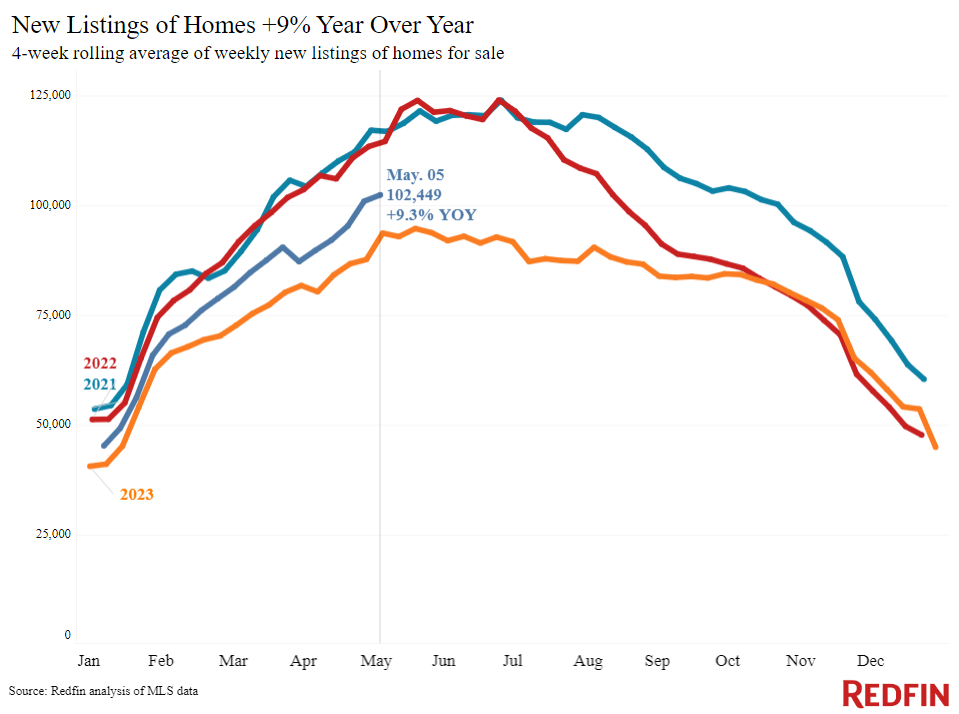
The supply of homes for sale lost momentum, with prospective sellers jittery about high rates. New listings rose 9% year over year, the smallest increase in three months (with the exception of the four weeks ending March 31, when there was an artificially small decline due to Easter.) There were fewer new listings during the four-week period ending May 5 than any comparable period on record except 2020 and 2023. Many would-be sellers backed off when rates rose throughout April, opting to stay put to hold onto their low mortgage rate.
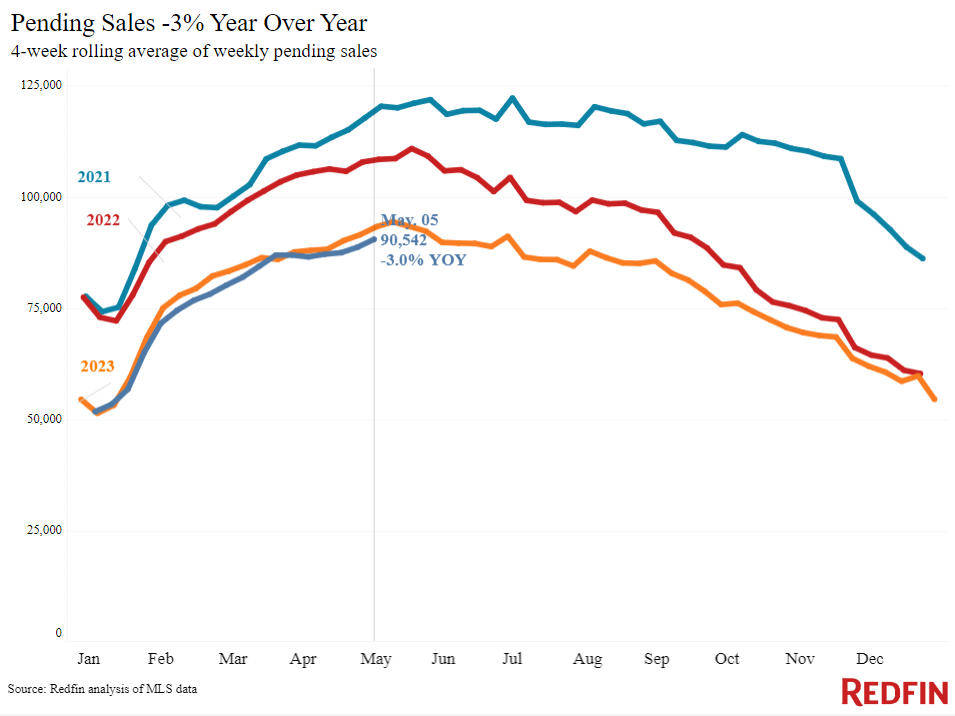
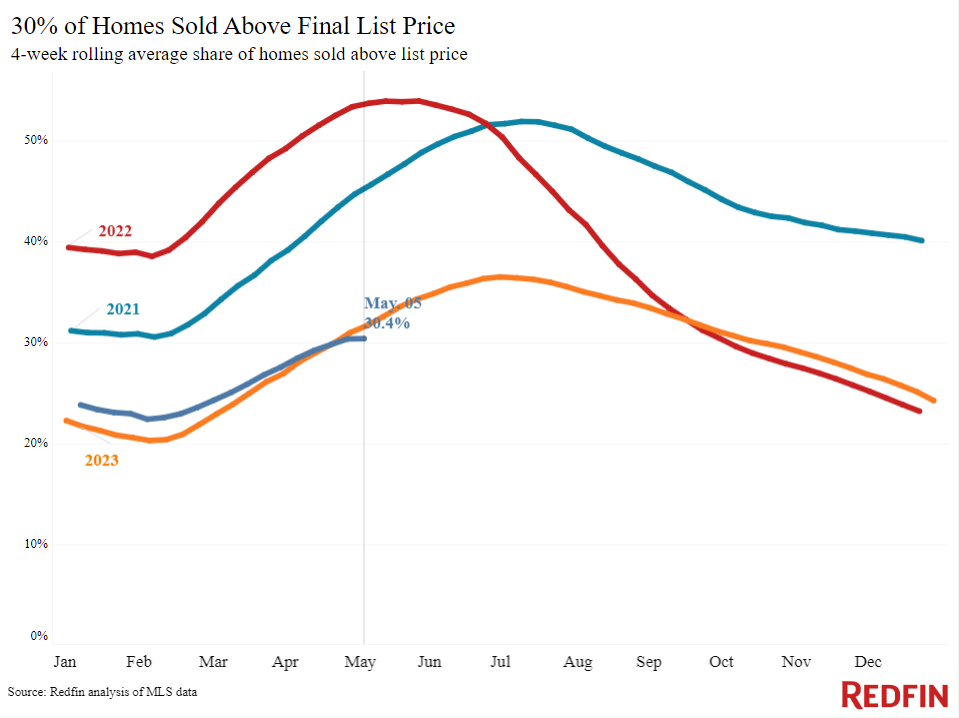
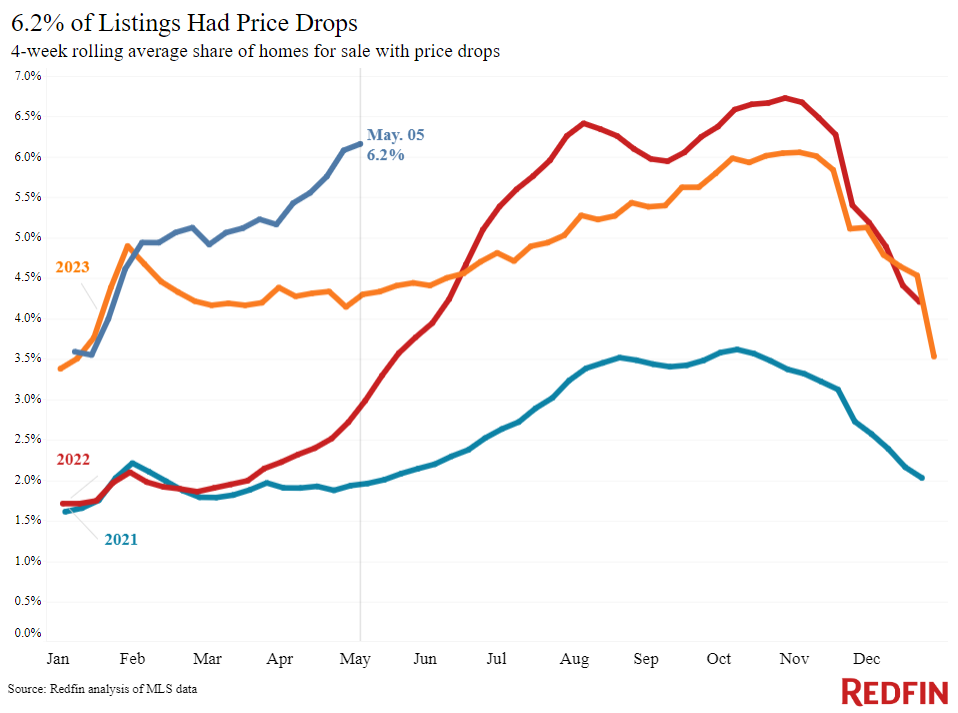
Home sales fell due to high rates and low supply. Pending home sales dropped 3% from a year earlier–the biggest decline in two months. There are also signs that competition for homes is slowing during a time of year when it typically speeds up: 30% of homes sold above asking price, flat from a week earlier and down from 32% a year earlier and more than 50% two years earlier. And 6.2% of home sellers dropped their asking price, the highest share since November and up from 4.3% a year ago. But there is one signal that demand is starting to pick up: Mortgage-purchase applications increased 2% week over week.
Recent economic news brought rates down from their peak. Encouraging economic news pushed daily average mortgage rates down from a five-month high of 7.5% on April 30 to about 7.2% at the end of last week and into this week, bringing buyers a modicum of relief. The Fed held interest rates steady and kept open the possibility of a rate cut later this year at their May 1 meeting, and last Friday’s soft jobs report was another step in the right direction.
“The market is a mixed bag, with high mortgage rates causing some listings to sit longer than I would expect in the springtime and high prices holding steady,” said David Palmer, a Redfin Premier agent in Seattle. “Sellers can rest assured that there are plenty of motivated buyers who are jumping into the market now; they finally understand that rates aren’t going to plummet anytime soon. Those buyers are the people who are moving because they need to: They’re relocating for a new job, going through a divorce, or growing their family. So even though some of my listings are taking longer to sell than they would in a typical spring market, they are selling eventually.”
For Redfin economists’ takes on the housing market, including more on how current financial events are impacting mortgage rates, please visit Redfin’s “From Our Economists” page.
Leading indicators
| Indicators of homebuying demand and activity | ||||
| Value (if applicable) | Recent change | Year-over-year change | Source | |
| Daily average 30-year fixed mortgage rate | 7.2% (May 8) | Down from a 5-month high of 7.52% two weeks earlier | Up from 6.5% | Mortgage News Daily |
| Weekly average 30-year fixed mortgage rate | 7.22% (week ending May 2) | Highest level since Nov. 2023 | Up from 6.39% | Freddie Mac |
| Mortgage-purchase applications (seasonally adjusted) | Increased 2% from a week earlier (as of week ending May 3) | Down 17% | Mortgage Bankers Association | |
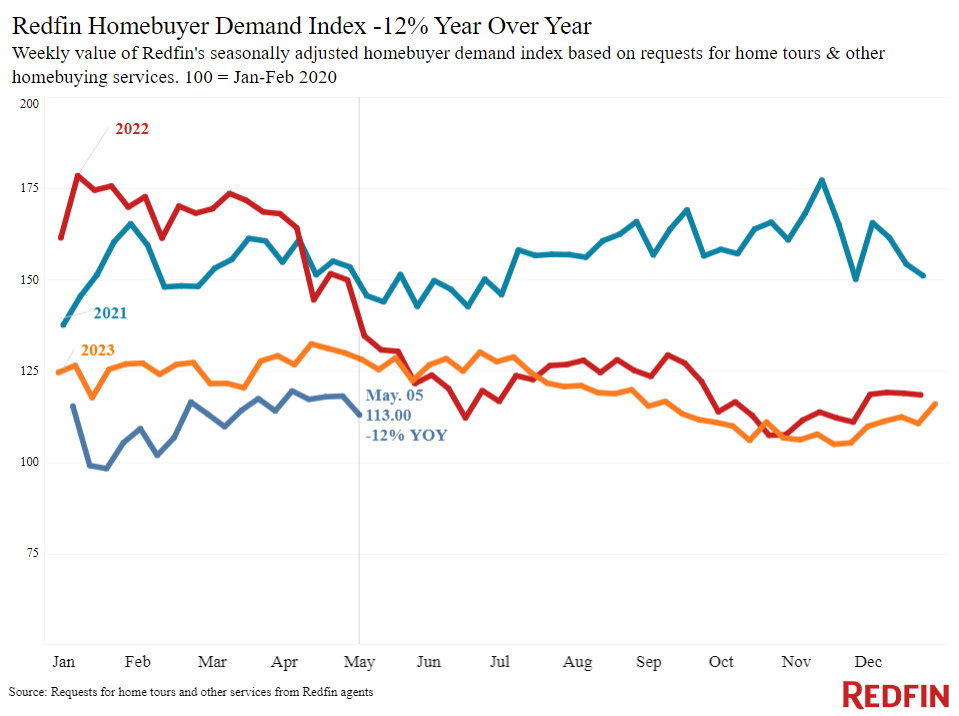
| Redfin Homebuyer Demand Index (seasonally adjusted) | Down 6% from a month earlier (as of week ending May 5) | Down 12% | Redfin Homebuyer Demand Index, a measure of requests for tours and other homebuying services from Redfin agents | |
| Touring activity | Up 32% from the start of the year (as of May 7) | At this time last year, it was up 27% from the start of 2023 | ShowingTime, a home touring technology company | |
| Google searches for “home for sale” | Essentially unchanged from a month earlier (as of May 5) | Down 18% | Google Trends | |
Key housing-market data
| U.S. highlights: Four weeks ending May 5, 2024
Redfin’s national metrics include data from 400+ U.S. metro areas, and is based on homes listed and/or sold during the period. Weekly housing-market data goes back through 2015. Subject to revision. |
|||
| Four weeks ending May 5, 2024 | Year-over-year change | Notes | |
| Median sale price | $384,721 | 4.5% | All-time high |
| Median asking price | $419,519 | 6.5% | All-time high |
| Median monthly mortgage payment | $2,894 at a 7.22% mortgage rate | 14.1% | All-time high |
| Pending sales | 90,542 | -3% | Tied with the 2 previous 4-week periods for the biggest decline in 2 months |
| New listings | 102,449 | 9.3% | Smallest increase since 4 weeks ending Feb. 11, with the exception of a 6.6% increase during the 4 weeks ending March 31 (that uptick was artificially small because of the Easter holiday) |
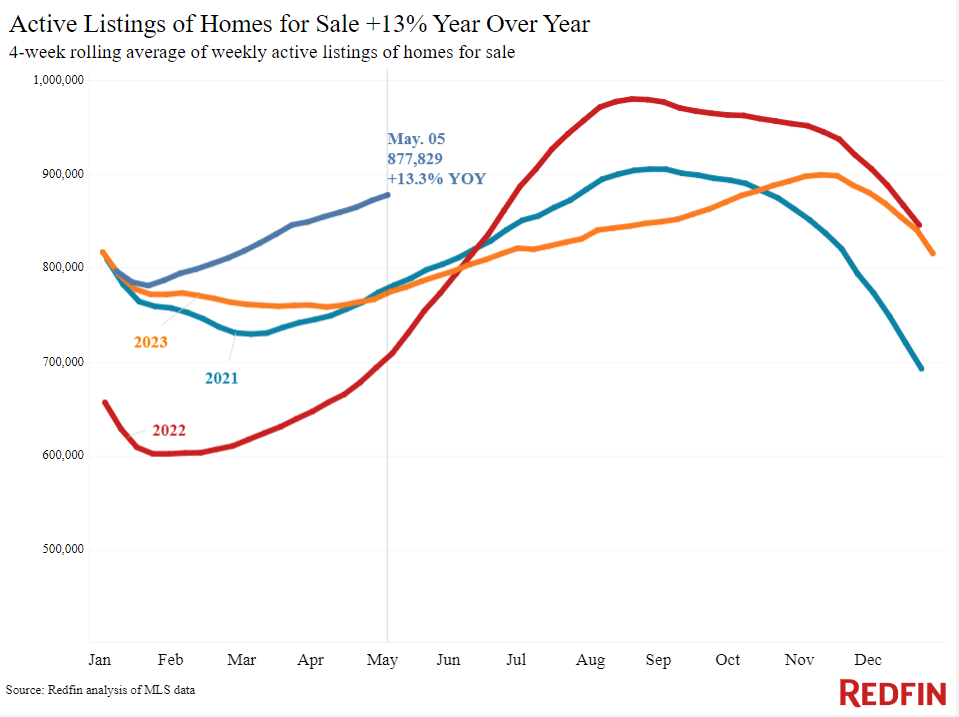
| Active listings | 877,829 | 13.3% | |
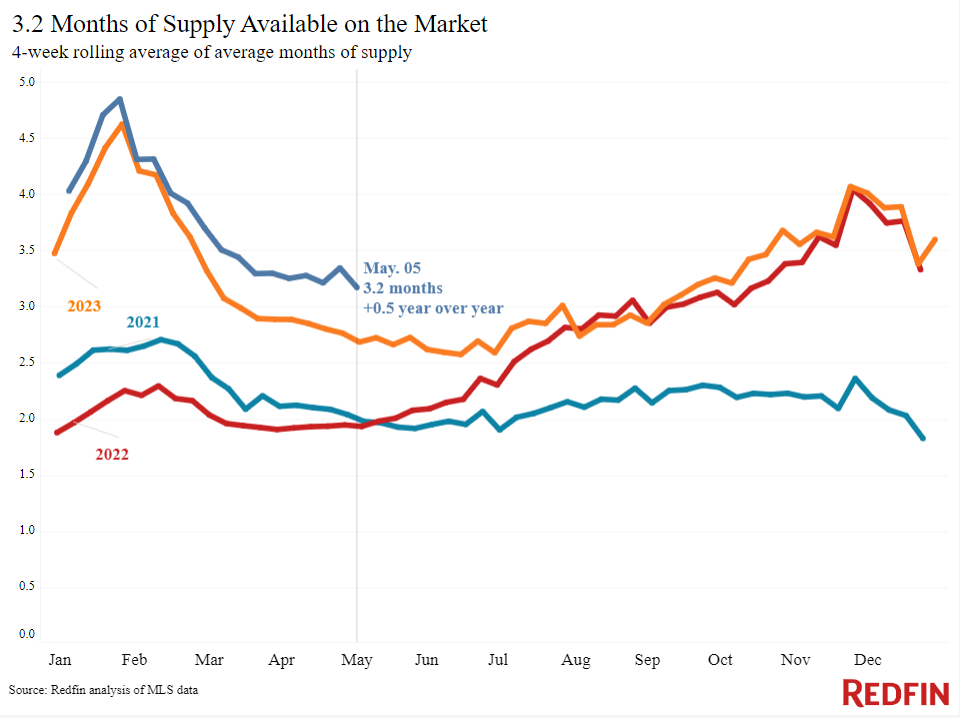
| Months of supply | 3.2 months | +0.5 pts. | 4 to 5 months of supply is considered balanced, with a lower number indicating seller’s market conditions. |
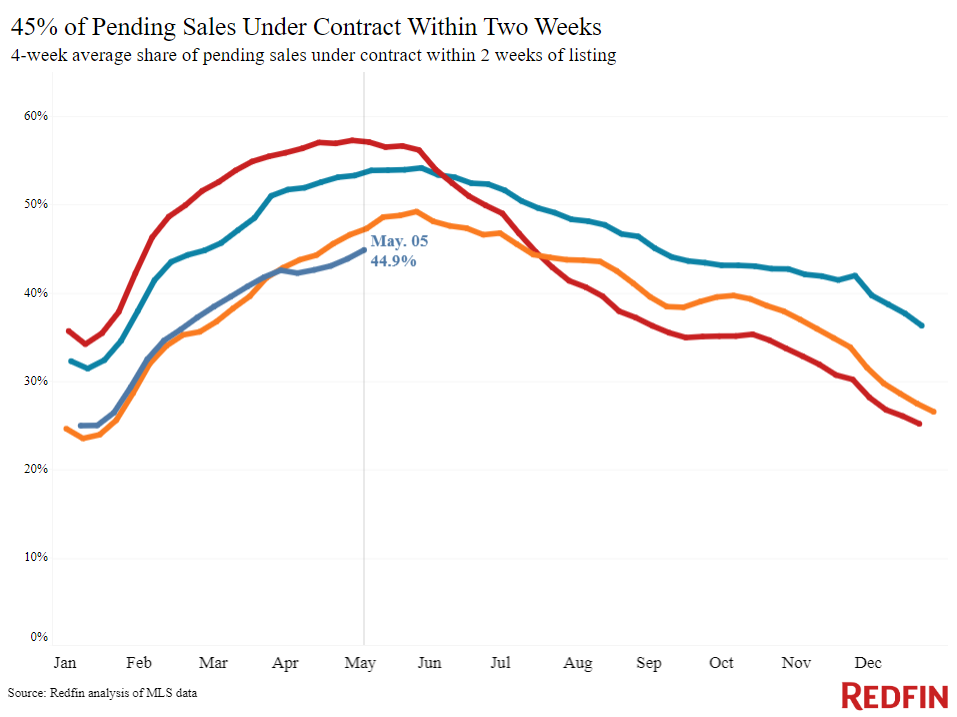
| Share of homes off market in two weeks | 44.9% | Down from 47% | |
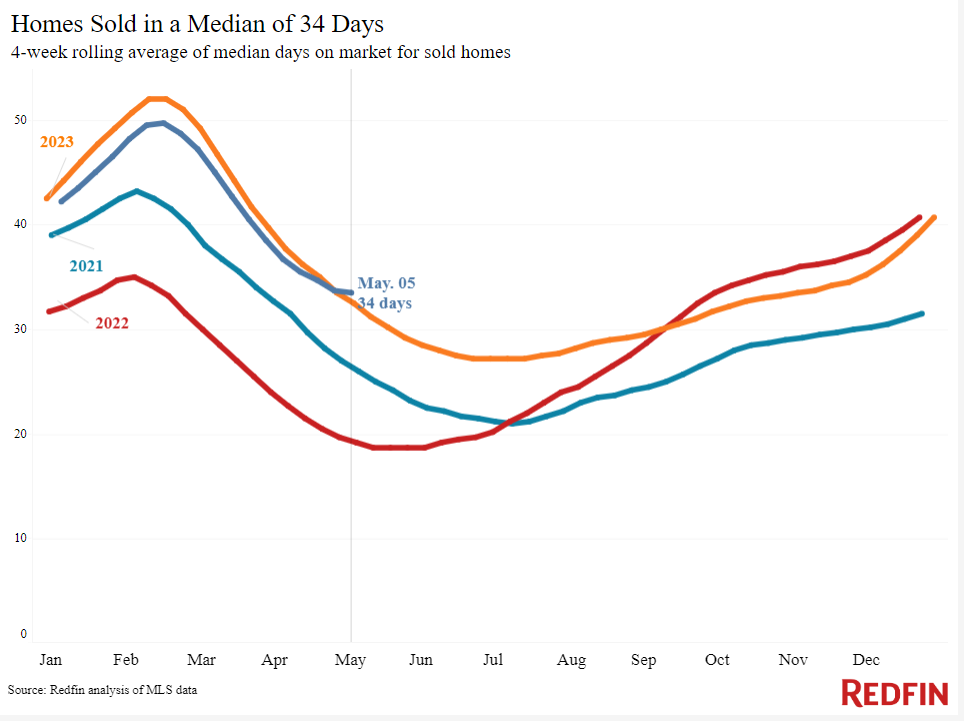
| Median days on market | 34 | +1 day | |
| Share of homes sold above list price | 30.4% | Down from 32% | |
| Share of homes with a price drop | 6.2% | +1.9 pts. | |
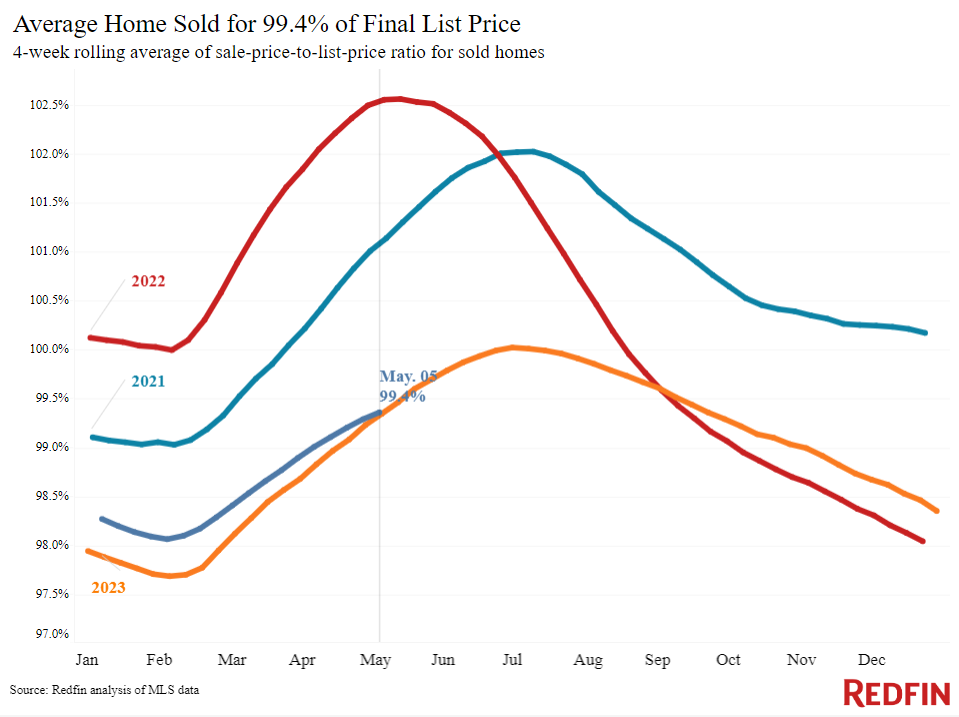
| Average sale-to-list price ratio | 99.4% | +0.1 pt. | |
|
Metro-level highlights: Four weeks ending May 5, 2024 Redfin’s metro-level data includes the 50 most populous U.S. metros. Select metros may be excluded from time to time to ensure data accuracy. |
|||
|---|---|---|---|
|
Metros with biggest year-over-year increases |
Metros with biggest year-over-year decreases |
Notes |
|
| Median sale price | Anaheim, CA (21%)
West Palm Beach, FL (15.9%) Detroit (15.7%) San Jose, CA (13.2%) New Brunswick, NJ (12.8%) |
San Antonio, TX (-1.9%) |
Declined in just 1 metro |
| Pending sales | San Jose, CA (21.9%)
Anaheim, CA (9.1%) Oakland, CA (6.1%) San Francisco (6.1%) Seattle (5.9%) |
Phoenix (-13%)
Atlanta (-11.7%) Houston (-11.1%) Jacksonville, FL (-10.3%) Orlando, FL (-10.2%) |
Increased in 15 metros |
| New listings | San Jose, CA (35.6%)
Phoenix (25.9%) Seattle (22.4%) San Diego, CA (21.5%) Oakland, CA (21.1%) |
Chicago (-9%)
Newark, NJ (-4.3%) Warren, MI (-3.9%) Atlanta (-3%) Detroit (-2.5%) Providence, RI (-1.5%) |
Declined in 6 metros |
Refer to our metrics definition page for explanations of all the metrics used in this report.