Since mortgage rates came down from their June high, measures of early demand like online real estate searches and home tours have ticked up and/or stabilized.
A half-point drop in mortgage rates from their June high is drawing some homebuyers back to the market. Redfin’s Homebuyer Demand Index—a measure of requests for home tours and other home-buying services from Redfin agents—has increased 15 points since the week of June 19, reversing a 10-week trend of decreasing demand that began in mid-April. Searches of homes for sale on Google have also risen 11 percent since late May, and touring levels have been relatively stable for the past two weeks.
However, the uptick in early demand has not carried through to home-purchase contracts or sales. Pending home sales are down, few homes are being listed, and inventory is piling up as homes take longer to sell. Home-sale prices continue to decline, with the year-over-year growth rate falling to 9%, its lowest level since August 2020.
“The housing market seems to be settling into an equilibrium now that demand has leveled off,” said Redfin chief economist Daryl Fairweather. “We may still be in for some surprises when it comes to inflation and rate hikes from the Fed, but for now an ease in mortgage rates has brought some relief to buyers who were reeling from last month’s rate spike. Although the number of sales is down considerably from last year, first time-homebuyers with not a lot of cash are welcoming the decline in competition, and anyone who intends to stay in their home for many years doesn’t need to worry about these short-term fluctuations in home prices.”
In reaction to this week’s economic news, Redfin Deputy Chief Economist Taylor Marr added:
“Whether we label the current economy a recession doesn’t matter much except for sentiment. The under-the-hood stats—on consumption, real income and inflation—significantly worsened last quarter. Weaker economic growth and poor consumer sentiment are weighing on both homebuyers and sellers. The upside is that mortgage rates fall when the potential for economic growth is weak. This could help bring more rate-sensitive homebuyers off the fence to move forward with a purchase.”
Leading indicators of homebuying activity:
- For the week ending July 28, 30-year mortgage rates fell to 5.3%. This was down from a 2022 high of 5.81% but up from 3.11% at the start of the year.
- Fewer people searched for “homes for sale” on Google—searches during the week ending July 23 were down 26% from a year earlier, but are up 11% since late May.
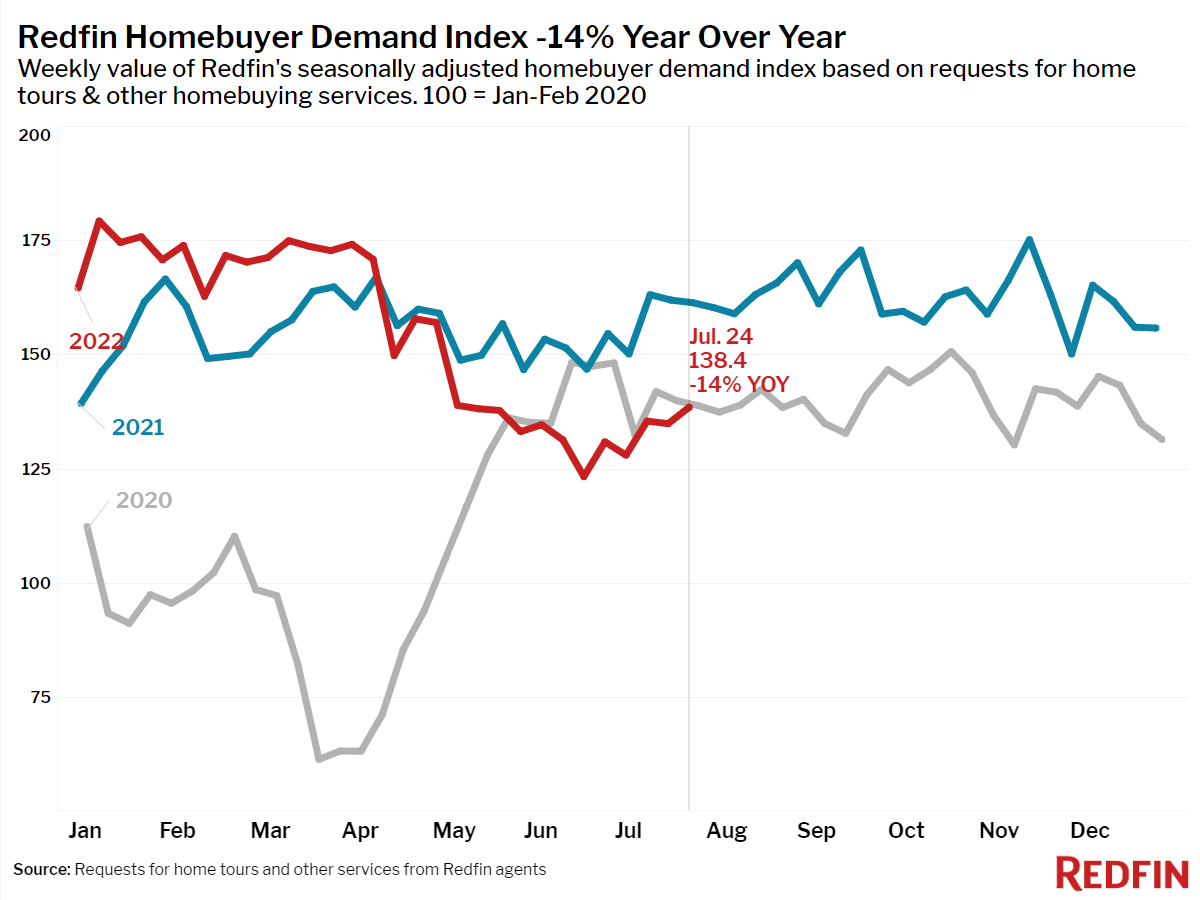
- The seasonally-adjusted Redfin Homebuyer Demand Index—a measure of requests for home tours and other home-buying services from Redfin agents—was down 14% year over year during the week ending July 24, but has risen 15 points since the week of June 19.
- Touring activity as of July 10 was down 4% from the start of the year, compared to an 18% increase at the same time last year, according to home tour technology company ShowingTime.
- Mortgage purchase applications were down 18% from a year earlier during the week ending July 22, while the seasonally-adjusted index was down 1% week over week.
Key housing market takeaways for 400+ U.S. metro areas:
Unless otherwise noted, the data in this report covers the four-week period ending July 24. Redfin’s housing market data goes back through 2012.
Data based on homes listed and/or sold during the period:
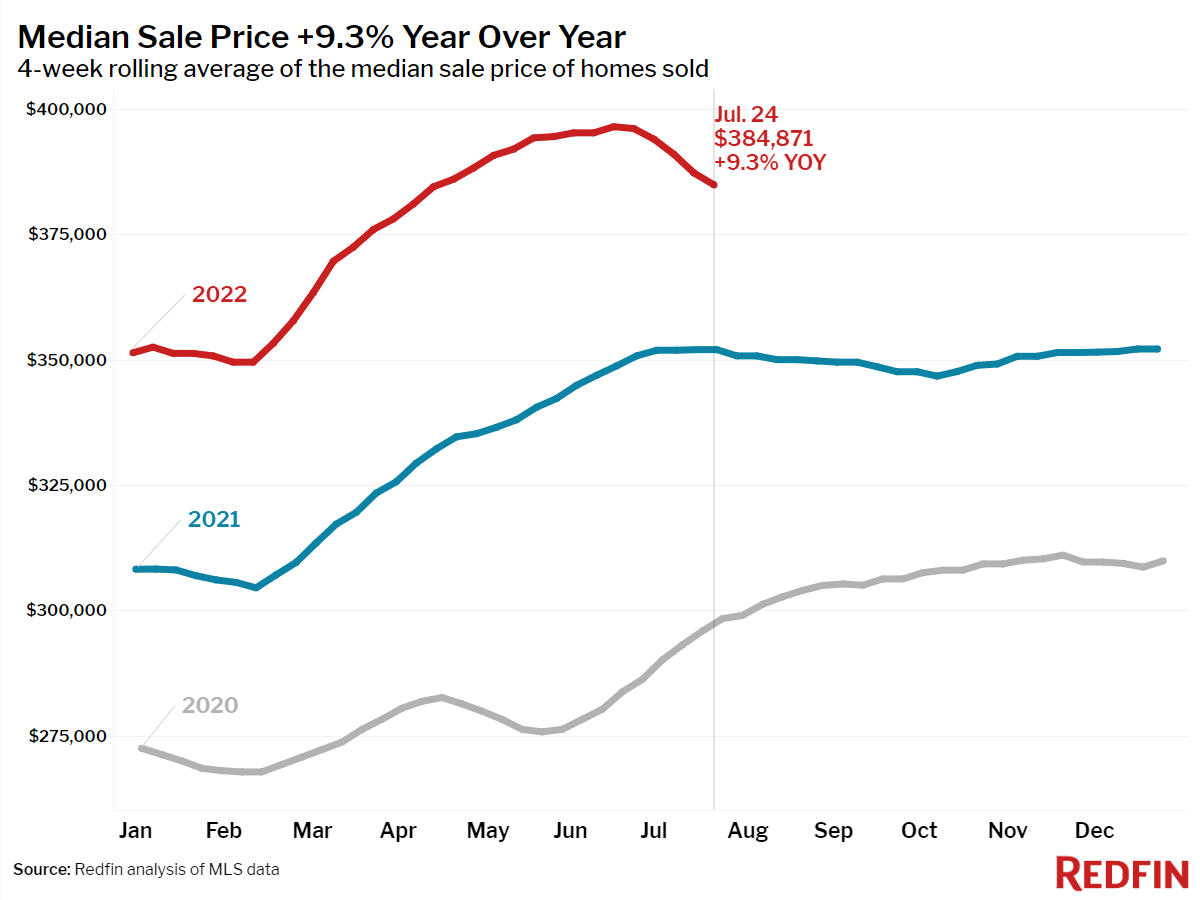
- The median home sale price was up $384,871, up 9% year over year, the slowest growth rate since August 2020. Prices fell 2.9% from the peak during the four-week period ending June 19. A year ago they rose 0.9% during the same period.
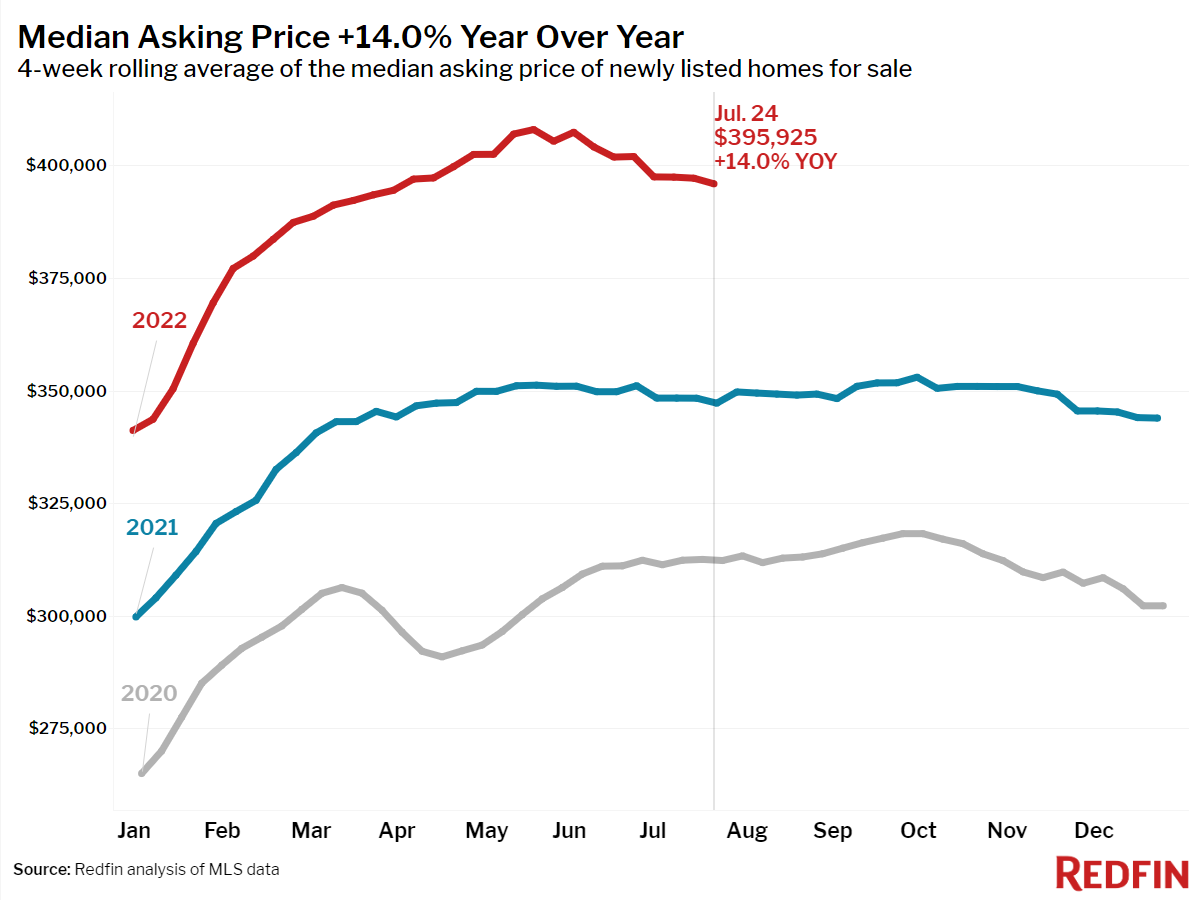
- The median asking price of newly listed homes increased 14% year over year to $395,925, but was down 3% from the all-time high set during the four-week period ending May 22. Last year during the same period median prices were down just 1.1%.
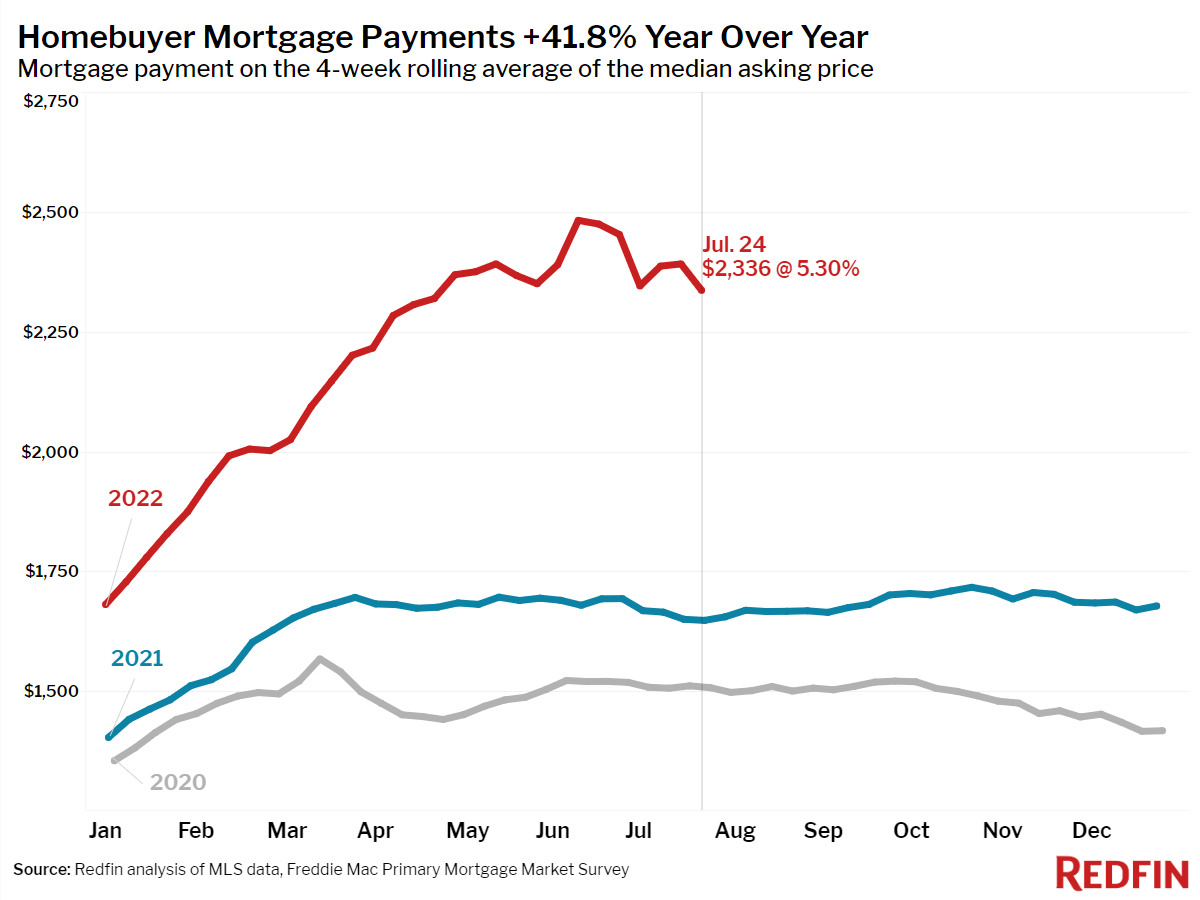
- The monthly mortgage payment on the median asking price home hit $2,336 at the current 5.3% mortgage rate, up 42% from $1,648 a year earlier, when mortgage rates were 2.8%. That’s down slightly from the peak of $2,482 reached during the four weeks ending June 12.
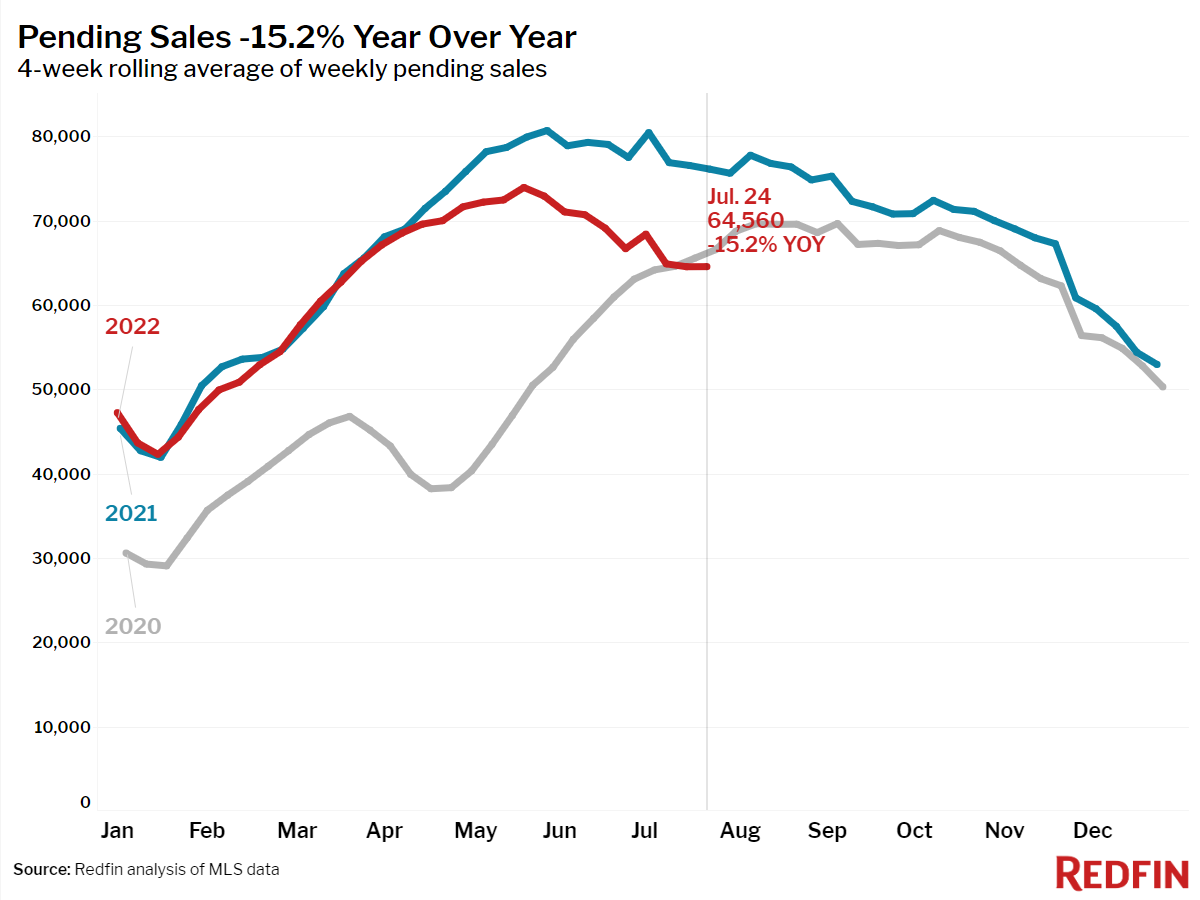
- Pending home sales were down 15% year over year.
- New listings of homes for sale were down 6% from a year earlier.
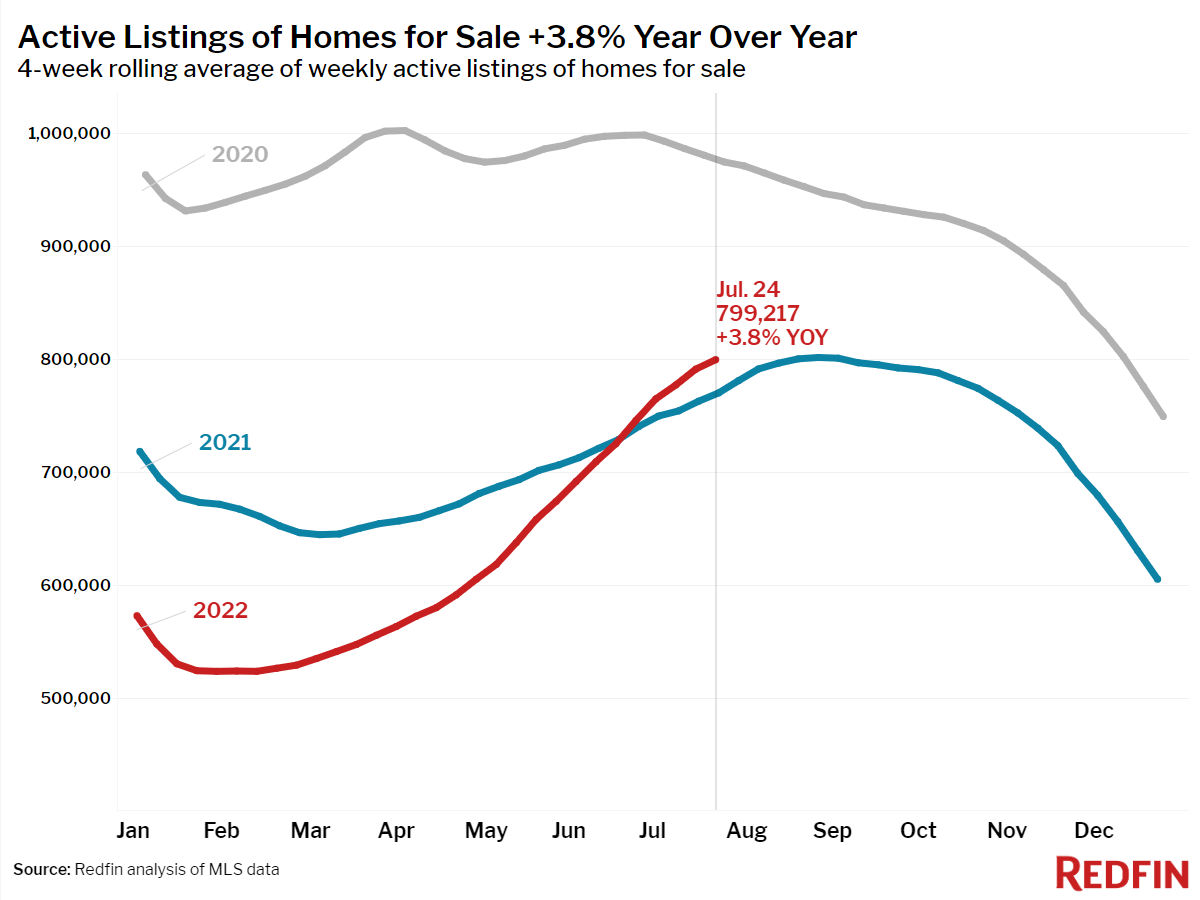
- Active listings (the number of homes listed for sale at any point during the period) rose 4% year over year—the largest increase since August 2019.
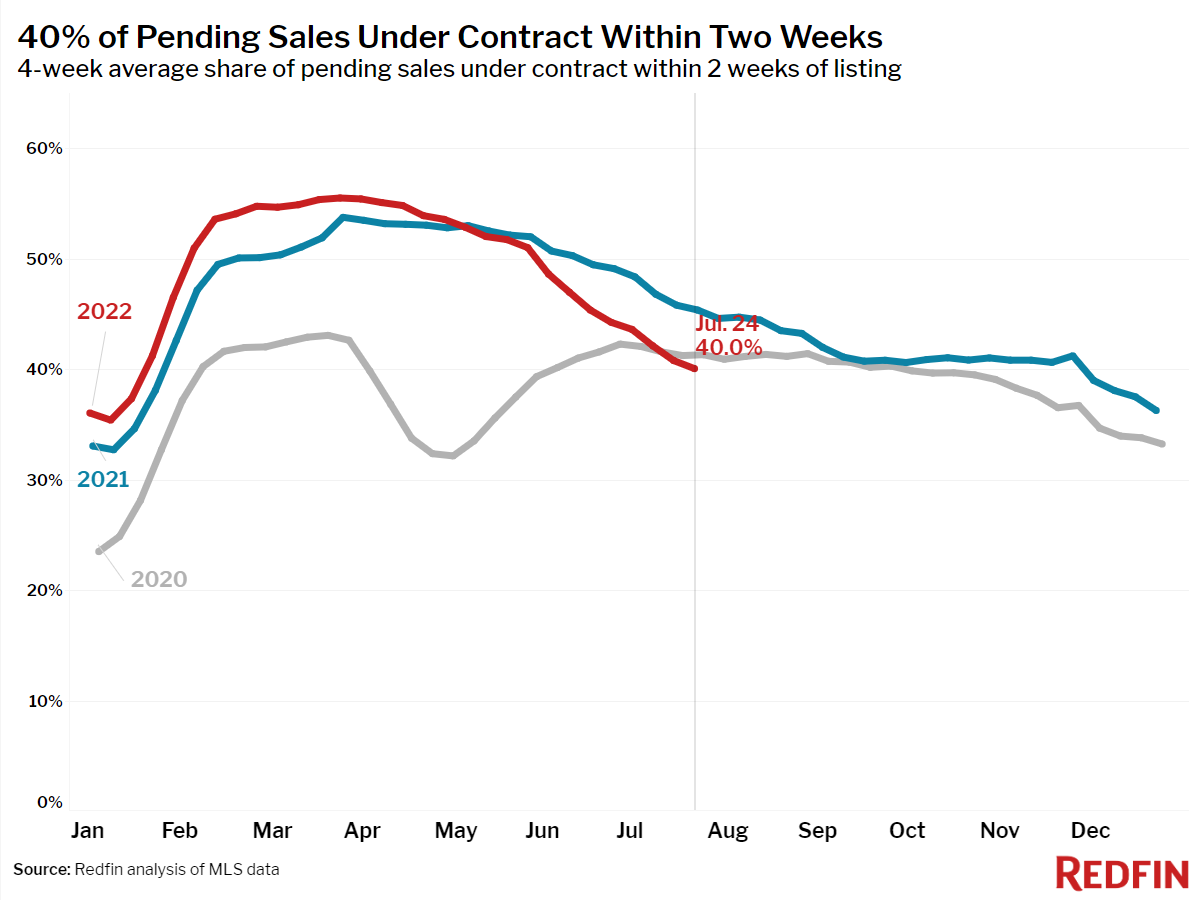
- 40% of homes that went under contract had an accepted offer within the first two weeks on the market, down from 45% a year earlier.
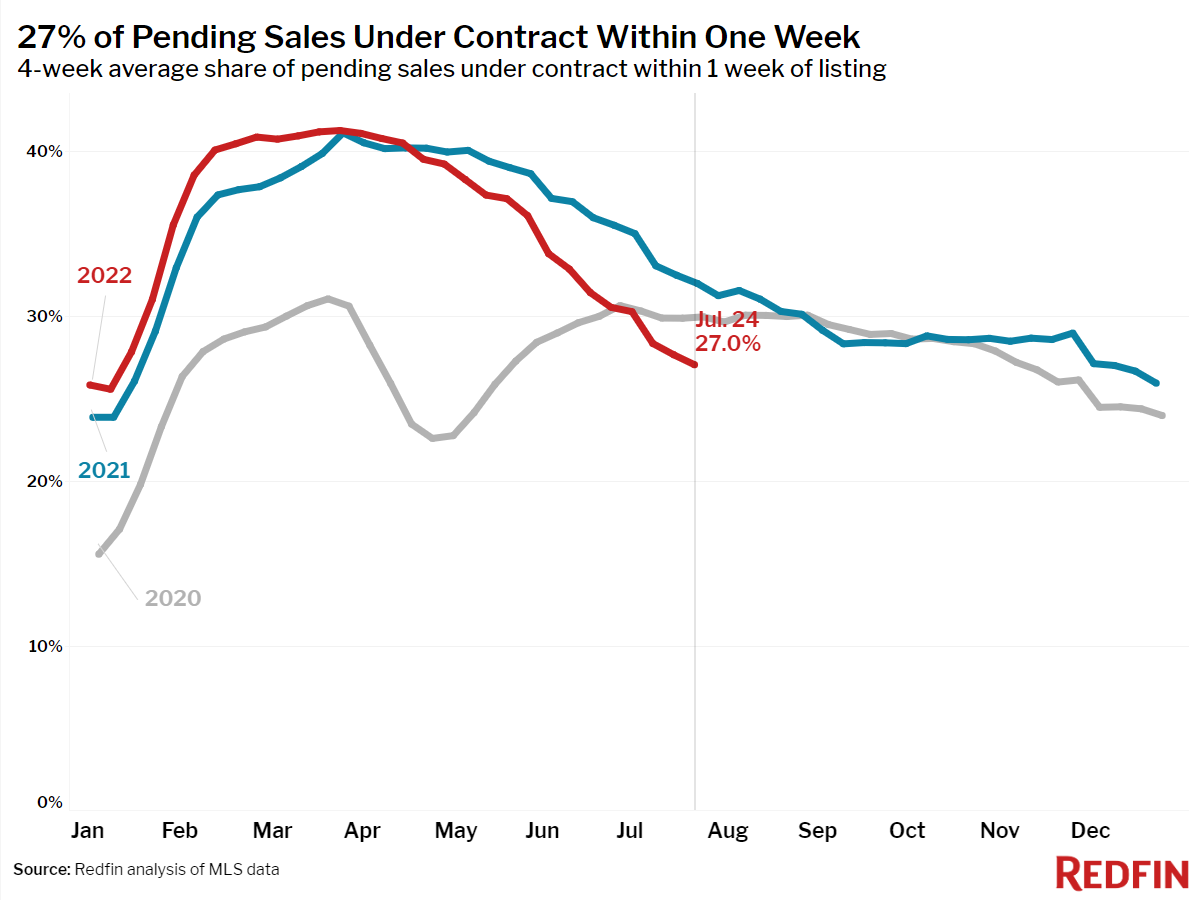
- 27% of homes that went under contract had an accepted offer within one week of hitting the market, down from 32% a year earlier.
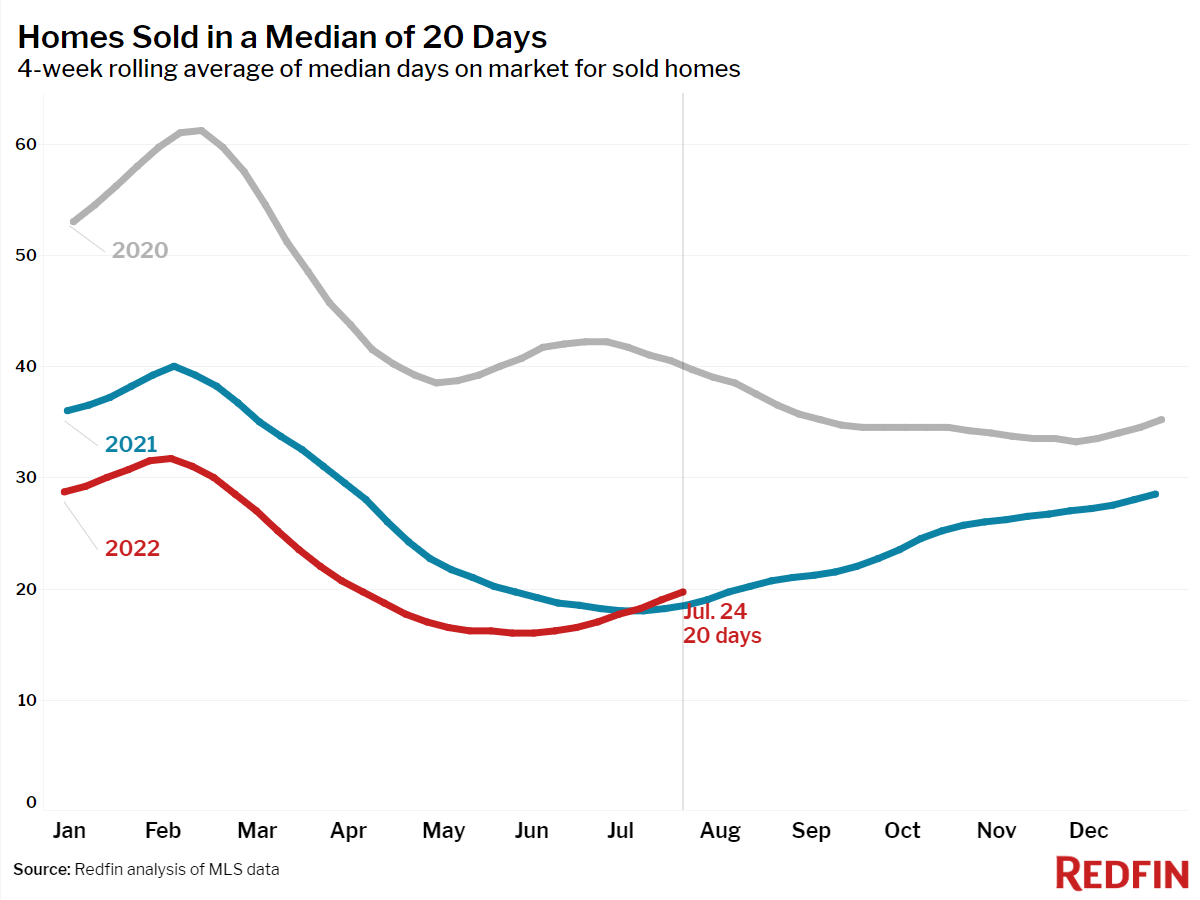
- Homes that sold were on the market for a median of 20 days, up from 18 days a year earlier and up from the record low of 16 days set in May and early June. Days on market is increasing off its low point for the year faster than it did in 2021, up 4 days in the past eight weeks, compared to a 3 day increase in the eight weeks after the low point in 2021.
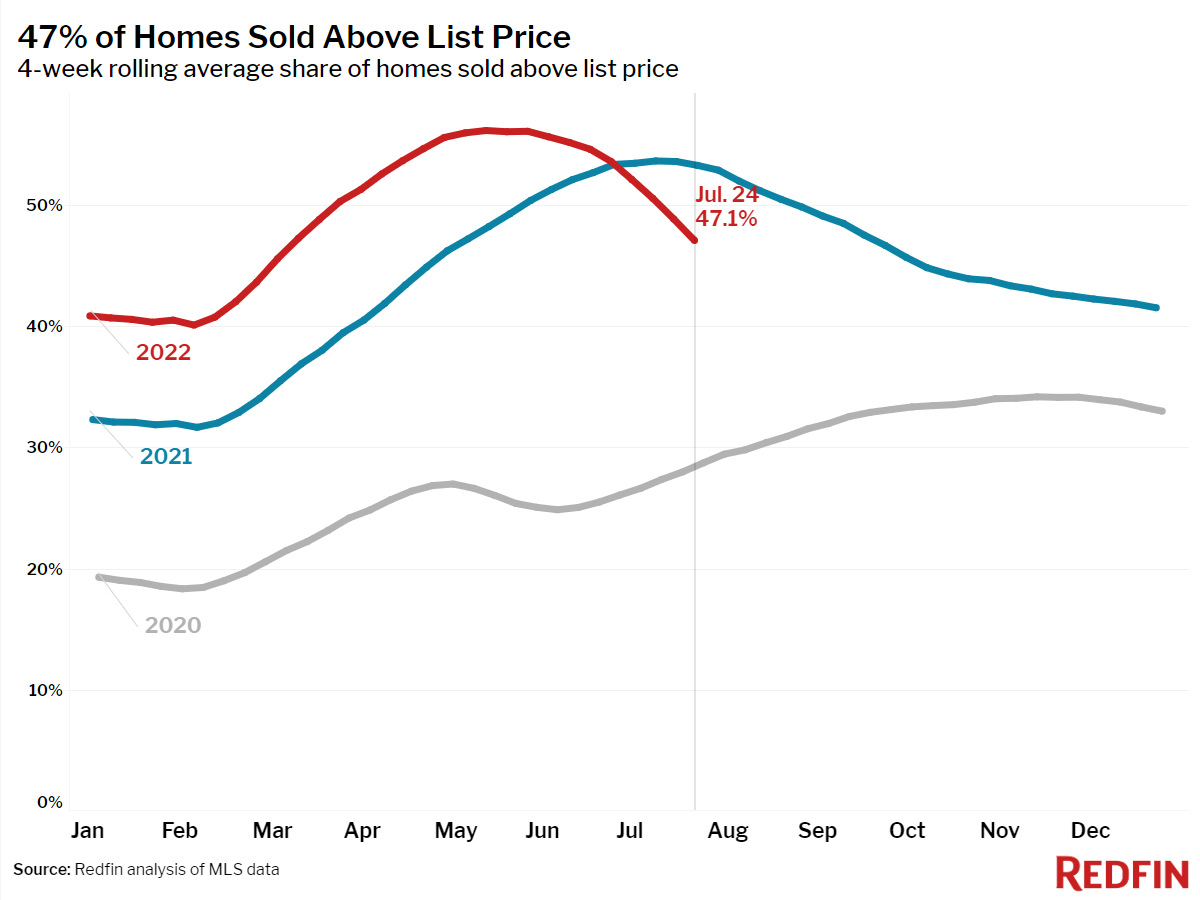
- 47% of homes sold above list price, down from 53% a year earlier.
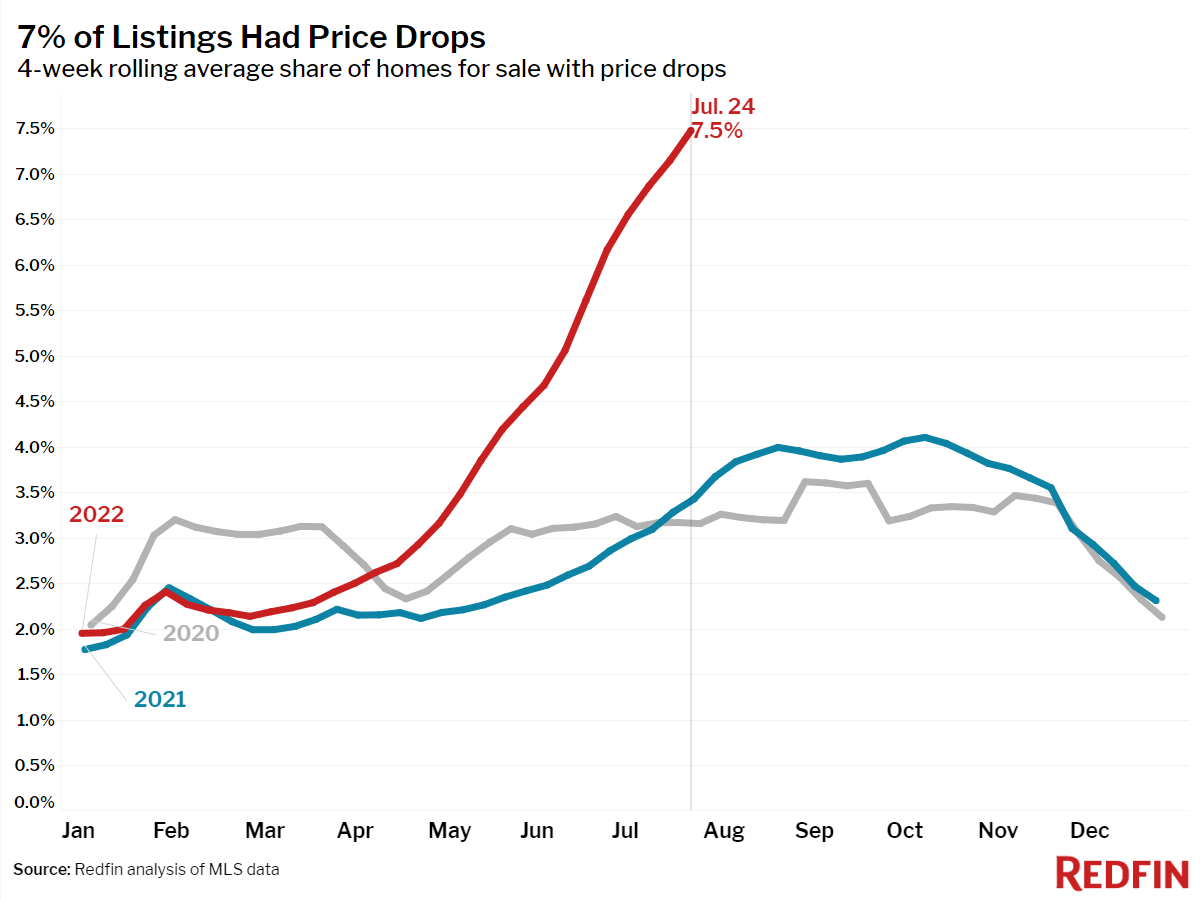
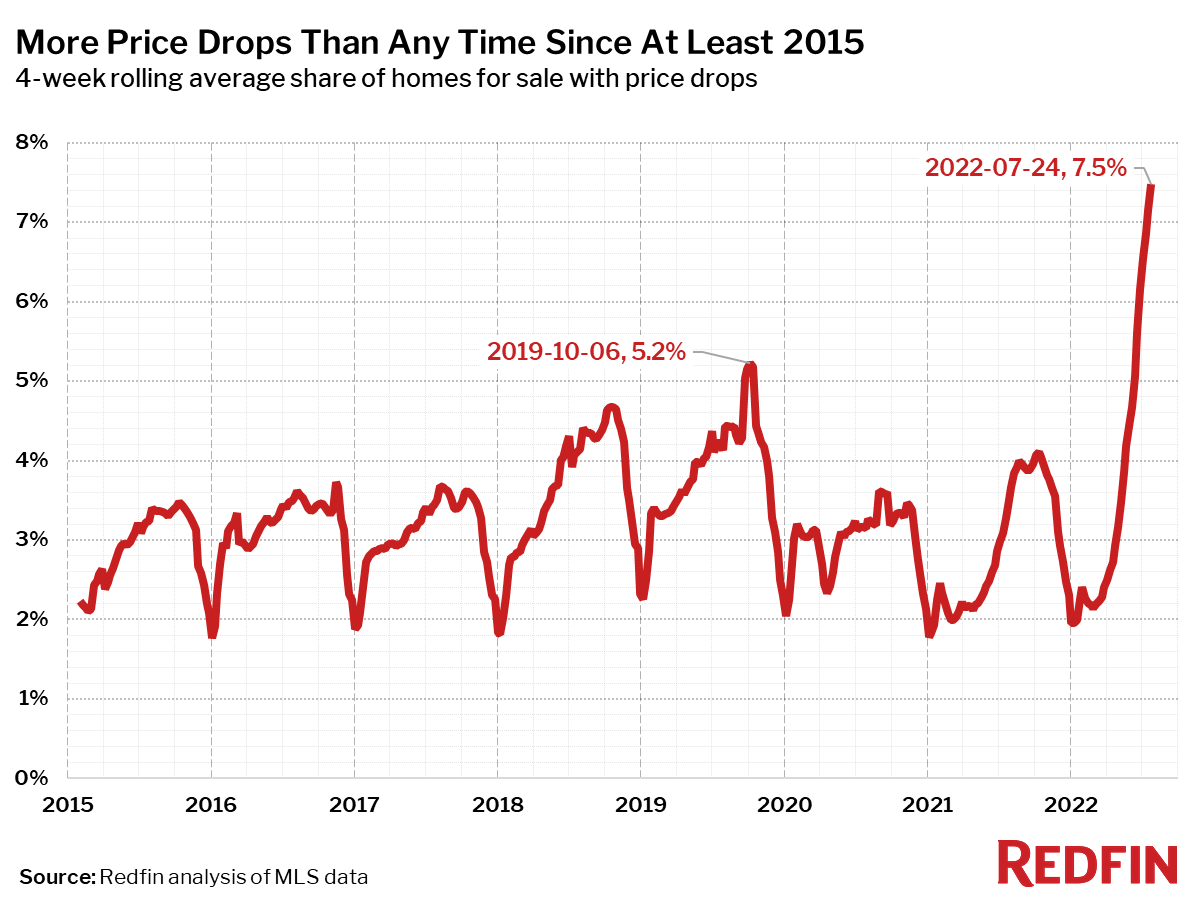
- On average, 7.5% of homes for sale each week had a price drop, a record high as far back as the data goes, through the beginning of 2015.
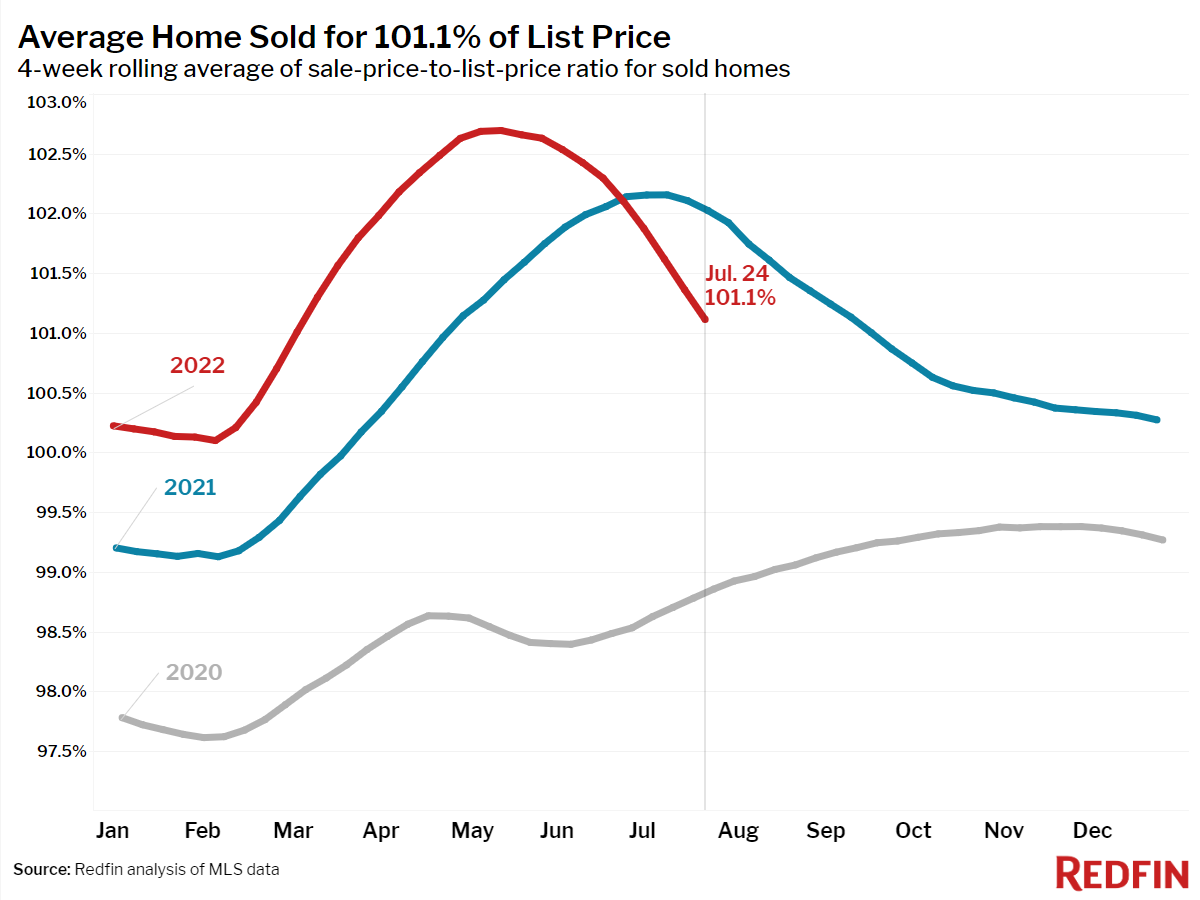
- The average sale-to-list price ratio, which measures how close homes are selling to their asking prices, declined to 101.1%. In other words, the average home sold for 1.1% above its asking price. This was down from 102% a year earlier.
Refer to our metrics definition page for explanations of all the metrics used in this report.