The supply of homes for sale is picking up in time for spring homebuying season, and improving inventory is attracting some buyers.
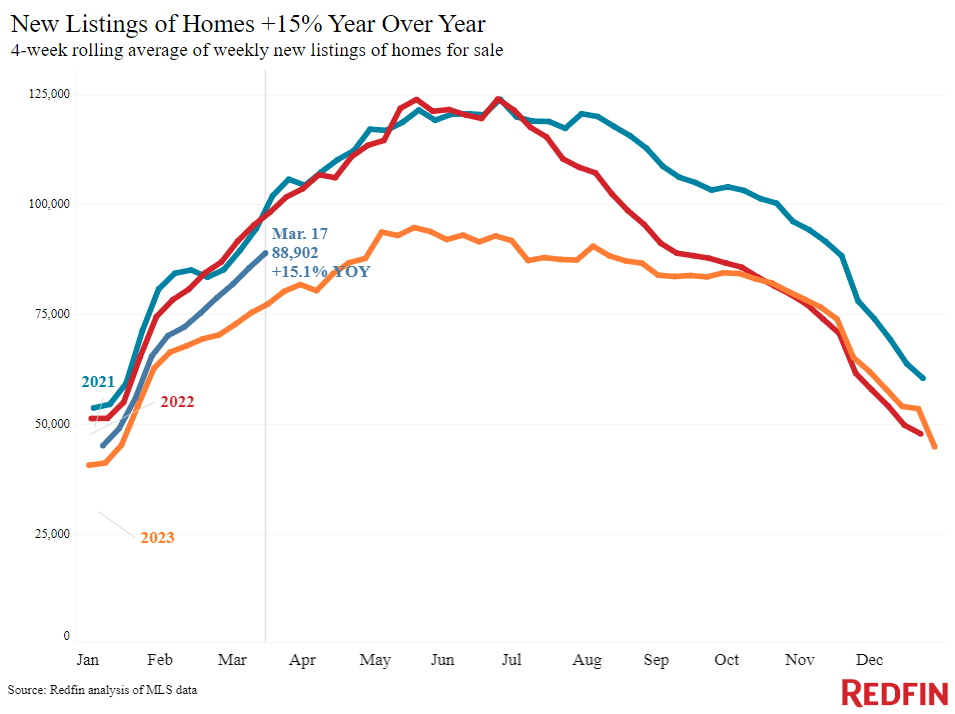
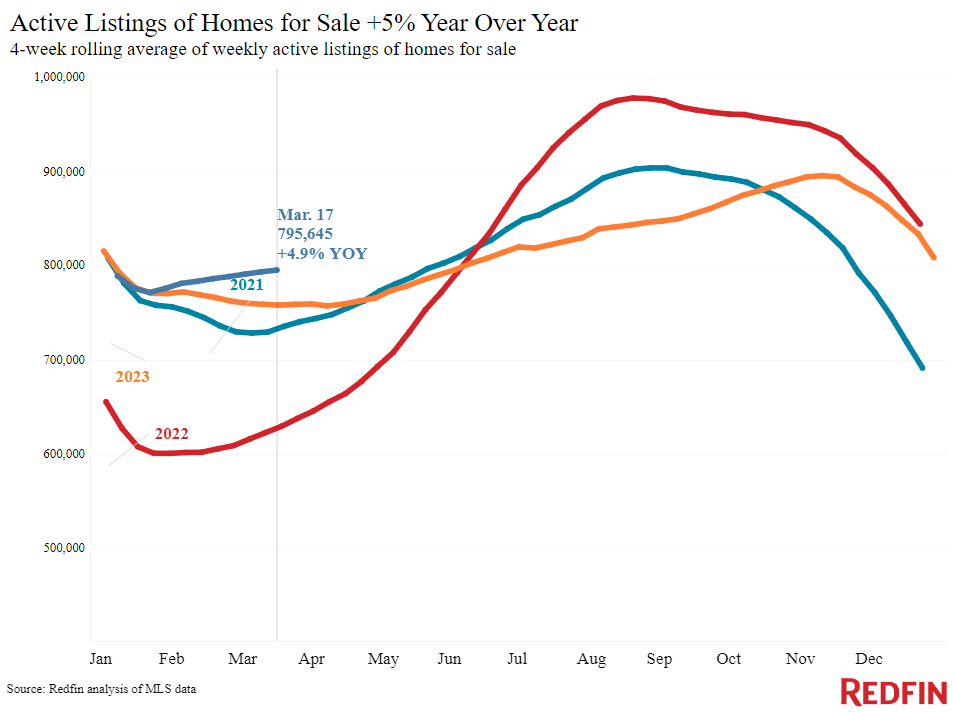
The total number of U.S. homes for sale climbed 5%, the biggest year-over-year uptick since May 2023, during the four weeks ending March 17. New listings rose 15%, the biggest increase since June 2021.
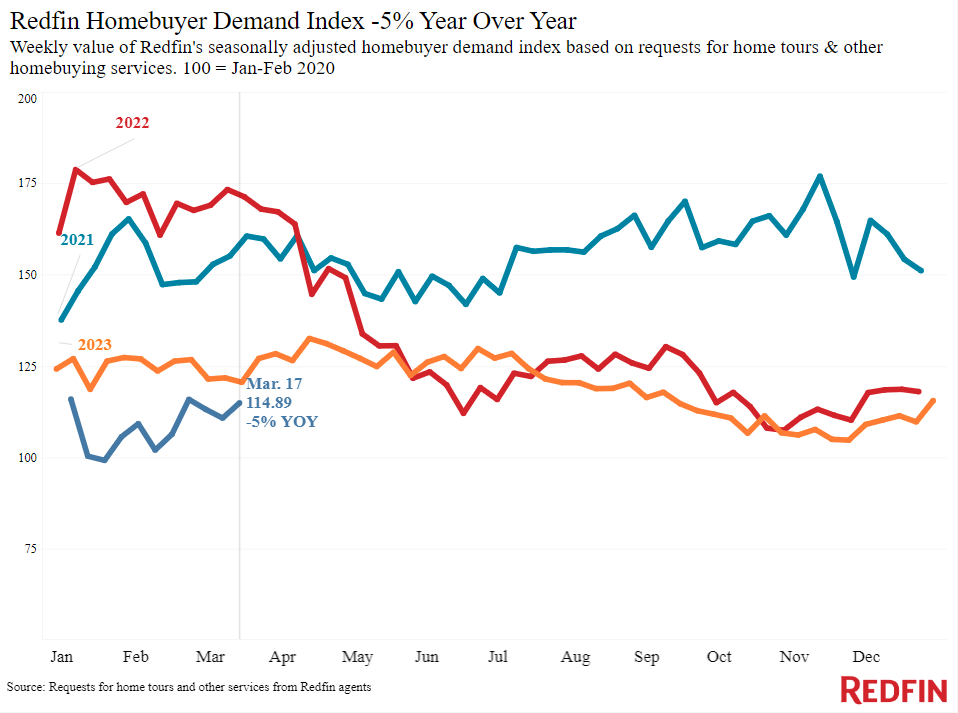
The surge in listings is bringing some buyers back to the market. Mortgage-purchase applications and Redfin’s Homebuyer Demand Index–a measure of requests for tours and other buying services from Redfin agents–are each up roughly 9% month over month.
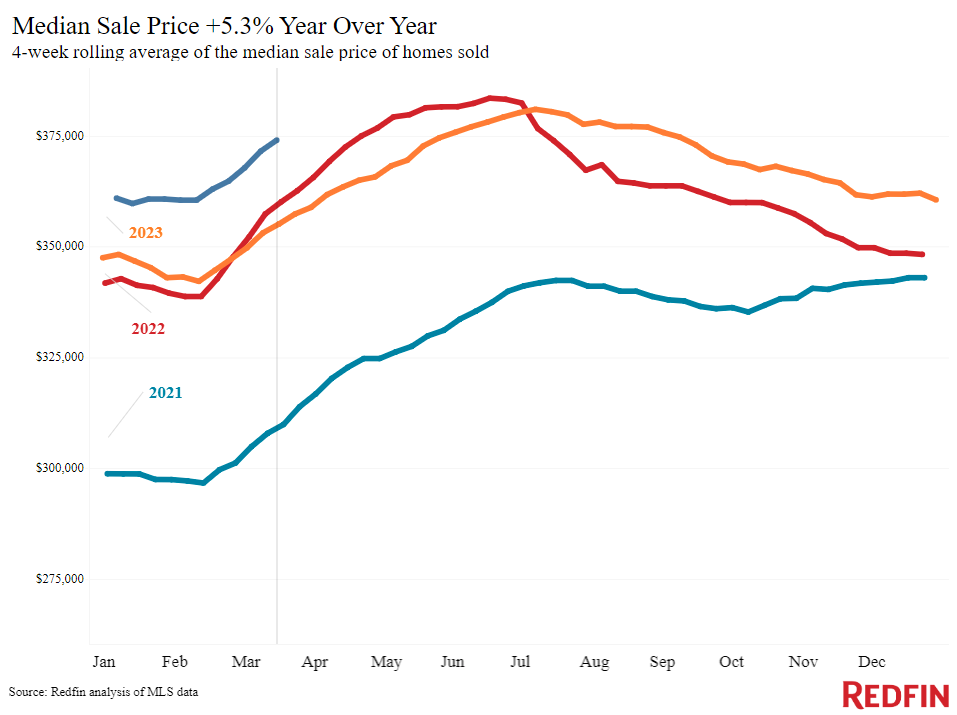
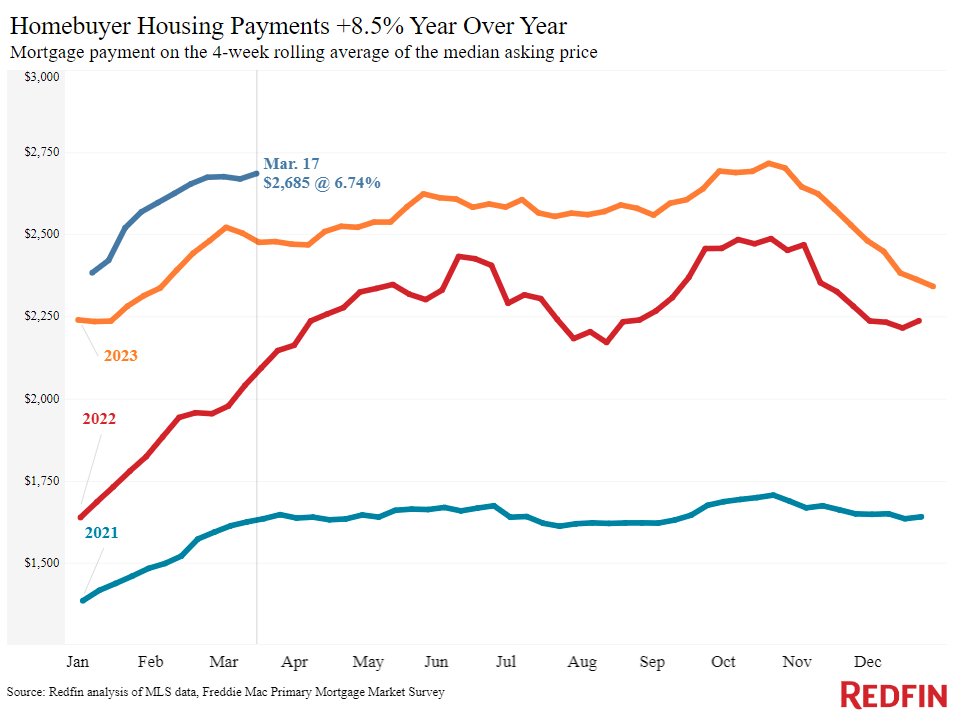
Increasing inventory has yet to dampen price growth. The median U.S. home-sale price is up 5.3% year over year, the second-biggest increase since October 2022, and the median monthly mortgage payment is just $31 shy of its all-time high due to elevated mortgage rates and prices. Redfin economists expect mortgage rates to gradually decline throughout 2024, an outlook that was little changed in the wake of this week’s Fed press conference, in which the Fed held interest rates steady.
Leading indicators
| Indicators of homebuying demand and activity | ||||
| Value (if applicable) | Recent change | Year-over-year change | Source | |
| Daily average 30-year fixed mortgage rate | 7.03% (March 20) | Up from 6.92% a week earlier | Up from 6.67% | Mortgage News Daily |
| Weekly average 30-year fixed mortgage rate | 6.74% (week ending March 14) | Down from 6.88% a week earlier; first decline after 5 weeks of increases | Up from 6.6% | Freddie Mac |
| Mortgage-purchase applications (seasonally adjusted) | Down 1% from a week earlier; up 9% from a month earlier (as of week ending March 15) | Down 14% | Mortgage Bankers Association | |
| Redfin Homebuyer Demand Index (seasonally adjusted) | Up 8% from a month earlier (as of week ending March 17) | Down 5% | Redfin Homebuyer Demand Index, a measure of requests for tours and other homebuying services from Redfin agents | |
| Google searches for “home for sale” | Essentially unchanged from a month earlier (as of March 18) | Down 18% | Google Trends | |
| Touring activity | Up 29% from the start of the year (as of March 19) | At this time last year, it was up 19% from the start of 2023 | ShowingTime, a home touring technology company | |
Key housing-market data
| U.S. highlights: Four weeks ending March 17, 2024
Redfin’s national metrics include data from 400+ U.S. metro areas, and is based on homes listed and/or sold during the period. Weekly housing-market data goes back through 2015. Subject to revision. |
|||
| Four weeks ending March 17, 2024 | Year-over-year change | Notes | |
| Median sale price | $374,047 | 5.3% | Biggest increase since Oct. 2022 (except the 4 weeks ending Feb. 11, when there was a 5.4% increase) |
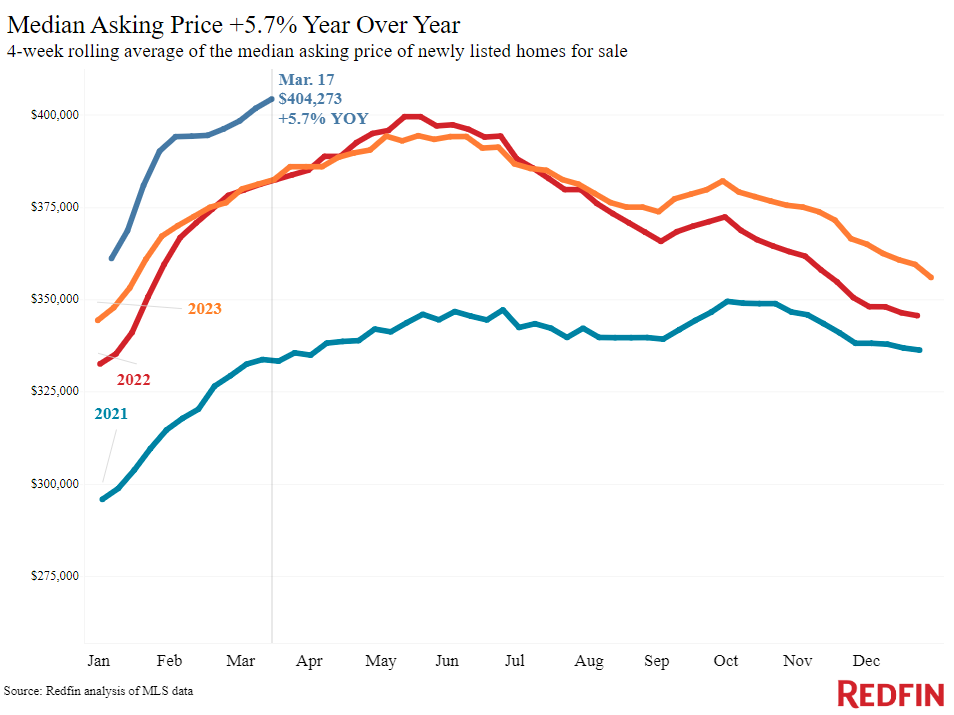
| Median asking price | $404,273 | 5.7% | |
| Median monthly mortgage payment | $2,685 at a 6.74% mortgage rate | 8.5% | Just $31 shy of all-time high set in October 2023 |
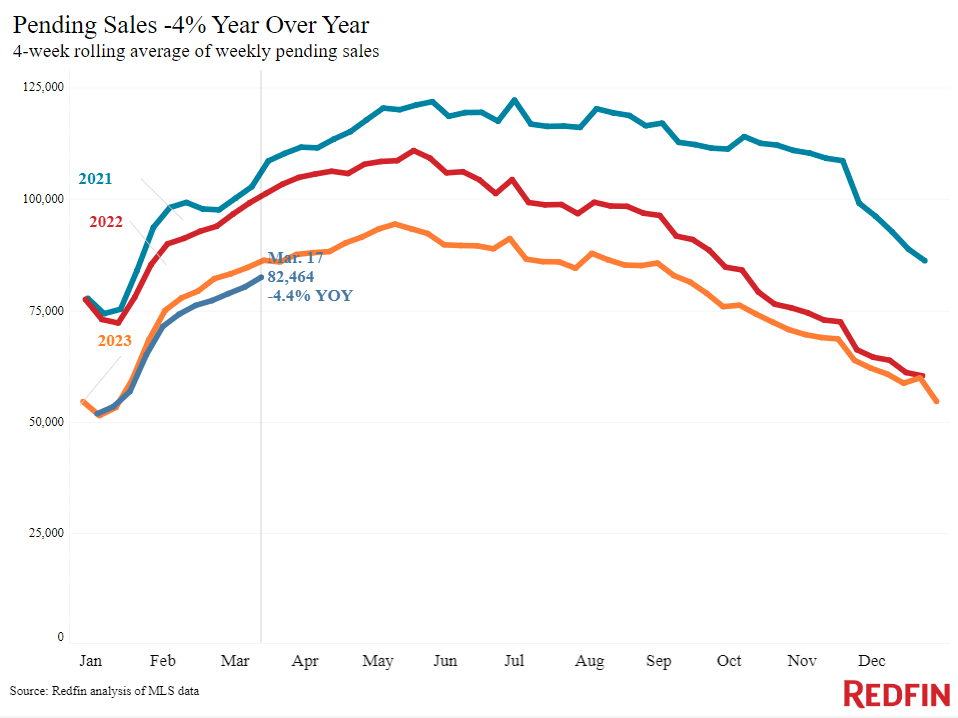
| Pending sales | 82,464 | -4.4% | |
| New listings | 88,902 | 15.1% | Biggest increase since June 2021 |
| Active listings | 795,645 | 4.9% | Biggest increase since May 2023 |
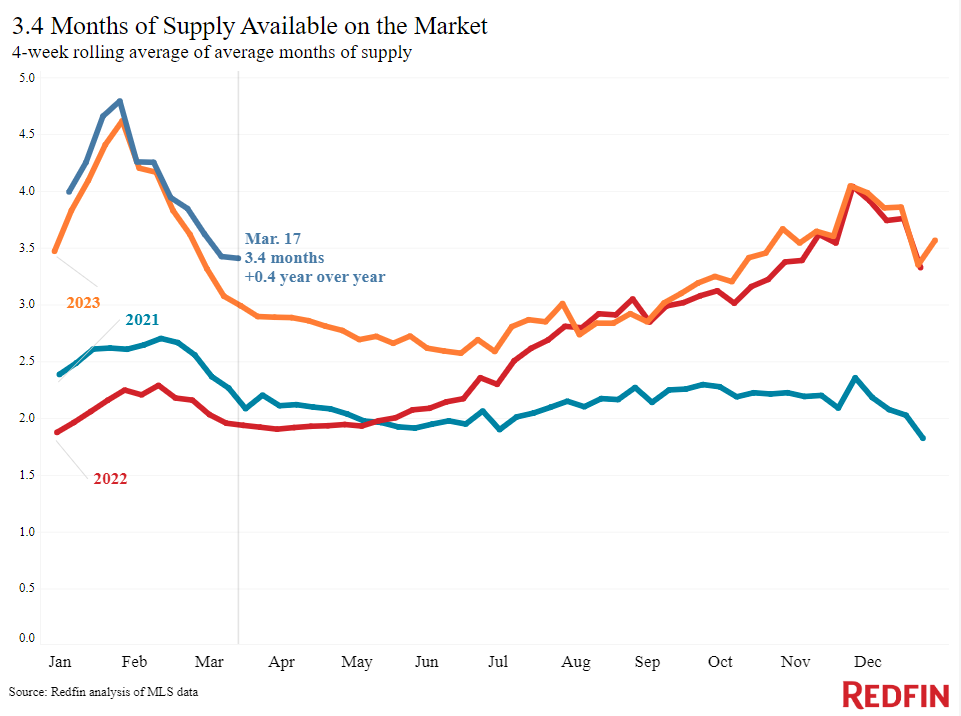
| Months of supply | 3.4 months | +0.4 pts. | 4 to 5 months of supply is considered balanced, with a lower number indicating seller’s market conditions. |
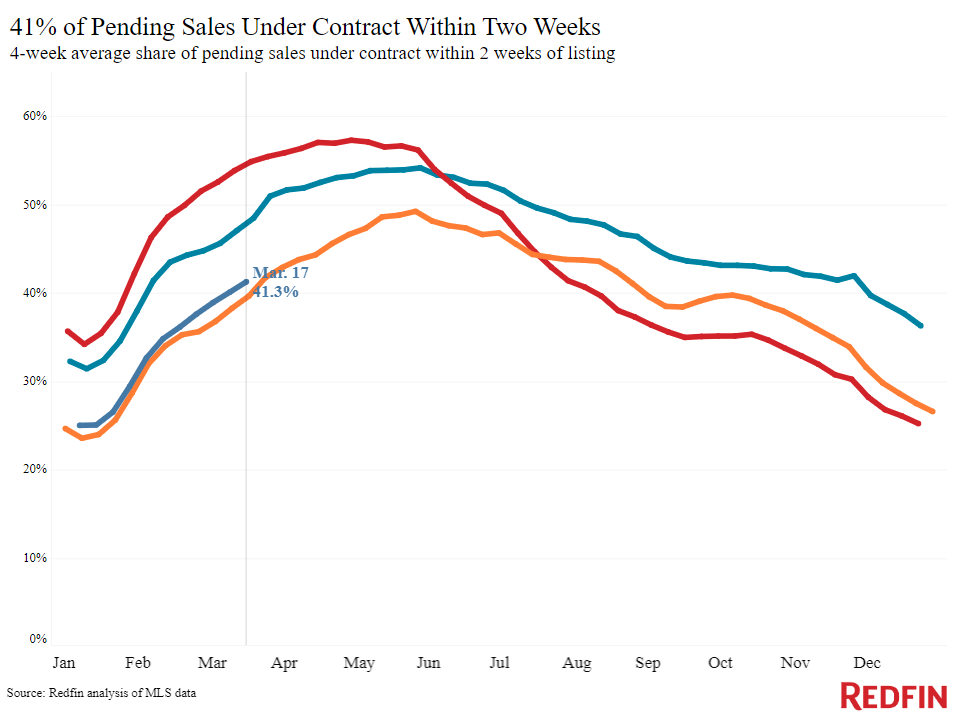
| Share of homes off market in two weeks | 41.3% | Up from 40% | |
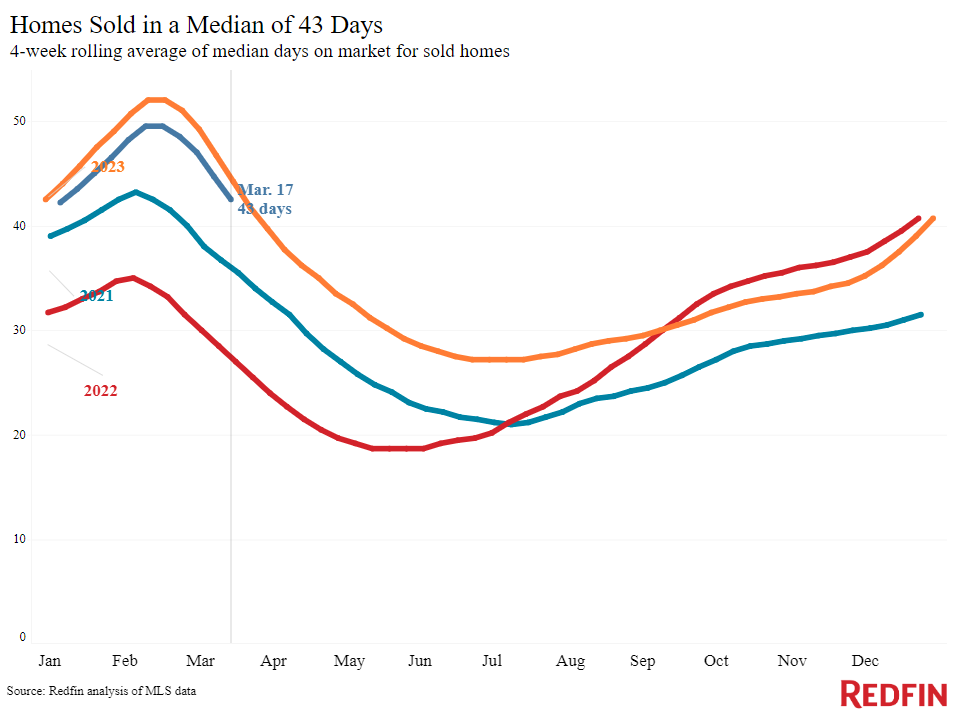
| Median days on market | 43 | -1 day | |
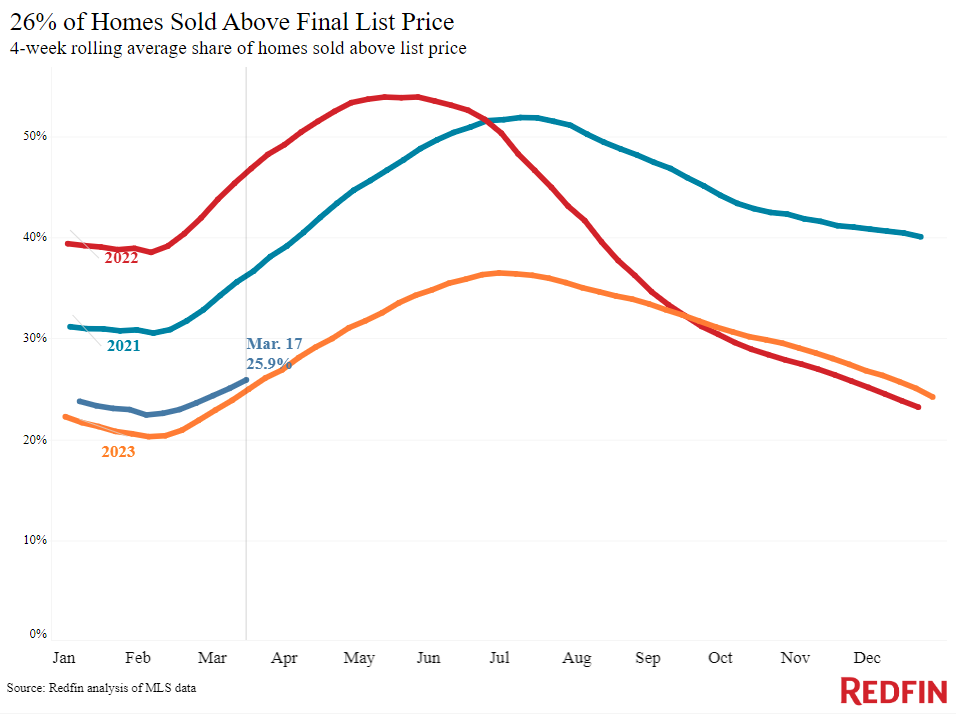
| Share of homes sold above list price | 25.9% | Up from 25% | |
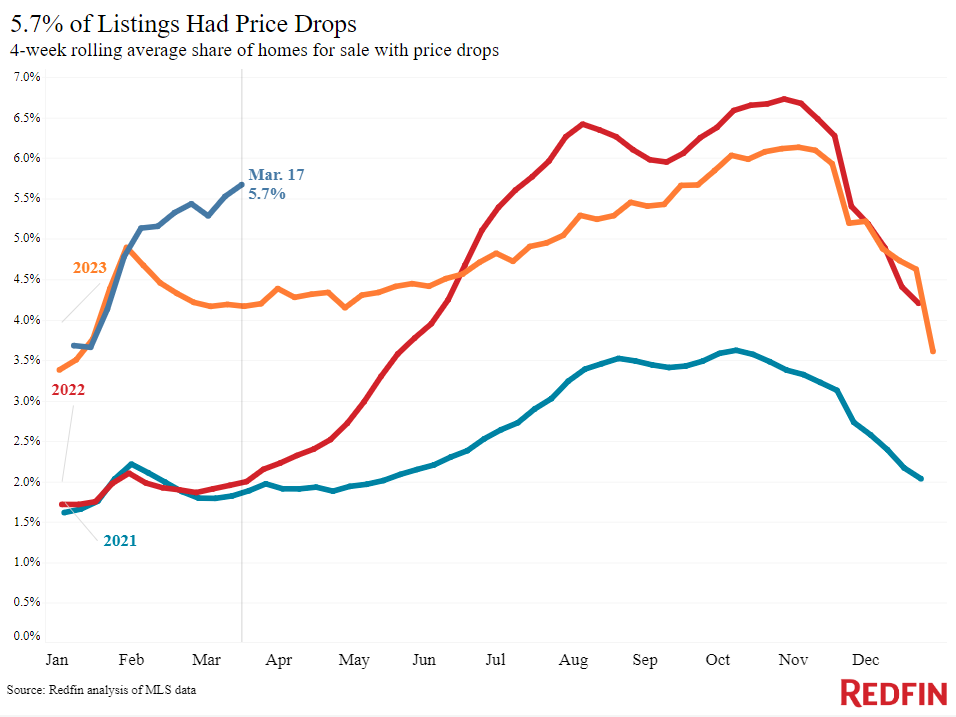
| Share of homes with a price drop | 5.7% | +1.5 pts. | |
| Average sale-to-list price ratio | 98.7% | +0.3 pts. | |
|
Metro-level highlights: Four weeks ending March 17, 2024 Redfin’s metro-level data includes the 50 most populous U.S. metros. Select metros may be excluded from time to time to ensure data accuracy. |
|||
|---|---|---|---|
| Metros with biggest year-over-year increases | Metros with biggest year-over-year decreases | Notes | |
|
Median sale price |
San Jose, CA (18.9%)
Miami (15.6%) West Palm Beach, FL (15.3%) Newark, NJ (14.6%) Anaheim, CA (14.5%) |
San Antonio, TX (-1.5%) |
Declined in just 1 metro |
| Pending sales | San Francisco (18.1%)
San Jose, CA (16.4%) Cincinnati (13.7%) Milwaukee (11.8%) Austin, TX (8.8%) |
Atlanta (-16.1%)
San Antonio, TX (-15.4%) Houston (-13.8%) Miami (-13.6%) Jacksonville, FL (-11.6%) |
Increased in 15 metros |
| New listings | San Jose, CA (40%)
Phoenix (31.9%) Sacramento, CA (29.9%) Tampa, FL (28.1%) Miami (27.6%) |
Atlanta (-4.6%)
Chicago (-0.7%) |
Declined in just 2 metros |
Refer to our metrics definition page for explanations of all the metrics used in this report.