San Francisco saw home prices fall 7% year over year during the four weeks ending September 4.
A surge in mortgage rates over the holiday weekend sapped much of the remaining energy out of the housing market.
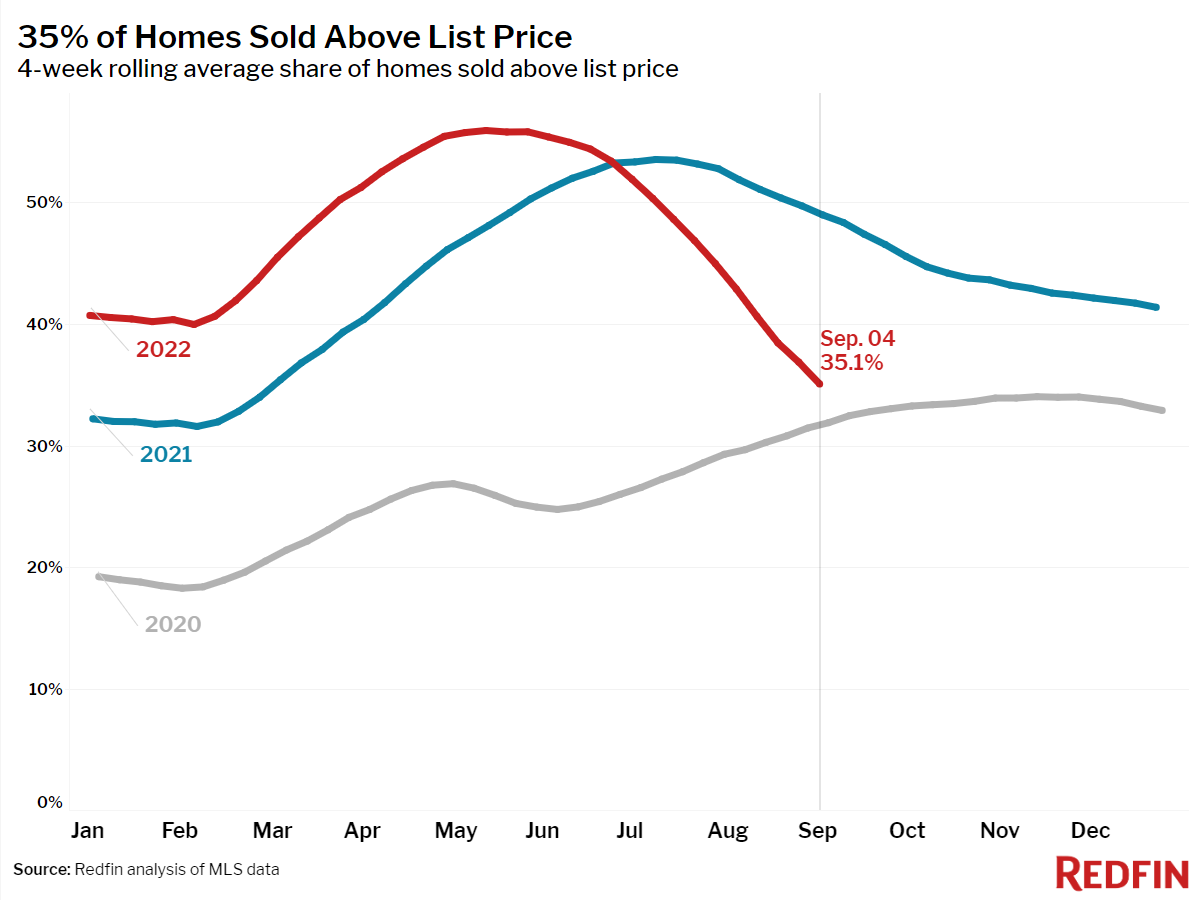
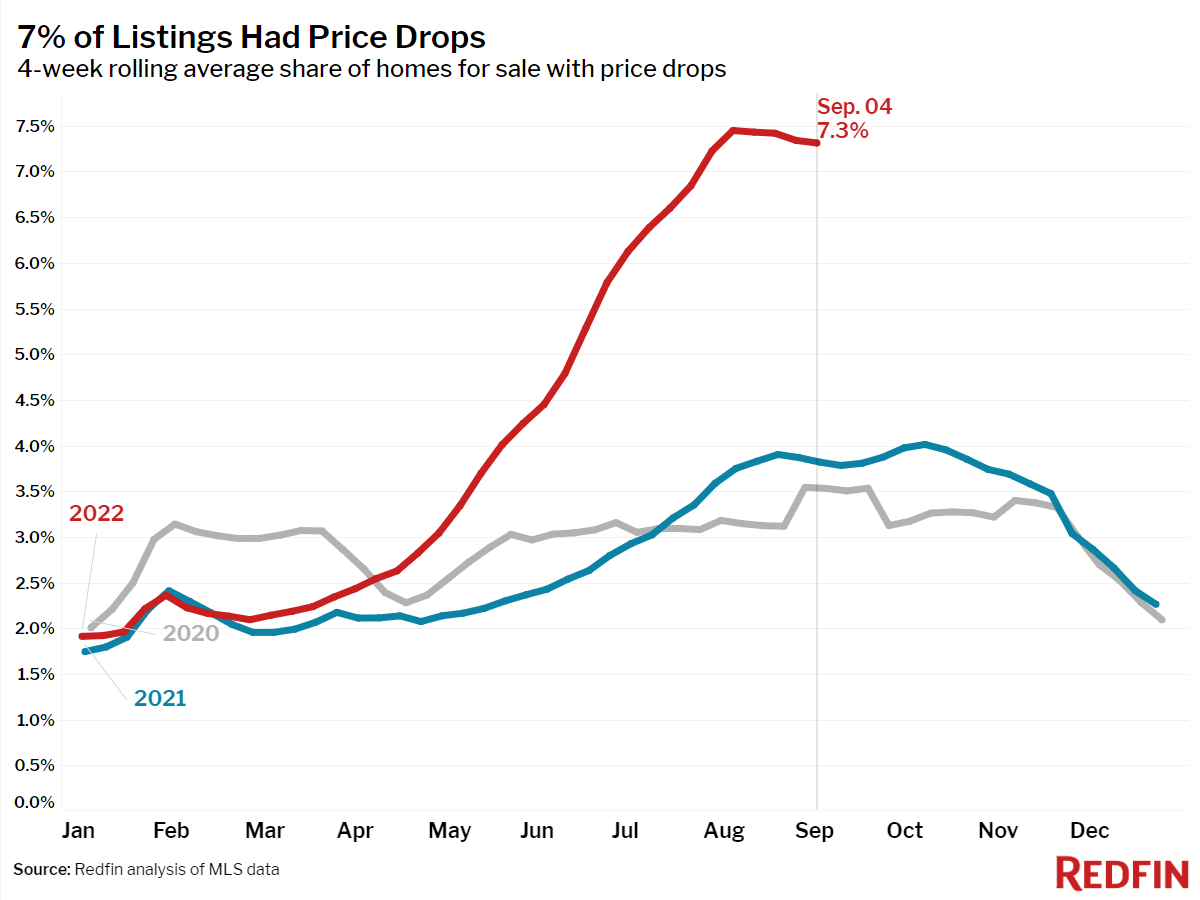
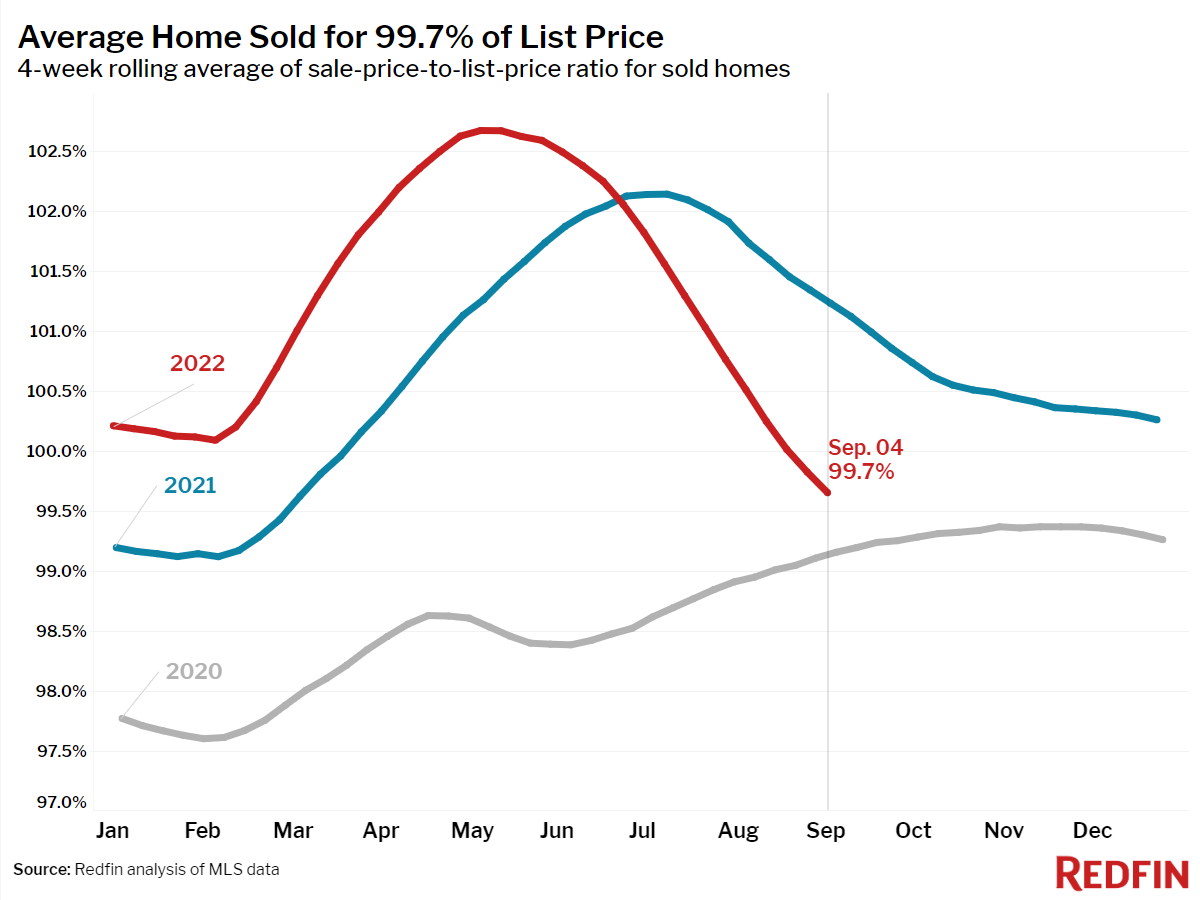
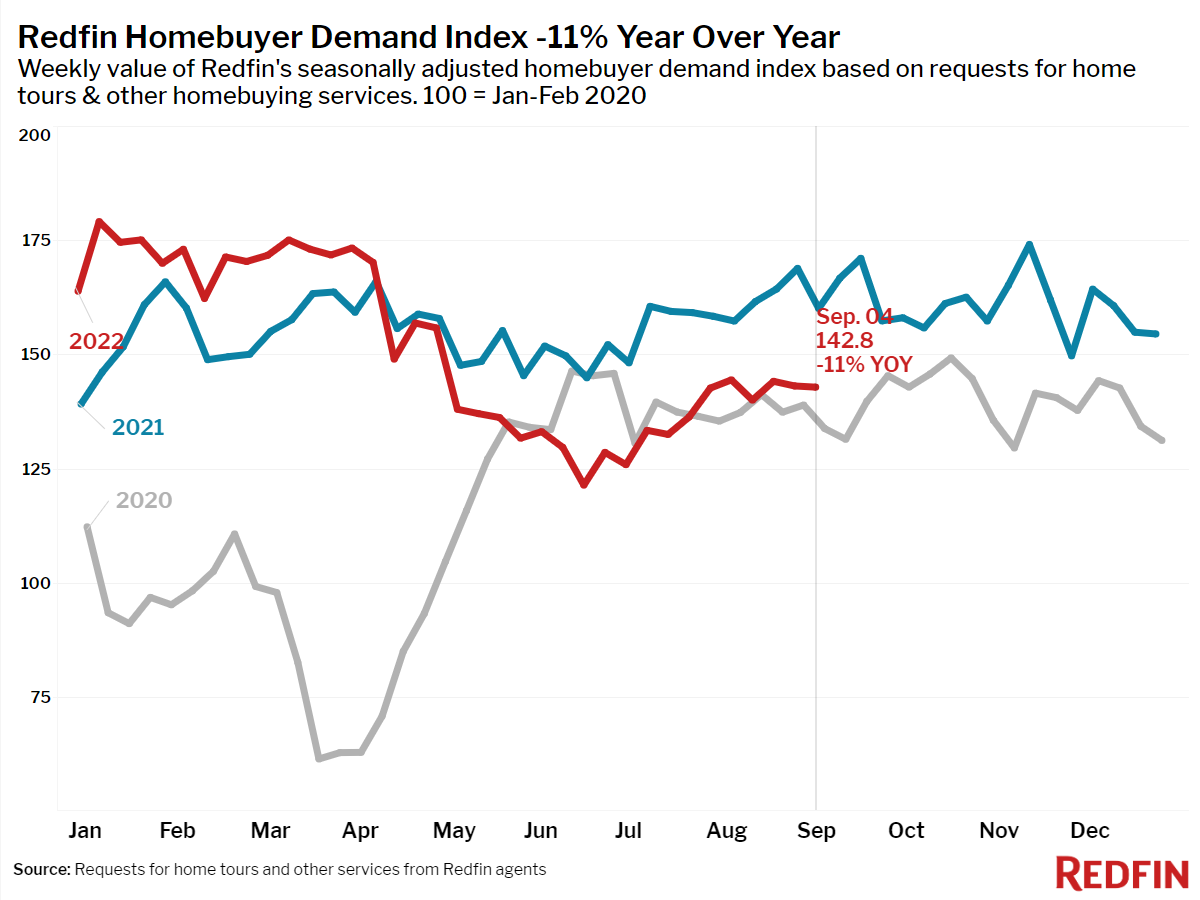
Home-touring activity took a nosedive, and the share of sellers dropping their price remained near a record high. As a result of decreasing demand, fewer homes sold above list price than any time since February 2021, and average sale-to-list price ratio fell to its lowest level since March 2021. The typical home that sold during the four weeks ending September 4 went for 0.3% below its final list price following a year and a half of the average home selling above list price.
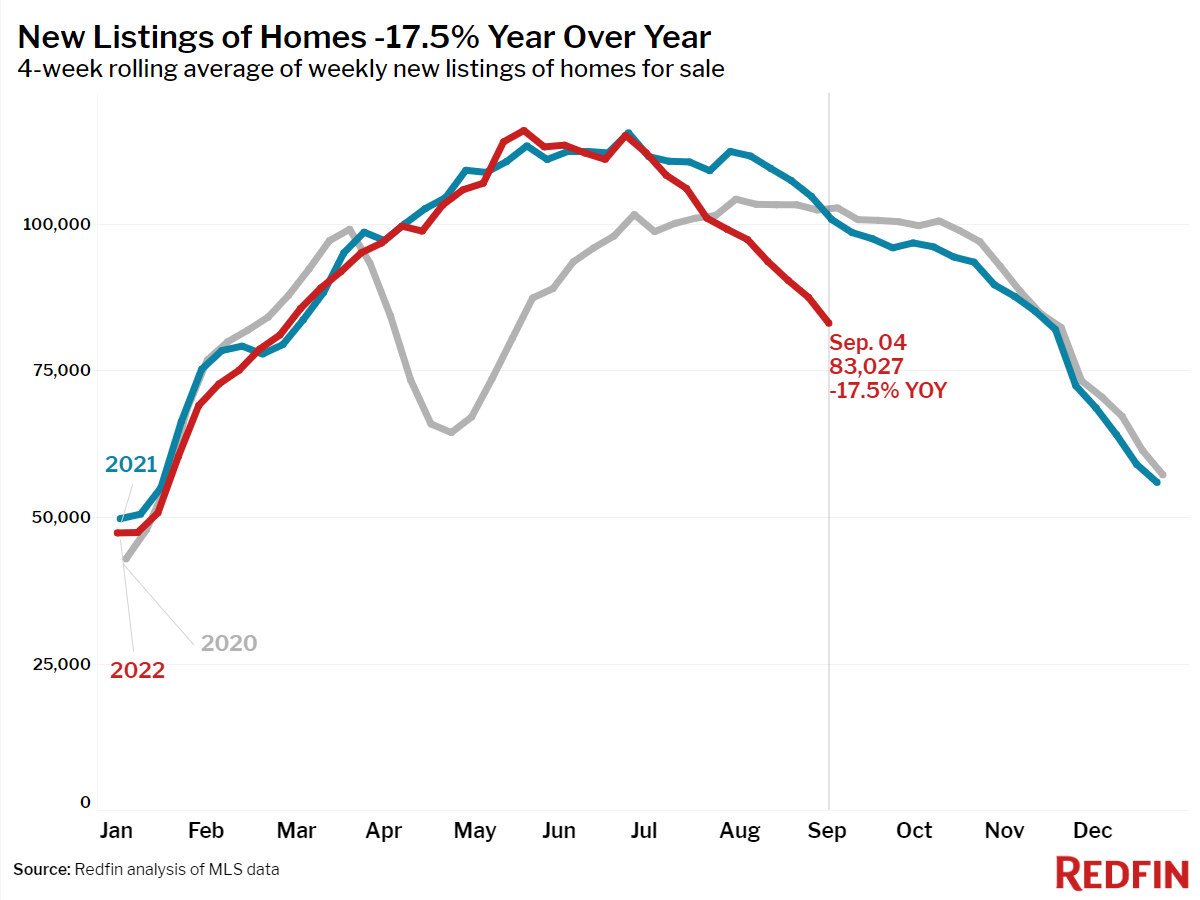
It seems that the mortgage-rate spike and declining demand discouraged homeowners from entering the market too, as new listings fell 18% year over year.
“The housing market always cools down this time of year, but this year, I expect fall and winter to be especially frigid as sales dry up more than usual,” said Redfin Chief Economist Daryl Fairweather. “Thanks largely to mortgage rates near or even above 6%, potential homebuyers and sellers are focusing on the back-to-school season and enjoying the last days of summer rather than getting into an uncertain market. It may feel like you are playing roulette when it comes to timing when to lock your mortgage rate, but just remember you can refinance when eventually rates do turn down.”
Leading indicators of homebuying activity:
- For the week ending September 8, 30-year mortgage rates rose to 5.89%, their highest level since November 2008.
- Fewer people searched for “homes for sale” on Google. Searches during the week ending September 3 were down 25% from a year earlier.
- The seasonally adjusted Redfin Homebuyer Demand Index—a measure of requests for home tours and other home-buying services from Redfin agents—was up 18% from the 2022 low in June during the week ending September 4, but was down 11% year over year.
- Touring activity as of September 4 was down 38% from the start of the year, compared to a 3% increase at the same time last year, according to home tour technology company ShowingTime.
- Mortgage purchase applications were down 1% week over week, seasonally adjusted, and were down 23% from a year earlier during the week ending September 2.
Key housing market takeaways for 400+ U.S. metro areas:
Unless otherwise noted, the data in this report covers the four-week period ending September 4. Redfin’s housing market data goes back through 2012.
Data based on homes listed and/or sold during the period:
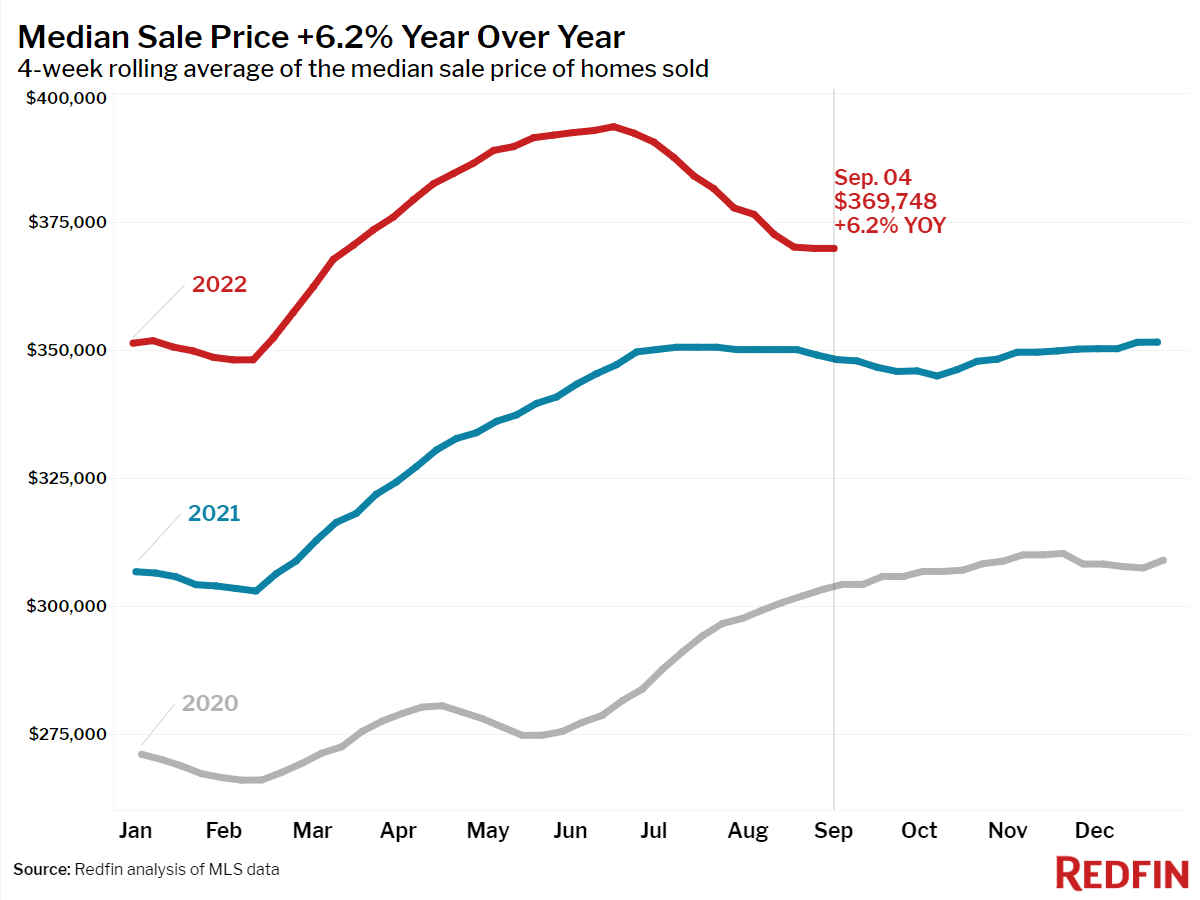
- The median home sale price was $369,748, up 6% year over year.
- Home sale prices in San Francisco fell 7% year over year, the biggest decline since July 2022. San Francisco and neighboring Oakland, CA, where prices fell 1.4%, were the only two metro areas that saw year-over-year median-sale-price declines.
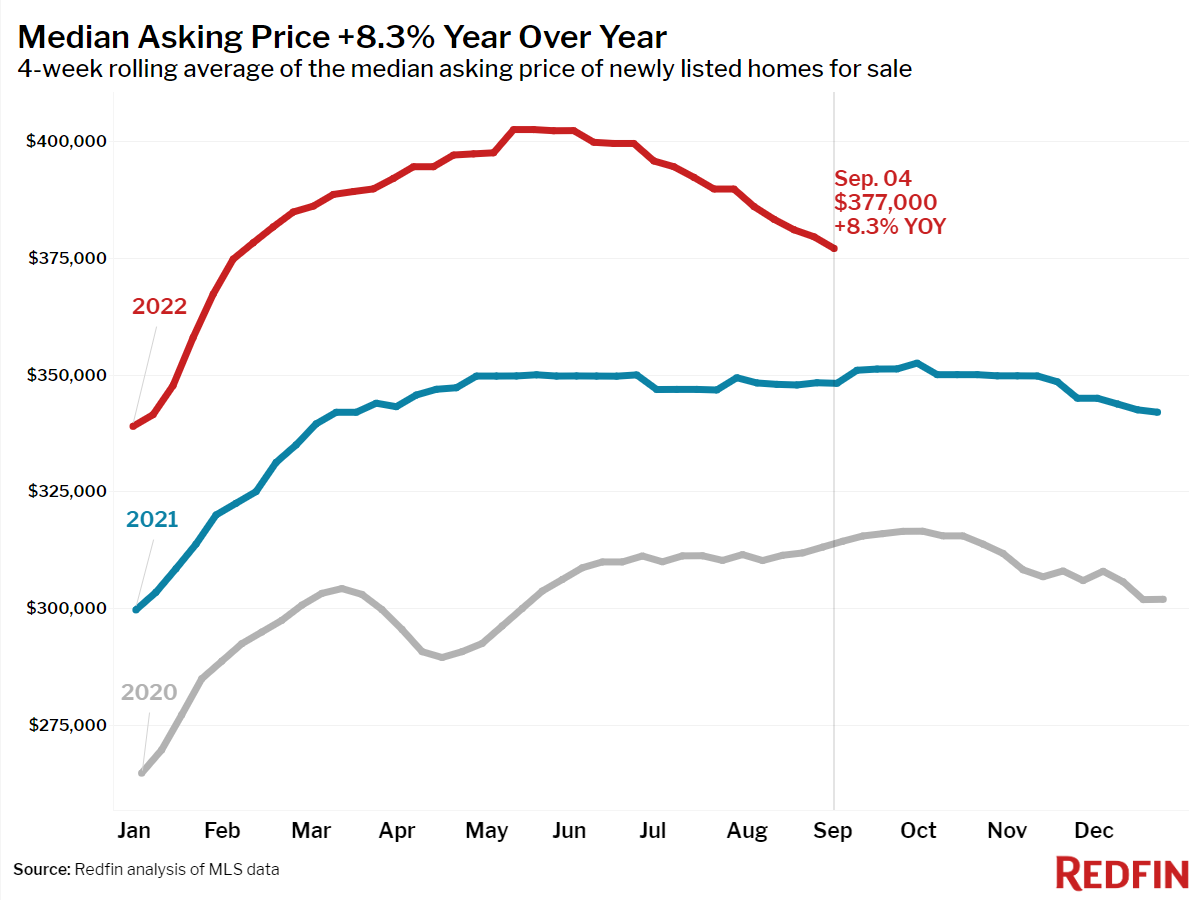
- The median asking price of newly listed homes increased 8% year over year to $377,000.
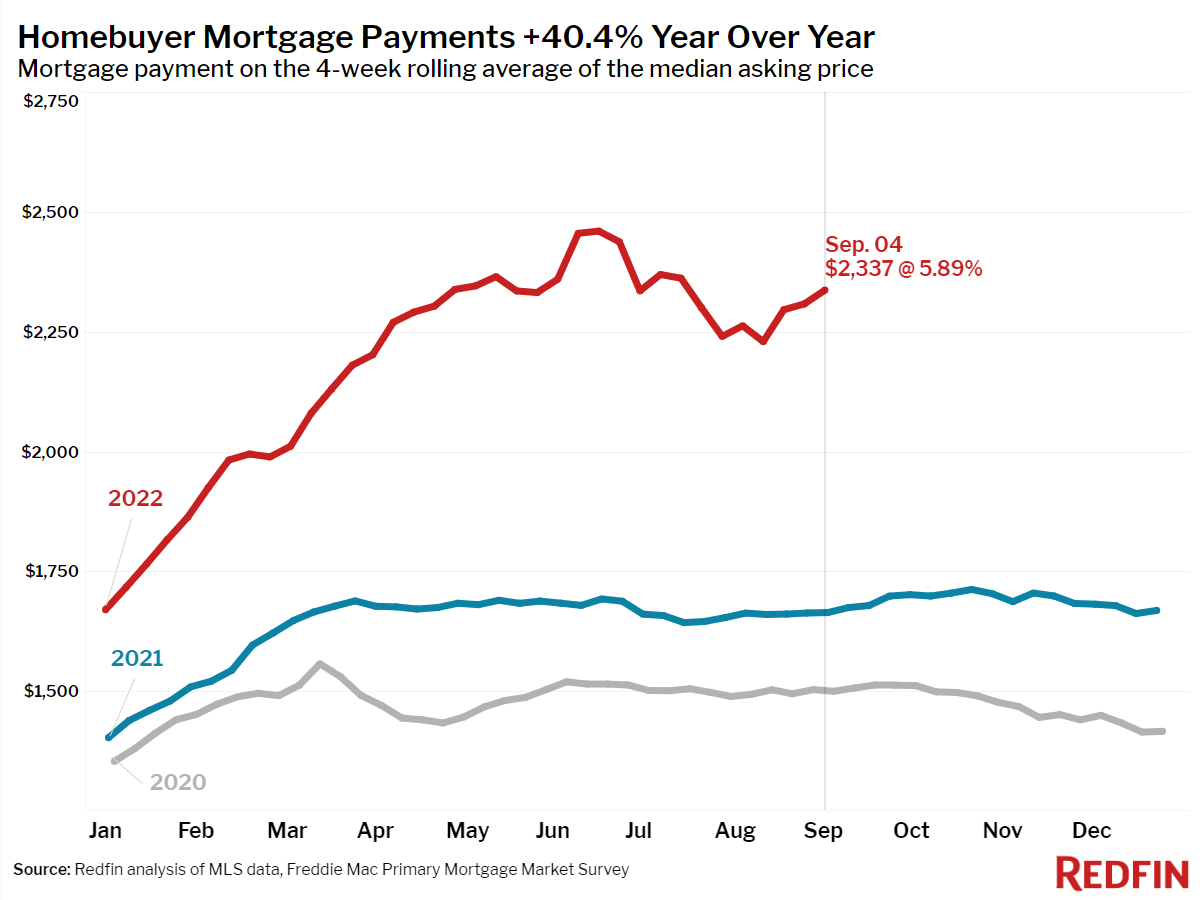
- The monthly mortgage payment on the median asking price home was $2,337 at the current 5.89% mortgage rate, up 40% from $1,664 a year earlier, when mortgage rates were 2.88%. That’s down from the peak of $2,461 reached during the four weeks ending June 19.
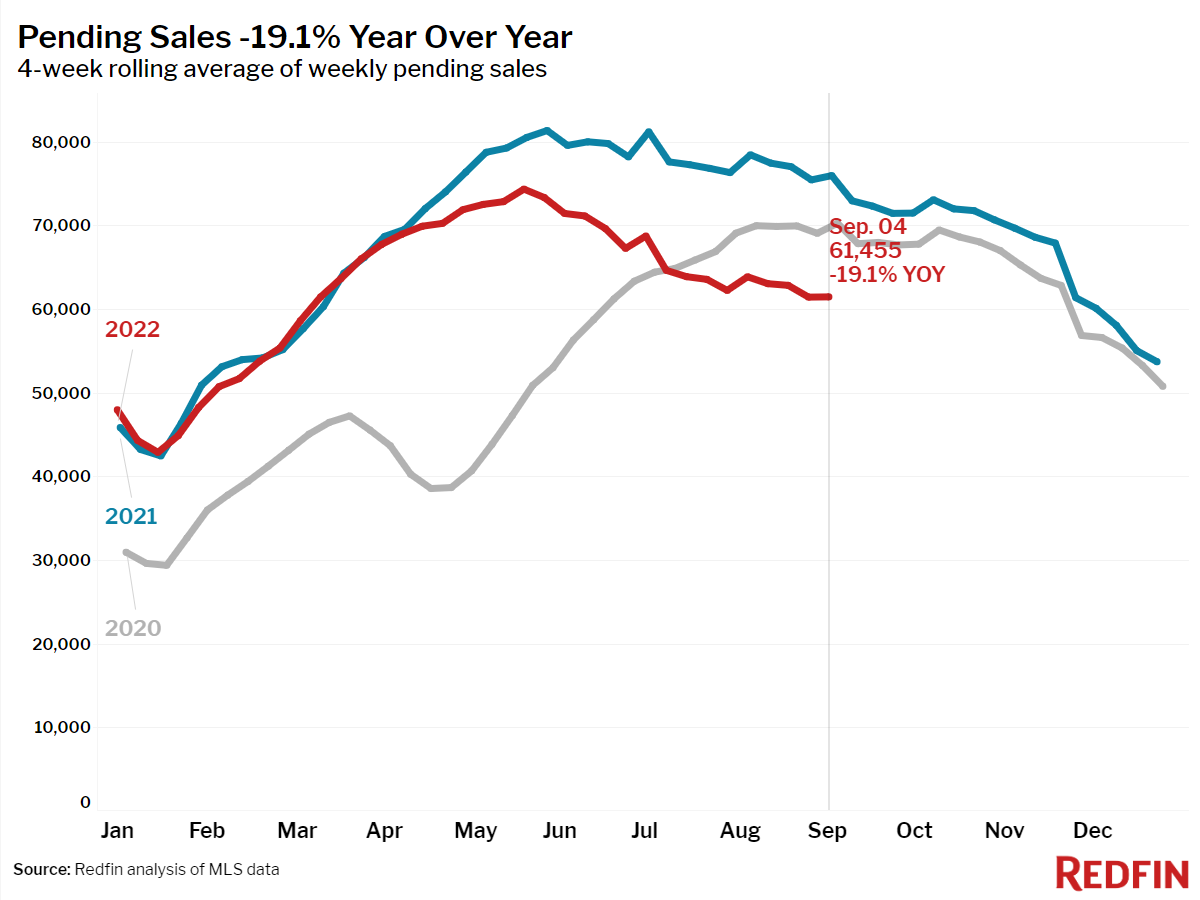
- Pending home sales were down 19% year over year, the largest decline since May 2020.
- New listings of homes for sale were down 18% from a year earlier, also the largest decline since May 2020.
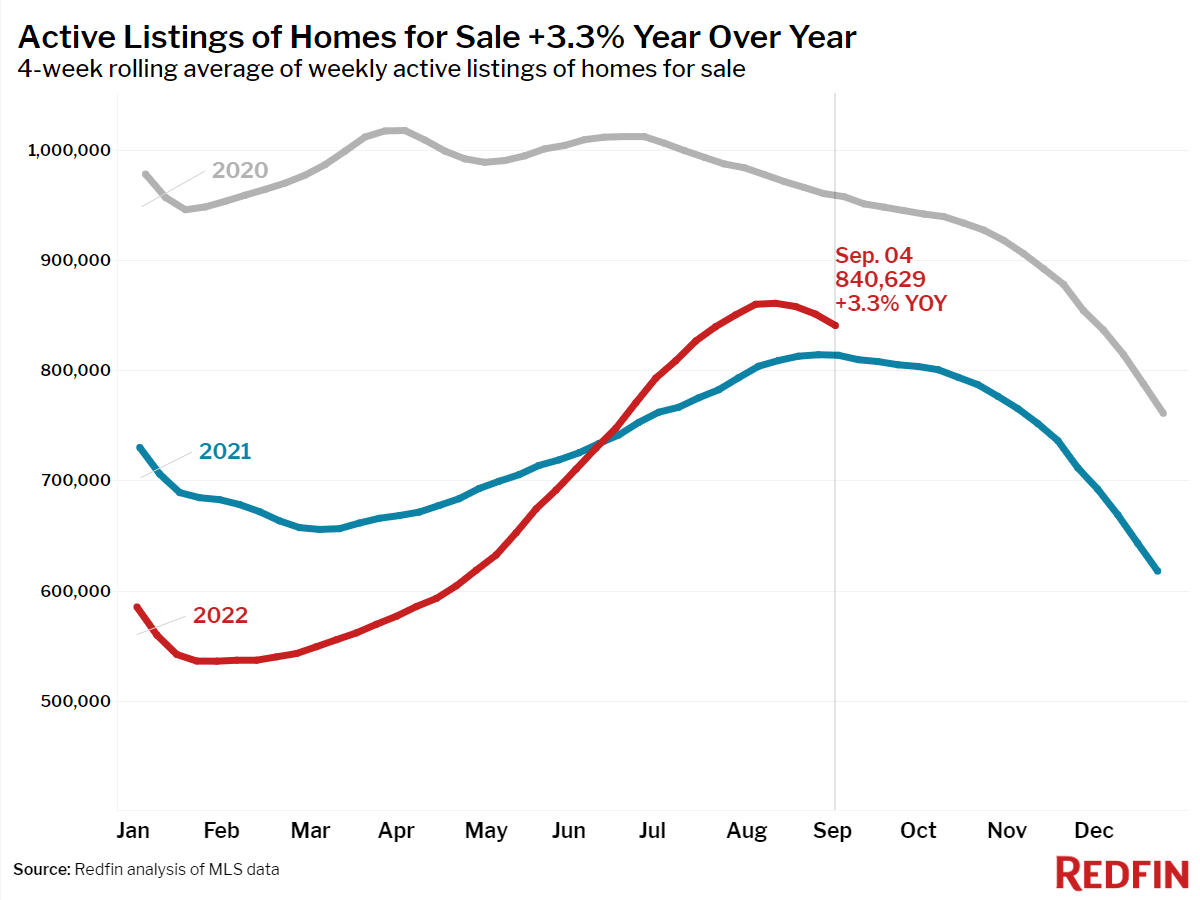
- Active listings (the number of homes listed for sale at any point during the period) fell 1.2% from the prior four-week period. On a year-over-year basis, they rose 3%.
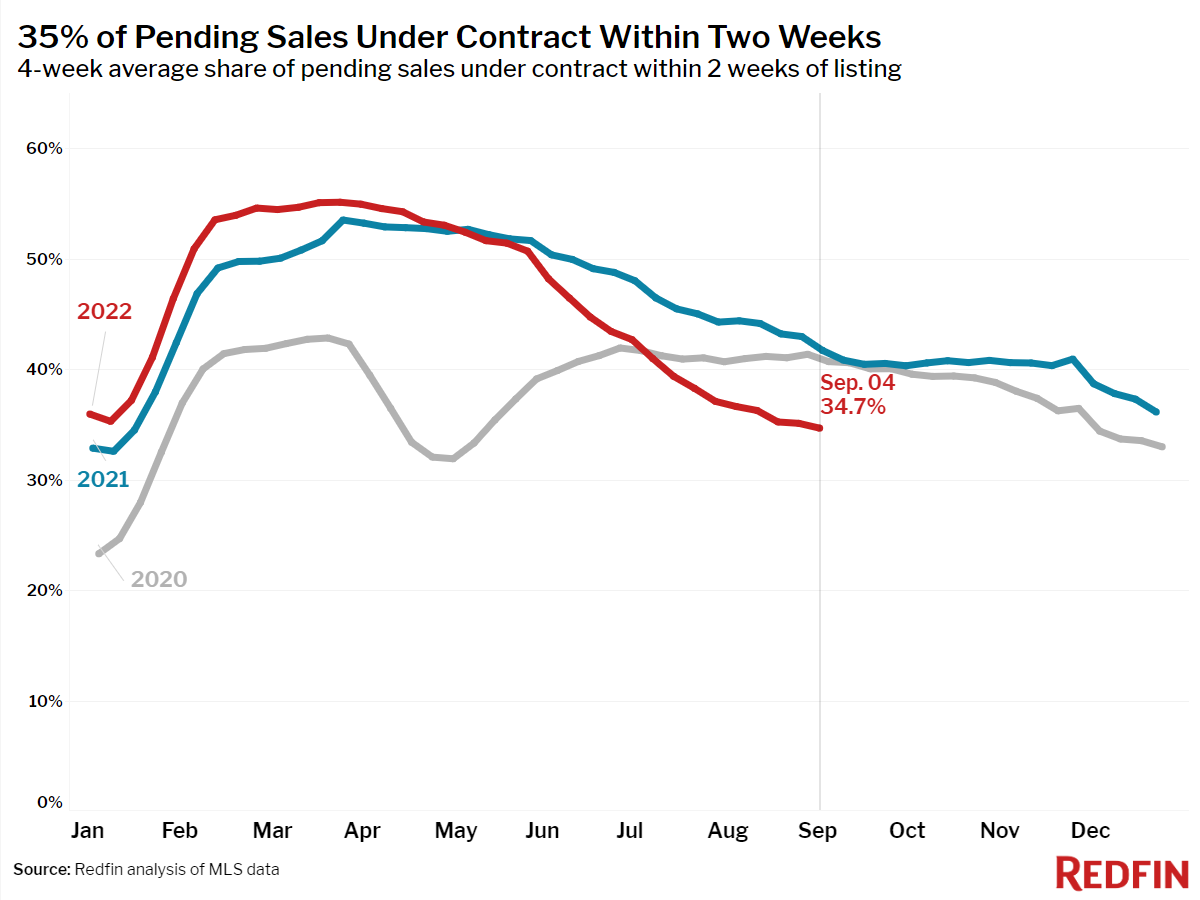
- 35% of homes that went under contract had an accepted offer within the first two weeks on the market, little changed from the prior four-week period but down from 42% a year earlier.
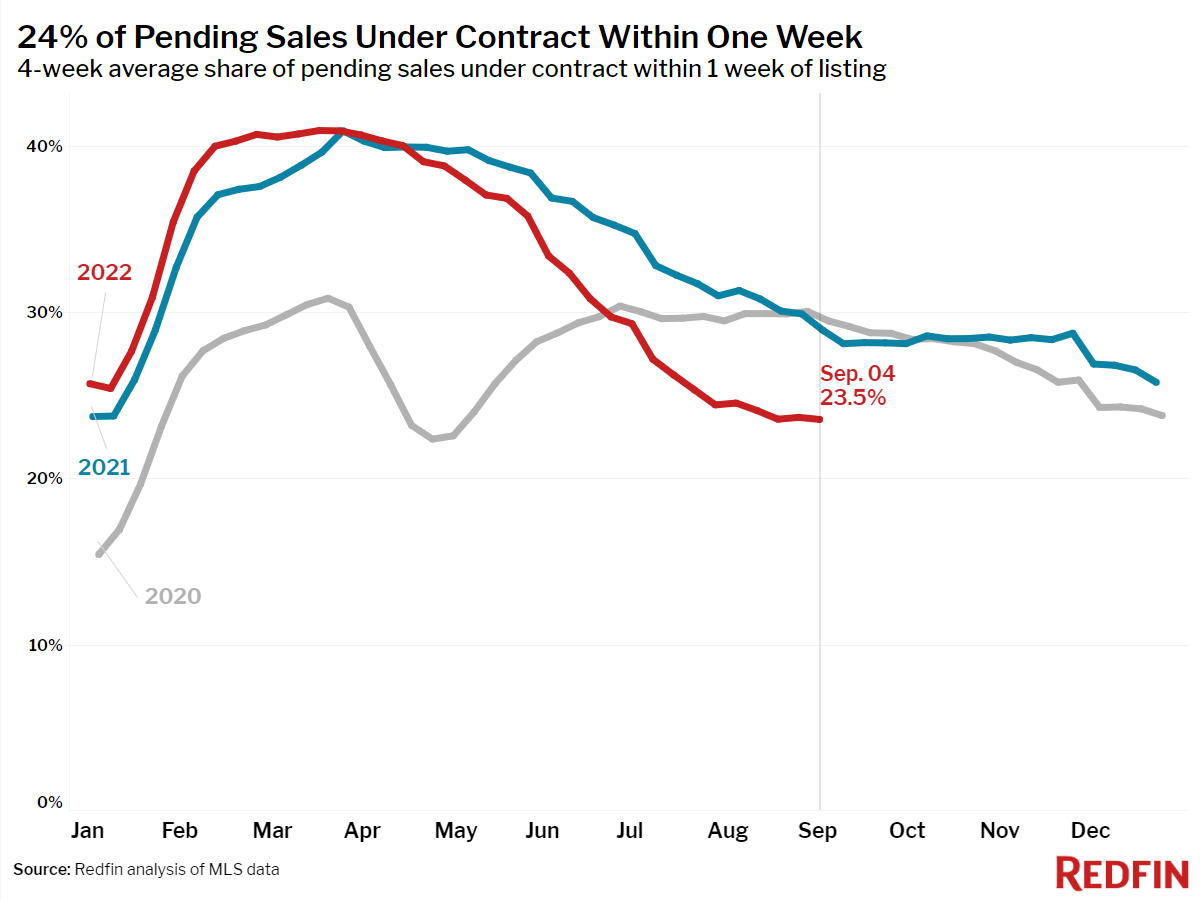
- 24% of homes that went under contract had an accepted offer within one week of hitting the market, little changed from the prior four-week period but down from 29% a year earlier.
- Homes that sold were on the market for a median of 27 days, up from 22 days a year earlier and the record low of 17 days set in May and early June.
- 35% of homes sold above list price, down from 49% a year earlier.
- On average, 7.3% of homes for sale each week had a price drop.
- The average sale-to-list price ratio, which measures how close homes are selling to their asking prices, fell to 99.7% from 101.2% a year earlier.
Refer to our metrics definition page for explanations of all the metrics used in this report.